I. INTRODUCTION
The growing demand of high performance fuels, associated with environmental regulations and the continuous decrease in the quality of petroleum feedstock, demands the development of better catalysts for sulfur removal from diesel fuels, being this challenge one of the most significant for refining industry.
At present, catalysts based on transition metals that are used to treat crude oil fractions show low tolerance to sulfur atoms, leading to an accelerated deactivation and breakdown of the catalyst. Traditional hydrodesulfurization (HDS) catalysts are composed of active molybdenum or tungsten sulfides, promoted by cobalt or nickel and supported on alumina (–Al2O3).Reference Méndez, Franco-López, Bokhimi, Solís-Casados, Escobar-Alarcón and Klimova1,Reference Song2 However, due to its limited activity, these catalysts present disadvantages when ultra-low sulfur diesel (ULSD) is required. Thus, to reach the low sulfur concentration established by the regulations, it is necessary to develop new HDS catalysts with improved activities.
In recent times, many efforts are aimed to improve the performance of hydrotreating catalysts, by using mixed oxides,Reference Gutiérrez, Singh, Schachtl, Kim, Kondratieva, Hein and Lercher3–Reference Rana, Srinivas, Maity, Murali Dhar and Prasada Rao7 zeolites,Reference Bataille, Lemberton, Pérot, Leyrit, Cseri, Marchal and Kasztelan8–Reference Kresge, Leonowicz, Roth, Vartuli and Beck10 mesoporous molecular sieves,Reference Okamoto, Breysse, Murali Dhar and Song11–Reference Soni, Rana, Sinha, Bhaumik, Nandi, Kumar and Dhar15 and clays,Reference Rao, Dhar, Advances, Aspects, Studies and Science16 since the properties of the sulfide phase have been observed to be strongly affected by the nature of catalyst supports.Reference Gutiérrez, Singh, Schachtl, Kim, Kondratieva, Hein and Lercher3,Reference Okamoto, Breysse, Murali Dhar and Song11 The selection of the support has an important influence for catalyst final properties, such as aging and deactivation resistance, regeneration, and ease of sulfidation, as well as the recovery of the spent catalysts.Reference Rao17
The variation of catalytic activity due to the support is the result of factors such as variation in dispersion and morphology of the active component as well as the metal–support interactions. The support can also affect the level of metal sulfidation and reactivity by fostering the exposure of some preferably crystallographic planes by edge bonding or basal plane bonding of the sulfide phase. The results in the activity and/or selectivity of the catalyst, due to metal support interactions and morphological characteristics, show that the support is an important component in the catalystsReference Méndez, Franco-López, Bokhimi, Solís-Casados, Escobar-Alarcón and Klimova1 and contributes to define the role of catalyst during the chemical reaction. The support has an indirect participation in determining the effect of promoters by altering the number of atoms that can be accommodated at the edges of the MoS2 structure, and the energetic characteristics of the site where promoter is associated.Reference Méndez, Franco-López, Bokhimi, Solís-Casados, Escobar-Alarcón and Klimova1,Reference Prins, de Beer and Somorjai18 Moreover, not only the chemical nature of the support is important but also the morphology of support since distribution of active sites on the surface and the way molecules reach those sites determines the activity and selectivity of catalysts.
There are many studies carried out on catalysts supported in alumina for HDS, and it has been found that strong metal support interaction that this system presents restrains its use as the HDS catalyst for the production of ULSD. This work aims to evaluate the effect of the support morphology on the catalytic performance of NiMoS catalysts; for this purpose, SiO2 with two different morphologies were used: one is the ordered mesoporous SiO2 structure, known as KIT-6, and the other support consists of nonporous SiO2 nanoparticles.
II. EXPERIMENTAL SECTION
A. Synthesis of supports
The KIT-6 material was prepared according to the modified methodology proposed by Soni et al.Reference Soni, Rana, Sinha, Bhaumik, Nandi, Kumar and Dhar15 employing a triblock copolymer (P123, Sigma-Aldrich, St. Louis, Missouri) poly(ethylene oxide)–poly(propylene oxide)–poly(ethylene oxide) as the structure directing agent. Commercial Degussa Aerosil® D380 silica (S BET = 380 m2/g, V pore = 0.47 cm3/g; Evonik Corporation, Piscataway, New Jersey) is used as support (nonporous nanospheres of SiO2)
B. Catalyst preparation
The catalysts were prepared using a sequential impregnation technique. For this purpose, in the first step, the supports were first impregned with an aqueous solution containing the desired amount of nickel nitrate hexahydrate (98.5%, Aldrich), followed by the impregnation of ammonium heptamolybdate (99%, Aldrich) solution. The pH of the precursor solutions was around 6. After each impregnation step, the samples were first dried at 60 °C for 2 h, and after the second impregnation calcined at 500 °C for 5 h maintaining a static air atmosphere. The Ni/(Ni + Co) molar ratio was 0.5 and the total of metal loading was 16% (w/w).
Catalysts were sulfided on a tubular furnace under a H2S/H2 (15% (v/v) H2S) mixture gas flow at 45 mL/min following a three-step sequence: (i) at room temperature for 3 h; (ii) at 300 °C for 3 more hours, and (iii) the atmosphere was switched to N2/H2 [10% (v/v) H2] and furnace was heated to 400 °C at 4 °C/min and kept at that temperature for 2 h. Based on the support, the catalysts were named as NiMo/KIT-6, NiMo/Nanosilica. As a reference, a NiMo/Al2O3 commercial catalyst (NiMo-Ref) was evaluated in the same conditions of the catalyst synthesized in this work.
C. Chemical and physicochemical characterization
The support and catalysts were characterized by X-ray diffraction (XRD). XRD patterns were obtained with a Panalytical Xpert’PRO powder diffractometer (Anton Parr, Cu Kα1 radiation, 0.154056 nm) operating at 35 mA and 40 kV using a step size of 0.05° (2θ) and 100 s as the count time per step. Diffraction patterns were analyzed using standard JCPDS files. The textural materials properties were determined by nitrogen adsorption–desorption isotherms obtained at −196 °C on Quantachrome Autosorb equipment (Autosorb-iQ, Quantachrome, Boynton Beach, Florida). The surface area was calculated using the Brunauer–Emmett–Teller (BET) analysis at relative partial pressures (P/P 0) ranging from 0.05 to 0.3. The total pore volume and pore size distribution were obtained by using the desorption curve and the Barrett–Joyner–Halenda model at a P/P 0 of 0.98. The samples were dried at 300 °C for 12 h under vacuum before the N2 adsorption–desorption analysis. Transmission electron microscopy (TEM) images of the catalysts were obtained on a Hitachi(TM)®7700 TEM (Tokyo, Japan). The samples of catalysts were ground, suspended in isopropyl alcohol, and ultrasonically dispersed. Dispersion drops were placed on a copper–carbon grid, and 20–30 representative micrographs were obtained for each catalyst in the high-resolution mode. All measurements were performed manually with software Image Pro Plus version 6.0 (Media Cybernetics, Rockville, Maryland). Statistical analysis of the length and stacking degree of the MoS2 slabs was made in at least 600 crystallites distributed on 20 micrographs for each catalyst and according to the following Eq. (1), the average slab length  $\bar{L}$ and stacking layer number
 $\bar{N}$ were estimated by means of Origin 9.5 software (OriginLab Corporation, Northampton, Massachusetts):
 $$\bar{N}\left( {\bar{L}} \right) = {{\sum\limits_{i = 1}^n {{n_i}{C_i}} } \over {\sum\limits_{i = 1}^n {{n_i}} }}\quad ,$$
where C i is the slab length or stacking layer number of a stacked MoS2 unit and n i is the number of slabs or stacks in a given range of lengths or stacking layer numbers. The MoS2 dispersion (f Mo) on the support surface was also calculated using the following Eq. (2) reported in the literatureReference Han, Nie, Long, Li, Yang and Li19,Reference Zhou, Zhang, Zhou, Qiang, Du, Ding, Jiang and Zhang20 :
 $${f_{{\rm{Mo}}}} = {{{\rm{M}}{{\rm{o}}_{{\rm{edge}}}}} \over {{\rm{M}}{{\rm{o}}_{{\rm{total}}}}}} = {{\sum\limits_{i = 1}^t {6\left( {{n_i} - 1} \right)} } \over {\sum\limits_{i = 1}^t {\left( {3n_i^2 - 3{n_i} + 1} \right)} }}\quad ,$$
where Moedge is the number of Mo atoms located on the edges of NiMoS slabs, Mototal is the total number of Mo atoms, n i is the number of Mo atoms along one edge of a MoS2 slab determined from its length (L = 3.2(2n i − 1)Å), and t is the total number of slabs determined by at least 800 MoS2 slabs taken from high-resolution transmission electron microscopy (HRTEM) images of different catalysts.Reference Zhou, Zhang, Zhou, Qiang, Du, Ding, Jiang and Zhang20 For XPS analysis, fresh sulfide catalysts were analyzed to study the degree of sulfidation of the supported species. An Escalab 250Xi spectrometer (Thermo Fisher, Waltham, Massachusetts) equipped with hemispherical electron analyzer and an Al Kα (hv 1486.68 eV) X-ray source was used. Fresh sulfide catalysts were kept under N2 atmosphere to avoid exposure to air. The catalysts were degassed at 10−5 mbar and then transferred to the ion-pumped analysis chamber, where residual pressure was kept below 10 × 10−8 mbar during data acquisition. Peak fitting of all spectra was performed after the Shirley background correction and asymmetrical Gaussian/Lorentzian mixed function. Surface atomic ratios were calculated from the peak area ratios normalized by the corresponding atomic sensitivity factors. Infrared (IR) spectra of the pure supports were recorded using a Nicolet Magna-IR 750 spectrometer series II (Thermo Fisher, Waltham, Massachusetts), using a cell with ZnSe windows, inside the cell was placed the previously made tablet with KIT-6 and Nanosilica supports. The tablets were heated to 200 °C in air and an IR was taken, then it was given a treatment with n-butilamine for 30 min and then a flow of air was left to remove the excess n-butilamine. Afterwards the tablets were heated with a 50 °C ramp to observe IR changes.
D. Catalytic activity
The catalytic activity of the catalysts was evaluated in hydrodesulfurization of dibenzothiophene (DBT) in a batch reactor. 0.5 g of sulfided catalyst was transferred to the reactor (Parr Instruments, Moline, Illinois; 1 L) under inert atmosphere, and the reactions were carried out at 350 °C and 3.3 MPa of total pressure, using a reactant solution of DBT (3.3 g) in decahydronaphthalene (150 mL) as the solvent. Aliquots were taken every 30 min for 5 h and the reaction evolution was followed by analyzing the collected samples on a Perkin-Elmer Claus 500 gas chromatograph (Perkin Elmer, Waltham, Massachusetts), equipped with a flame ionization detector, an OV-17 packed column, and an auto sampler. For the determination of reaction rate constants (k), a pseudo zero-order reaction kinetic was considered.Reference Rao, Dhar, Advances, Aspects, Studies and Science16,Reference Sollner, Gonzalez, Leal, Eubanks and Parsons21 The detectable products for HDS of DBT were biphenyl (BF) formed through the direct desulfurization pathway (DDS), cyclohexylbenzene (CHB) and a small amount of dicyclohexyl (DCH) and tetrahidrodibenzothiophene (THDBT) formed along the hydrogenating pathway (HYD). Since these trajectories are parallel, the HYD/DDS selectivity ratio is based on the product concentration ratio ([CHB + DCH + THDBT]/BF).
III. RESULTS
A. XRD analysis
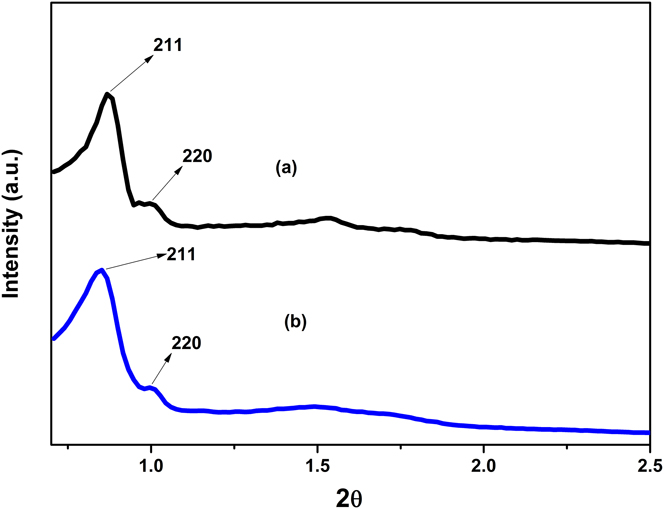
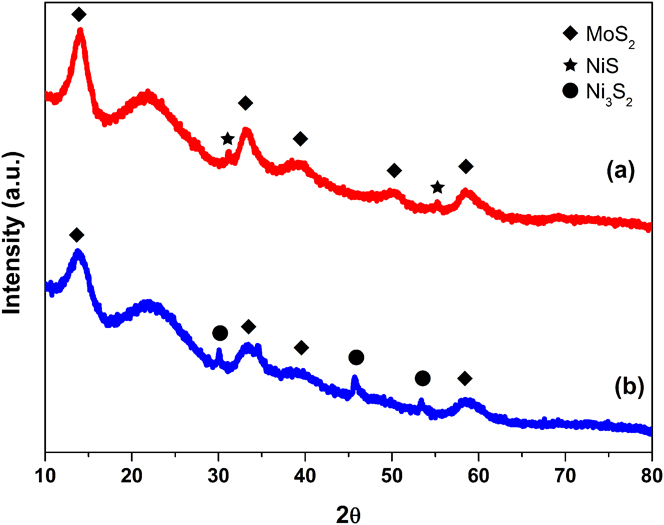
The ordered mesoporosity of the SiO2 type KIT-6 material was confirmed by the low angle XRD technique [Fig. 1(a)]; The XRD pattern shows a sharp intense peak at 0.9 2θ degrees corresponding to (211) plane and a hump for (220) plane and series of overlapping peaks between 1.5° and 2° attributed a (332) reflections. The XRD pattern clearly indicates that KIT-6 is a well-ordered mesoporous material and belong to bicontinuous cubic space group Ia 3d.Reference Soni, Rana, Sinha, Bhaumik, Nandi, Kumar and Dhar15,Reference Liu, Tian, Yu, Gao, Xie, Tu, Che, Peng and Zhao22–Reference Wei, He, Cheng, Yang, Zeng, Kang, Qian and Zhu25 Figure 1(b) shows the low angle XRD patterns of the NiMo/KIT-6 sulfide catalyst, and as can be seen, XRD patterns clearly show the long range 3-D cubic symmetry of the space group Ia 3d, with the sharp peak due to the (211) reflection, thus suggesting that the mesoporous cubic structure remains even after metal loading.Reference Soni, Rana, Sinha, Bhaumik, Nandi, Kumar and Dhar15,Reference Liu, Tian, Yu, Gao, Xie, Tu, Che, Peng and Zhao22,Reference Liu, Chen, Peng, Hu, Li, Song, Li, Zhang and Li24–Reference Zhao, Zheng, Zheng, Zhan and Zheng26 The X-ray patterns at high angles of supports and catalysts are shown in Fig. 2. The NiMo/KIT-6 and NiMo/Nanosilica sulfide catalysts exhibited the broad signal between 16° and 30° 2θ typical for amorphous silica and diverse weak diffraction peaks indexed to hexagonal-phase MoS2 (JCPDS 37-1492). The variation between intensity of the reflections assigned to MoS2 in mesoporous silica and Nanosilica suggests a slightly higher stacking degree of the MoS2 slabs in the catalyst supported in Nanosilica; this was confirmed through the determination of the stacking degree of MoS2 slabs using the Scherrer equation applied to the (002) diffraction peak. Stacking degree values are 6.6 and 7.1 for KIT-6 and Nanosilica, respectively.Reference Wei, He, Cheng, Yang, Zeng, Kang, Qian and Zhu25,Reference Alonso-Núñez, Bocarando, Huirache-Acuña, Álvarez-Contreras, Huang, Bensch, Berhault, Cruz, Zepeda and Fuentes27 In both cases, diffraction peaks of the nickel sulfide phase can be detected; however, the NiMo/KIT-6 catalyst appears to have higher crystallinity for nickel sulfide phase than the other catalyst.
Low angle XRD patterns of (a) KIT-6 and (b) NiMoS catalyst supported on KIT-6.

Wide angle XRD patterns of (a) NiMoS/Nanosilica and (b) NiMoS/KIT-6.

B. Surface area analysis
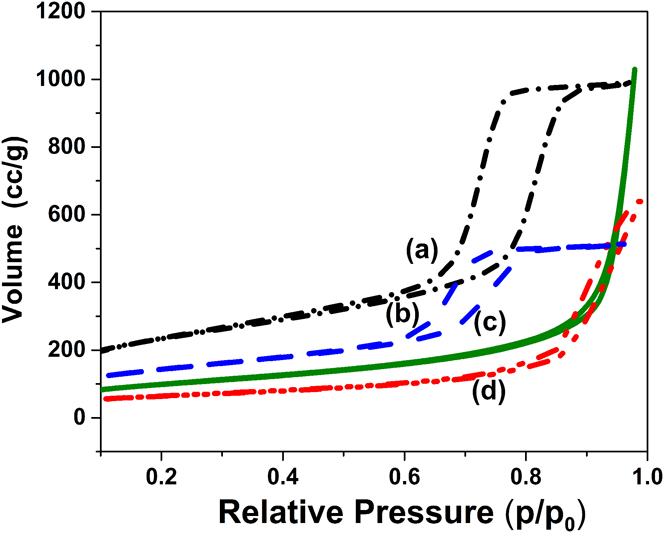
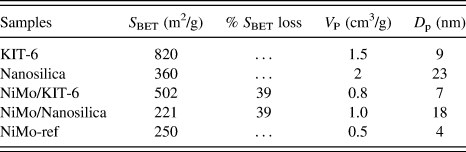
N2 adsorption–desorption isotherms of supports and the sulfided catalysts are shown in Fig. 3. The KIT-6 support and NiMo/KIT-6 sulfided catalyst present typical type IV isotherms with H1 type hysteresis loops and a sharp capillary condensation step in the 0.6–0.85 P/P 0 range, indicative of large channel-like cylindrical pores with a narrow range pore-size distribution, which is typical of the well-ordered mesoporous system KIT-6.Reference Soni, Rana, Sinha, Bhaumik, Nandi, Kumar and Dhar15,Reference Wu, Duan, Zhao, Qi, Li, Liu, Jiang, Liu, Wei and Zhang23–Reference Wei, He, Cheng, Yang, Zeng, Kang, Qian and Zhu25 Nanosilica support and NiMo/Nanosilica sulfide catalyst present a type II isotherms characteristic of nonporous or macroporous material. The impregnation of active species to the support resulted in a slight decrease of S BET, V p, and D p. No changes were detected in the nature of the isotherm or in the shape of the hysteresis loop indicating that the support structure is preserved after Mo and promoter deposition. Nevertheless, the volume of N2 adsorption above 0.95 P/P 0 decreased after Mo and Ni loading. This change could be explained as the filling of the voids of aggregated spheres of nanosilica by active species. The pore size and surface area (S BET) of supports, NiMo/KIT-6, NiMo/Nanosilica, and NiMo-Ref catalysts are summarized in Table I. The NiMo/KIT-6 catalyst presented a higher surface area value compared to the NiMo/Nanosilica catalyst and NiMo-Ref catalyst based on alumina. Comparing the S BET values of the catalysts obtained on the different supports of this work, it is possible to see that the incorporation of active phase reduces in the same percentage (≈38%) the area value of the correspondent original supports. However, since the starting S BET of mesoporous KIT-6 support is considerably higher that of Nanosilica, it is expected a higher metal dispersion for the catalyst supported on KIT-6.
N2-physisorption isotherms of (a) support KIT-6, (b) NiMo/KIT-6, (c) Nanosilica, and (d) NiMo/Nanosilica.

Textural characteristics of KIT-6, Nanosilica, and NiMo/Al2O3 supported catalysts.

Regarding the average pore diameter, the value reported for pure Nanosilica consists on the space between primary nanospheres, whose diameter is around 10 nm, which are sintered to conform aggregates that present lengths around 150 nm. While D p from the catalyst supported on Nanosilica, it is a combination of the packing of aggregates and the porosity formed during metallic sulfide impregnation.
C. TEM analysis
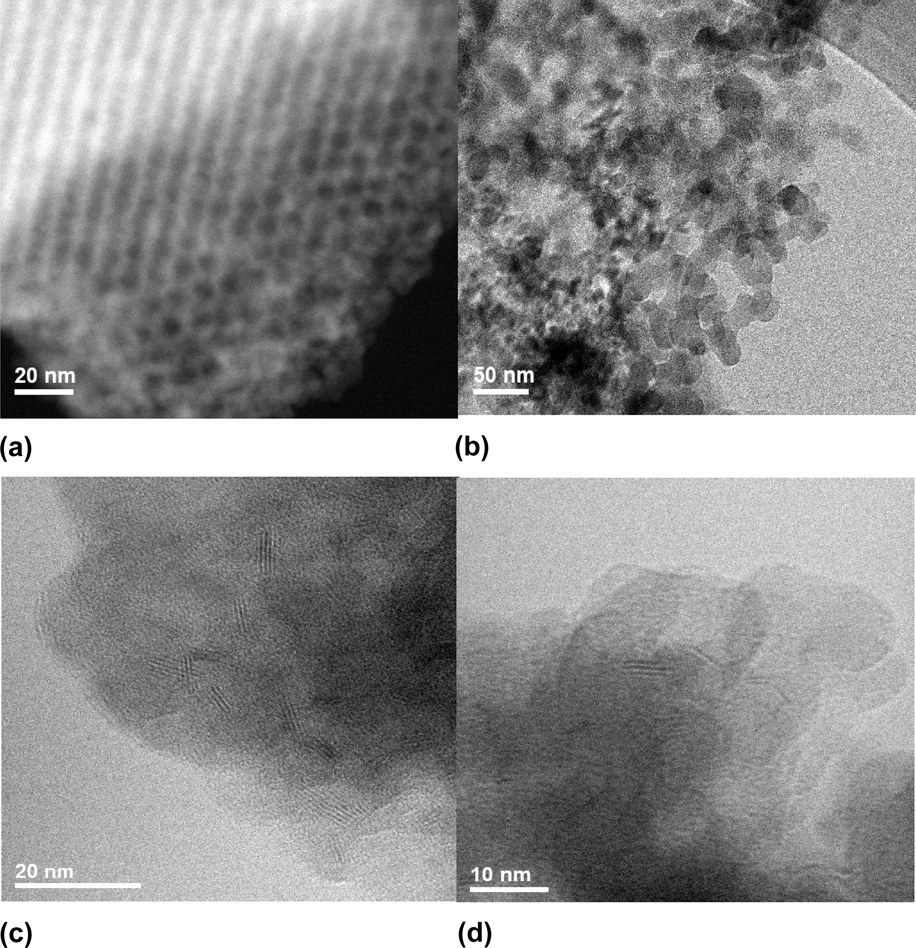
Representative TEM micrographs from the supports and catalysts are shown in Fig. 4. Figure 4(a) shows the KIT-6 micrograph and as can be seen, the ordered mesoporous structure with a regular alignment of cylindrical pores was formed,Reference Soni, Rana, Sinha, Bhaumik, Nandi, Kumar and Dhar15,Reference Liu, Tian, Yu, Gao, Xie, Tu, Che, Peng and Zhao22,Reference Liu, Chen, Peng, Hu, Li, Song, Li, Zhang and Li24,Reference Wei, He, Cheng, Yang, Zeng, Kang, Qian and Zhu25 which is in agreement with XRD and N2 adsorption–desorption results. In the case of nanosilice [Fig. 4(b)], it is possible to observe that SiO2 primary nanospheres present diameters around 10 nm and that they are sintered forming agglomerates.
TEM of support and sulfided catalysts: (a) KIT-6, (b) Nanosilica, (c) NiMo/KIT-6, and (d) NiMo/Nanosilica.

For both catalysts, NiMo/KIT-6 and NiMo/Nanosilica, TEM micrographs show the presence of typical layered structures of the MoS2 phase. Ramos et al. have reported that through the HRTEM techniques, the existence of different morphologies of laminar structures of MoS2 (i.e., Nanorods, nanotubes, spheres, bundles, etc.) can be demonstratedReference Ramos, Berhault, Ferrer, Torres and Chianelli28; in the case of the present work, it is observed layered stacked nanostructures. Stacked black stripes that can be seen in TEM images correspond to the layers of MoS2 crystallites with a stacking spacing of about 0.615 nm for NiMo/KIT-6 catalysts and 0.632 nm for NiMo/Nanosilica. In the case of NiMo/KIT-6 catalysts, the interplanar d 002 spacing of crystalline MoS2 is consistent with the literature.Reference Klimova, Calderón and Ramírez13 On the other hand, the NiMo/Nanosilica catalyst showed greater spacing between the layers. In this aspect, Ramos et al. explained that the increase of the interlayer distance between MoS2 slabs is due to the formation of the MoS2/Co9S8 interface and also probably from the rotation of the MoS2 layers from each other about the a-axis.Reference Ramos, Berhault, Ferrer, Torres and Chianelli28
The average slab length, average layer number, and Mo species dispersion (f Mo) were calculated according to equations mentioned in Sec. II.C. The average length in both the catalysts was of 3.7 nm and average stacking number for NiMo/KIT-6 and NiMo/Nanosilica catalysts was 3.2 and 3, respectively. The results suggest that the dispersion of the active phase is similar in the NiMo/KIT-6 catalyst and the NiMo/Nanosilica catalyst with a value of 0.38. In comparison, a smaller dispersion of Mo was found for the NiMo-Ref catalyst, with a value of 0.32 and average slab length of 4.2 nm, as well as the average stacking number of 3.4.
For the mesoporous structure of KIT-6, the MoS2 crystallites were preferably observed outside the pores, that is, in the outermost surface area of the KIT-6 support.
D. XPS characterization
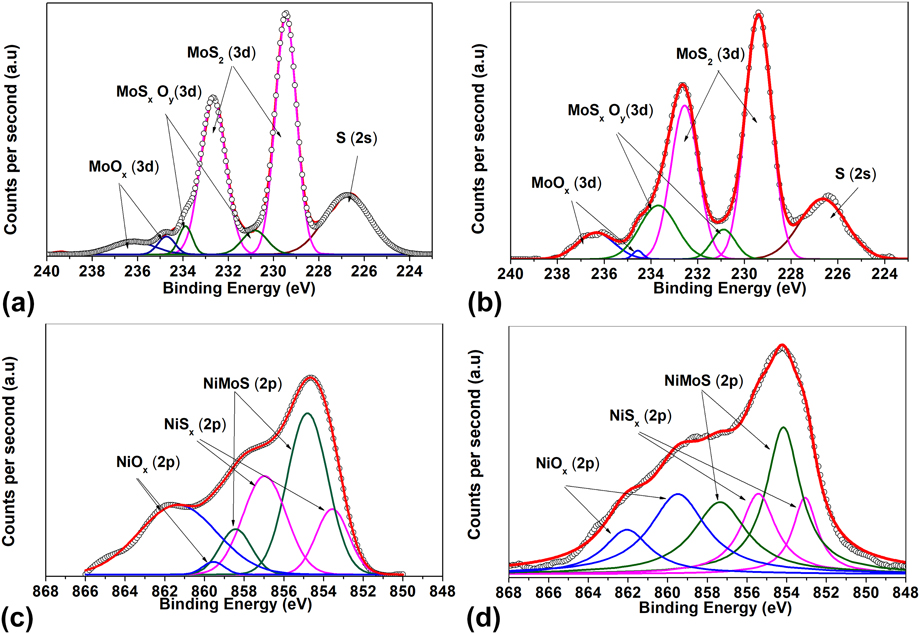
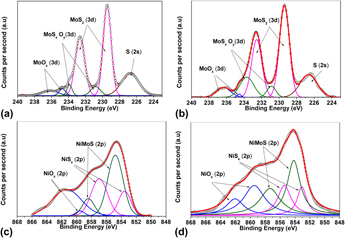
The surface components and chemical states of metal species on the sulfided catalysts were studied by XPS survey spectra. The Mo 3d spectra of NiMo/KIT-6 and NiMo/Nanosilica catalysts are presented in Fig. 5. The Mo 3d spectrum of each of the sulfurized catalysts observed in the images shows the doublets corresponding to the contributions of Mo 3d 5/2 and Mo 3d 3/2 originated by Mo6+ (oxidized species), Mo5+ (oxide-sulfur species), and Mo4+ (molybdenum sulfide).Reference Wu, Duan, Zhao, Qi, Li, Liu, Jiang, Liu, Wei and Zhang23,Reference Frizi, Blanchard, Payen, Baranek, Rebeilleau, Dupuy and Dath29 A simple peak is also observed in 226.5 eV that corresponds to S 2s. The doublet located at 229.6 eV corresponds to MoS2 (active phase of the catalyst), the doublet located at 230.2 eV corresponds to MoSxOy (species in the oxide-sulfide phase), and the doublet located at 233.05 eV corresponds to MoOx (polymorphites in oxidized phase). In the images, it can be observed that there are significant changes in intensity in each catalyst. The deconvolution of the mentioned peaks is summarized in Table II. To obtain the signals of each molybdenum species, the contributions of the corresponding doublets were taken into account. The NiMo/KIT-6 catalyst showed a higher sulfidation degree of molybdenum with 83% of the MoS2 phase, compared to the NiMo/Nanosilica catalyst with 74%.
Mo 3d and Ni 2p XPS spectra of the sulfide catalyst: (a) Mo of NiMoS/KIT-6, (b) Ni of NiMoS/KIT-6, (c) Mo of NiMoS/Nanosilica, and (d) Ni of NiMoS/Nanosilica.

Semiquantitative analysis of Mo 3d and Ni 2p XPS spectra of sulfided catalysts.

For the analysis of Ni species, the spectrum decomposed considering the existence of three chemical species: NiSx nickel sulfide that can be originated from Ni2S3, Ni9S8, or NiS whose energies are between 853.5 and 853.8 eV; the nickel oxide deposited on the surface of the support; and the nickel that is in the phase called “NiMoS” in the molybdenum disulfide crystal.
The Ni 2p spectra of the NiMo/KIT-6 and NiMo/Nanosilica catalysts present three main species. It is appreciated that there is a large amount of species associated with the NiMoS phase (854.9 eV) for both catalysts. On the other hand, the contribution of the NiSx phase (Ni2S3, Ni9S8 or NiS) (853.5 eV) represents a significant amount in the catalysts, being higher for NiMo/KIT-6 (31 versus 24%). The rest of Ni remains as NiOx phase (858.0 eV) and for NiMo/Nanosilica, the amount reached 36%. Thus nickel was less sulfidated than molybdenum for both catalysts, and comparison of supports shows that KIT-6 allows a better sulfidation of the Ni (72%) than the Nanosilica support (64%).
E. IR analysis
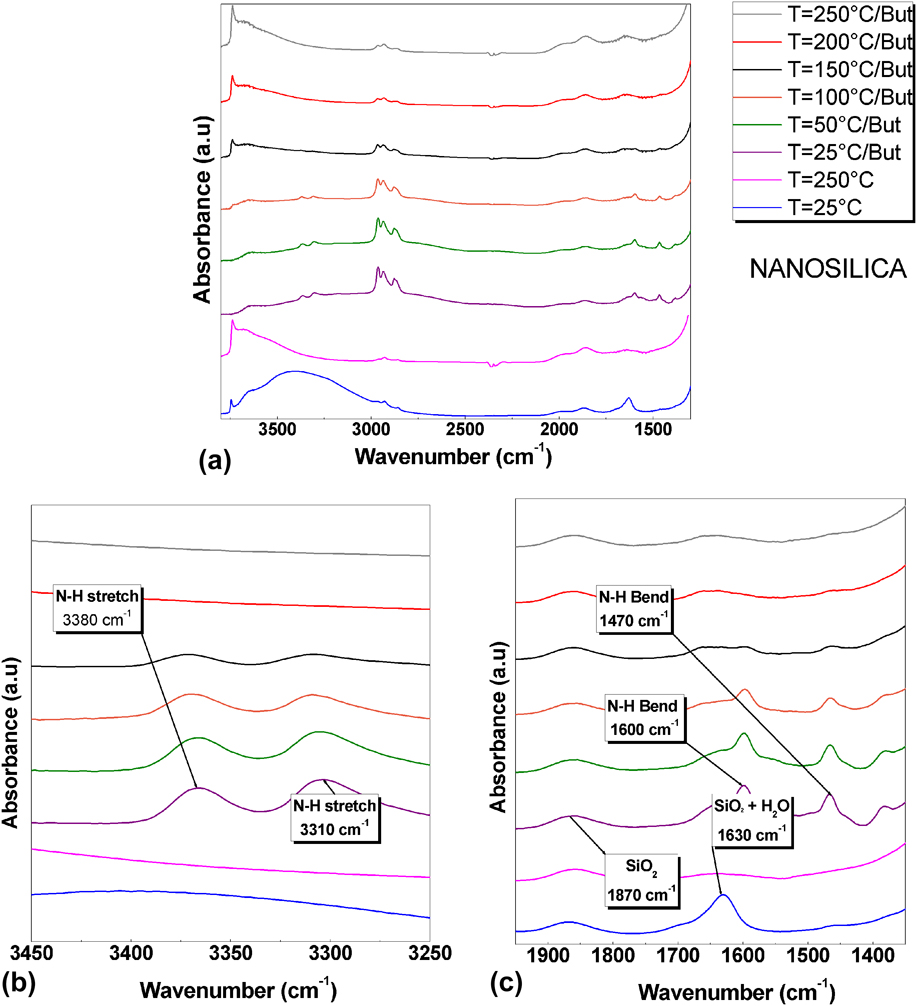
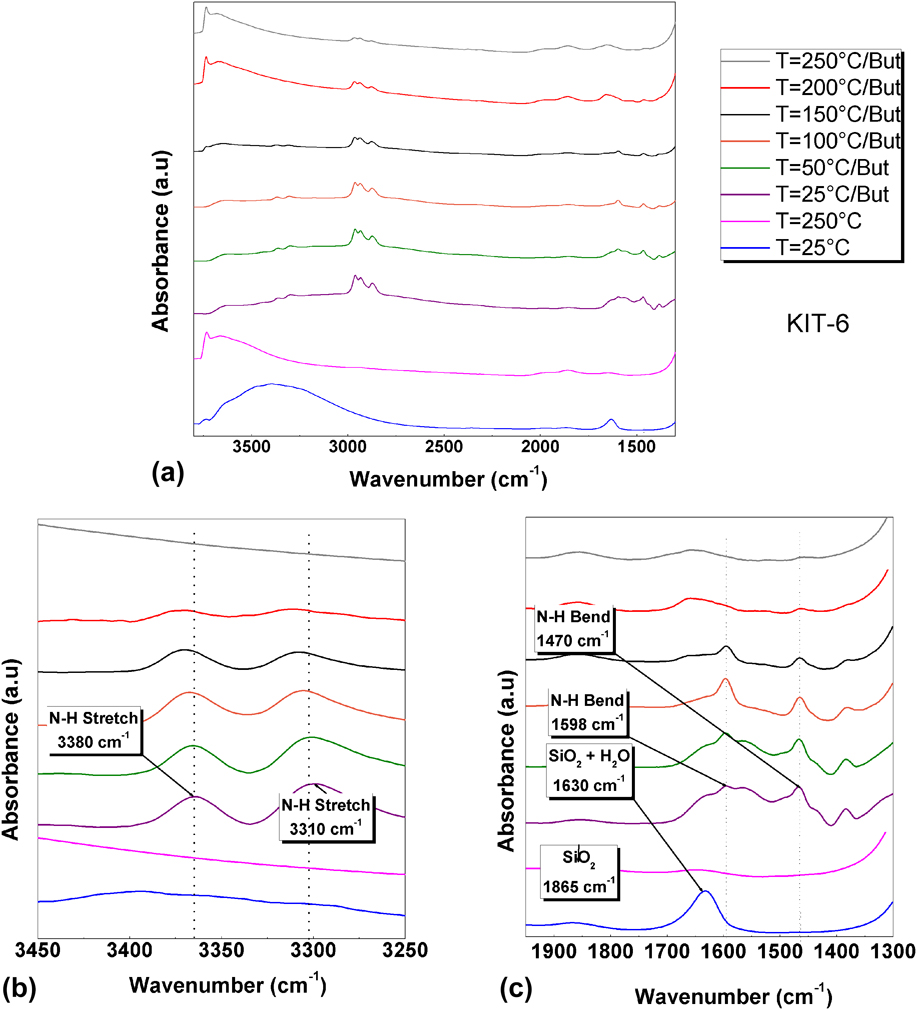
Figures 6 and 7 show the FT-IR spectra of the support of Nanosilica, KIT-6, and the adsorption and desorption of n-butylamine on each of the supports. The IR spectra of Nanosilice and KIT-6 at room temperature shown in Figs. 6(a) and 7(a) show the presence of H2O molecules in both supports, which generate IR bands at around 1630 and 3200–3500 cm−1.Reference Burneau, Barrès, Vidal, Balard, Ligner and Papirer30–Reference Alessi, Agnello, Buscarino and Gelardi32 Since one of the IR bands of the H2O molecules strongly overlaps with the silica band located at about 1630 cm−1. Attention will be focused on other spectral regions at 3200–3500 cm−1. The IR spectra of Nanosilice in Fig. 6(b) and KIT-6 in Fig. 7(b) are presented after a thermal treatment at 250 °C to eliminate humidity, and as can be observed, localized IR band at 3200–3500 cm−1 disappears, likewise the intensity of the IR band at 1630 cm−1 decreases. Bands at 3740 and 1870 cm−1 intensified, which is associated with vibrations of the SiO group in the form of stretching-bending vibration type. This result is essentially in agreement with previous experiments of Kiselev et al., who found that silica is more easily dehydrated than alumina.Reference Burneau, Barrès, Vidal, Balard, Ligner and Papirer30
(a) IR spectra of n-butylamine adsorption in Nanosilica in the range 3800–1300 cm−1, (b) zoom-in view of the spectral range 3450–3250 cm−1, and (c) zoom-in view of the spectral range 1950–1350 cm−1.

(a) IR spectra of n-butylamine adsorption in KIT-6 in the range 3800–1300 cm−1, (b) zoom-in view of the spectral range 3450–3250 cm−1, and (c) zoom-in view of the spectral range 1950–1350 cm−1.

According to research conducted by Takahashi et al. on the adsorption of amines to characterize surface acidity, the physisorbed n-butylamine molecules are desorbed intact, without being subjected to any chemical reaction. However, the desorption of the n-butylamine molecules retained in the Brönsted acid sites (chemical adsorption) occurs through the decomposition of the ions formed by protonation of the n-butylamine by the acid site, as shown in Eqs. (3) and (4), where SOH represents a Brönsted acid site of the supports. This reaction can occur in two ways: one similar to the degradation of Hoffman, where a breakdown of the N–C bond occurs, producing ammonia and butene (the main form of decomposition); or by the breaking of the C–C bond, forming methylamine and propylene.Reference Takahashi, Iwasawa and Ogasawara33 $$
For the adsorption of n-butylamine, both supports show the characteristic absorption peaks; two intense signals, one at 3380 cm−1 related to the asymmetric stretching vibrations of the N–H bond and another at 3310 cm−1, which is attributed to the symmetric stretching vibration of the N–H bond, and the presence of these two signals is a characteristic of primary amines. The bend vibrations of the N–H bond of the primary amines are observed in panel C of both figures, where the corresponding signals are observed at 1470 cm−1 and 1600 cm−1. The intense signals located between 3000 and 2800 cm−1 of Figs. 6(a) and 7(a) are related to asymmetric and symmetrical stretches of the N–H bond, which overlap the C–H band, which is called ammonium band.
After n-butylamine adsorption, thermal treatment made at 50 and 100 °C allowed the physical desorption n-butylamine, and is clear that higher amount of n-butylamine remained on KIT-6; in fact treatment at 150 °C cleaned almost all the surface of Nanosilica, but not from KIT-6, where the molecule is chemically adsorbed. On the other hand, the small desorption generated at temperature above 200 °C in the sample of KIT-6, which is above the boiling point of the amine, is attributed to the n-butylamine molecules that were probably chemically absorbed in the acid sites of KIT-6. It should be noted that in the Nanosilice sample, this desorption is not observed.
F. Activity of catalysts
The catalytic performance of NiMo/KIT-6 and NiMo/Nanosilica sulfide catalysts was evaluated in the HDS of the DBT reaction carried out in a batch reactor at 350 °C under 3.3 MPa of total hydrogen pressure. The activity of the catalysts was compared with a conventional NiMo/Al2O3 catalyst tested under the same operating conditions. DBT conversions at a reaction time of 5 h are summarized in Table III. The overall activity of NiMo/KIT-6 is superior to that of NiMo/Nanosilica and NiMo-Ref over the entire reaction time explored. At a reaction time of 5 h, the NiMo/KIT-6 and NiMo/Nanosilica sulfide catalysts have a DBT conversion of 70% and 50%, respectively. As compared with the NiMo/KIT-6, the NiMo-Ref catalyst has 10% less DBT conversion (60%); however, the NiMo/Nanosilica sample was less active than the NiMo-Ref catalyst. All catalysts studied presented pseudo-zero order kinetics.
DBT conversion and products distribution for the HDS reaction of DBT.

a Reaction conditions were T = 350 °C, PH2 = 3.3 MPa, t = 5 h.
b Achieved at DBT conversion of 50%.
THDBT: tetrahydrodibenzothiophene; BP: biphenyl; CHB: cyclohexylbenzene; DCH: dicyclohexyl.
To elucidate the influence of the support morphology and the effect of the promoter on the reaction pathways in the HDS of DBT, Table III summarizes product distributions at the same DBT conversion (50%). For all the catalysts studied, the products detected were biphenyl (BF), cyclohexylbenzene (CHB), dicyclohexyl (DCH), and intermediate tetrahydrodibenzothiophene (THDBT). Contrary to HDS of DBT over NiMo/Al-MCM-41Reference Wei, He, Cheng, Yang, Zeng, Kang, Qian and Zhu25 hydrocracking products, such as benzene and cyclohexane, were not detected. This is probably because of the low acidity displayed by our catalysts. It is known that DBT conversion can occur through two parallel reaction pathways: (i) direct desulfurization (DDS) route, which involves the hydrogenolysis of C–S with no hydrogenation of the aromatic rings (BF formation); and (ii) hydrogenation (HYD) of one and two aromatic rings of DBT leading to the formation of intermediate THDBT and CHB, respectively.Reference Zhao, Zheng, Zheng, Zhan and Zheng26,Reference Huirache-Acuña, Pawelec, Loricera, Rivera-Muñoz, Nava, Torres and Fierro34
The (CHB + DCH + THDBT)/BF ratio describes the ratio between the HYD/DDS routes; the HYD/DDS selectivity ratio was calculated for the same DBT conversion (50%). Table III compares the HYD/DDS ratio with that of a commercial (NiMo-Ref) catalyst. The values of this ratio indicate that NiMo/KIT-6 and NiMo/Nanosilica sulfide catalysts show the same HYD/DDS ratio, which is only slightly different for the Al2O3 supported catalyst (NiMo-Ref). The yield of HYD route products follows the trend: NiMo/Nanosilica ≈ NiMo/KIT-6 > NiMo-Ref.
IV. DISCUSSION
A. Influence of support on activity
To assess the support effect (KIT-6 versus Nanosilica) on catalytic functionalities and understand how these catalysts perform in comparison with an industrial catalyst, a comparative study of NiMo/KIT-6 and NiMo/Nanosilica catalysts is made. This comparison, shown in Table III, indicates that a KIT-6 supported catalyst is more active than its Nanosilica supported counterpart and the NiMo-Ref catalyst. The NiMo/KIT-6 catalyst presents a surface are that is 2-fold the area of the other catalysts, and most of the available area is reachable by precursor molecules and during reaction, DBT can also diffuse through pores to actives sites inside the KIT-6 structure. Nanosilica support consists on spheres of SiO2 of diameter around 10 nm that conform small agglomerates of around 150 nm; thus accessibility to all surface is higher than that of KIT-6, nevertheless the available area is less than the half of KIT-6. Considering that the amount of NiMo per gram of catalyst is the same for NiMo/KIT-6 and NiMo/Nanosilica and that according to DRX analysis the stacking is almost the same (i.e., 6.6 and 7.1 layers, respectively) an explanation of the higher activity on NiMo/Kit-6 is that due to the higher surface area and the structure of support, MoS2 slabs are less larger than the obtained for NiMo/Nanosilica and considering that active sites are related to edges, it is clear that despite the same stacking, available edge surface will be higher for NiMo/KIT-6. Additionally, according to IR results, the NiMo/KIT-6 catalyst presents higher acidity than NiMo/Nanosilica, and as can be seen on Table III, product distribution is more like the obtained for the NiMo-Ref catalyst, which support has acidic nature (Al2O3) than that obtained for NiMo/Nanosilica.
B. Effect of active phases on activity
The Ni-promoted Mo/KIT-6 catalyst presents a larger HDS activity than its Ni-promoted Mo/Nanosilica and NiMo/Al2O3 reference catalyst. As was mentioned before, differences concern textural characteristics and acidity of supports. Another important difference observed among catalyst is that for NiMo/KIT-6, higher amount of molybdenum was sulfided, being almost 10% superior to the amount sulfided in NiMo/Nanosilica, which also contributes to explain the highest activity of the NiMo/KIT-6 catalyst. Ni used as the promoter was integrated to MoS structures almost in the same amount, unless higher amount of NiOx was formed on the NiMo/Nanosilica catalyst, thus total amount of sulfided Ni is higher than NiMo/KIT-6 catalyst, which also is associated with the higher performance of this catalyst.
V. CONCLUSION
In the present work, NiMo HDS catalysts were prepared by using SiO2 as support in the form of 3D cubic mesoporous structure (KIT-6) and SiO2 nanospheres (Nanosilica). KIT-6 support induced the formation of NiMoS stack structures of limited length inside its mesoporous structure, compared with the obtained on Nanosilica support, where the surface area is external since this material consists of partially agglomerated nanospheres. As both materials presented similar stacking (around 3.7 layers), the result was a higher surface of edges from NiMoS stacks for NiMo/KIT-6 support, leading thus to more than 2-fold the activity on NiMo/Nanosilica. XPS analysis shown that KIT-6 as support allowed better sulfidation of Ni and Mo species, which also contributed the higher performance of the catalyst when compared to the Nanosilica supported, and even to a commercial catalyst used as reference (NiMo/Al2O3).
ACKNOWLEDGMENTS
The authors gratefully acknowledge the Mexican Council of Science and Technology (CONACYT) and the Energy Department (SENER) for supporting this work through the projects CONACYT-SENER-Hidrocarburos No. 120135. In addition, the authors acknowledge the excellent work of César Leyva Porras, Carlos Elías Ornelas Gutiérrez, Francisco Enrique Longoria Rodríguez, Luis Gerardo Silva Vidaurri, and Luis de la Torre Saenz for their technical assistance in this work.