I. INTRODUCTION
Cortical bone is a hierarchical biological material subject to dynamic changes, which has been widely studied from the organ level to the molecular level to assess their mechanical properties, chemical composition and physiological function. Reference Ashman, Cowin, Van Buskirk and Rice1–Reference Ho Ba Tho, Mazeran, El Kirat and Bensamoun4 However, studies of the mechanical response of cortical bone related to aging are not common for humans. Reference Currey, Brear and Zioupos5 This is especially due to the difficulties in building up adequate lifespan models. The studies related to the evolution of the mechanical properties with age are important because bone undergoes changes in its structural composition over the whole lifespan. These variations are related to the changes of the ratio between organic and mineral components of the bone matrix. Reference Currey, Brear and Zioupos5–Reference Willinghamm, Brodt, Lee, Stephens, Ye and Silva12 Previous studies have assessed the evolution of the mechanical properties of cortical bone with age. They used animal lifespan models, ultrasound, Reference Vanleene, Rey and Ho Ba Tho13 and the nanoindentation technique. Reference Busa, Miller, Rubin, Qin and Judex14–Reference Burket, Gourion-Arsiquaud, Havill, Baker, Boskey and van der Meulen17
Nanoindentation technique is commonly used to determine the mechanical response on the microscale for the case of elastoplastic materials Reference Oliver and Pharr18,Reference Lucca, Herrmann and Klopfstein19 and some biological materials. Reference Isaksson, Malkiewicz, Nowak, Helminen and Jurvelin15–Reference Burket, Gourion-Arsiquaud, Havill, Baker, Boskey and van der Meulen17,Reference Rho, Tsui and Pharr20–Reference Ebenstein and Pruitt22 Oliver and Pharr's method Reference Oliver and Pharr18 has been developed to assess the materials elastic modulus and hardness. However, the determination of the mechanical properties of viscous materials is still challenging. Nevertheless, using this technique, Fan and Rho Reference Fan and Rho23 and Vanleene et al. Reference Vanleene, Mazeran and Ho Ba Tho24 demonstrated that apparent elastic modulus and hardness of bone are strongly affected by the strain rate of the test. These results stress the need for developing new methods to assess mechanical properties from nanoindentation experiments taking into account the time-dependent behavior.
As far as we know, Oyen and Cook Reference Oyen and Cook25 were one of the first to use a rheological method to investigate the time-dependent mechanical response of polymers during nanoindentation experiments. This method were used to assess the time-dependent behavior of biological materials such as healing bone Reference Oyen and Ko26 and cortical bone. Reference Oyen27–Reference Rodriguez-Florez, Oyen and Shefelbine29 Another study investigated the viscoelastic responses on cortical and trabecular bones. Reference Isaksson, Malkiewicz, Nowak, Helminen and Jurvelin30 Isaksson et al. (2010a) Reference Isaksson, Malkiewicz, Nowak, Helminen and Jurvelin15 were the first to characterize time-dependent mechanical properties in a cortical bone lifespan model. These studies demonstrated that different time-dependent methods can be developed and adapted depending on one's research interests. However, the methods reported characterize just the viscous–elastic–plastic response and do not discriminate between the viscoelastic and the viscoplastic responses of the material.
In the present study, the time-dependent mechanical properties of rat femoral cortical bone from growth to senescence are estimated. A new protocol has been proposed to quantify the viscoelastic and viscoplastic mechanical properties separately. The effects of the strain rate on the material's mechanical response are also explored. Predictive equations are used to quantify the variation in the mechanical properties with aging.
II. MATERIALS AND METHODS
A. Sample preparation
Femoral cortical bones of male rats RJHan:WI Wistar (ages 1, 4, 9, 12, 18, 24 months old) were used. Five samples per age coming from five different specimens were cut transversely at the proximal and distal end of the diaphysis with a diamond saw (Microcut, BROT Technologies, Argenteuil, France). Samples were fixed on a sample holder by an epoxy resin. The exposed surfaces were ground with successive grades of abrasive papers (P800, P1200, P2400, P4000) under abundant deionized water irrigation with a semiautomatic polishing machine (PRESI-Mecatech 234, PRESI, Brié-et-Angonnes, France). The surfaces were then polished with successive grades of alumina suspensions with a particle size of 1, 0.3, and 0.04 µm to ensure that the surface roughness (Ra ∼ 30 nm over 10 × 10 µm² area as measured by Atomic Force Microscopy) is well lower than the final indentation depth (>3000 nm). Finally, the samples were ultrasonically cleaned in ultrapure water (Ultrasonic cleaner Bransonic®200, Branson Ultrasonics Corp., Danbury, CT). Three cycles of 5 min each were performed changing the water at each cycle to remove all alumina particles and other wear debris.
B. Nanoindentation
Nanoindentation tests were performed with a Nano Indenter G200 (Agilent Technologies, Santa Clara, CA) using a Berkovich tip (Micro Star Technologies, Huntsville, TX) and the measurement of the contact stiffness via the Continuous Stiffness Measurement method. A total of 300 indentations (6 ages, 5 samples per age coming from five different specimens and 10 tests per sample) were performed in the longitudinal direction of the femoral section. The samples were stored in physiological solution and then tested in dry conditions. In classical nanoindentation experiments conducted on ideal elastoplastic materials, the two mechanical properties, elastic modulus and hardness, necessary to describe the elastoplastic behavior, are computed via a two-stage protocol: (i) a loading stage generating an elastoplastic response of the sample and (ii) an unloading stage reflecting the elastic return of the sample. In the case of viscous materials like bone, Reference Fan and Rho23,Reference Vanleene, Mazeran and Ho Ba Tho24,Reference Sasaki and Yoshikawa31 the mechanical behavior is composed of elastic, viscoelastic, plastic, and viscoplastic components. To discriminate them correctly four stages are required. Mazeran et al. Reference Mazeran, Beyaoui, Bigerelle and Guigon32 have recently proposed a four-stage protocol composed of a loading stage, a first hold-load plateau, an unloading stage, and a second hold-load plateau. The two hold-load plateaus are needed to discriminate between the reversible and irreversible time-dependent elastoplastic response, i.e., the viscoelasticity and viscoplasticity.
Concretely, the experimental protocol is composed of four steps. The first step is the loading stage at constant loading rate/load (
 ${{\mathop F\limits^ \cdot } \mathord{/ {\vphantom { F}} \right \kern-\nulldelimiterspace} F} = {\rm{\alpha = 0}}{\rm{.05 s}}^{ - 1}$
) leading to an exponential loading (F = F
0exp(αt)) to obtain a constant strain rate,
Reference Lucas, Oliver, Pharr and Loubet33
until an indentation depth of 3 µm. This stage is performed after checking that the thermal drift is inferior to a value of 0.05 nm/s for limiting its influence on the value of the indentation depth. The second step consists in maintaining a hold-load plateau after loading. The hold time (300 s) has been chosen long enough to highlight the relaxation time of the material and to avoid the “nose” phenomenon of the unloading curve;
Reference Oyen and Cook25
and short enough to prevent the effect of the thermal drift. The third step is the unloading stage until 50% of the maximum load at constant unloading rate/load
 ${{\mathop F\limits^ \cdot } \mathord{\left/\kern-\nulldelimiterspace} F}{\rm{ = }} - {\rm{0}}{\rm{.05 s}}^{ - 1}$
to obtain a quasiconstant strain rate. The value of the unloading ratio (F/F
Max) has been chosen to be 50% because it is a good compromise between the generation of a measurable viscoelastic return and keeping a contact area. Results show that beyond an unloading ratio of 25%, the experimental curves cannot be fitted. The last step is to provide a constant load plateau after unloading (300 s).
C. Calculation of the mechanical properties
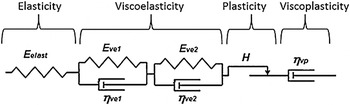
The experimental curves obtained with this protocol are analyzed via a specific method. In the first step, the experimental curves are fitted by an indentation mechanical model based on a set of mechanical elements in series to simulate the different behavior of the materials. A spring that models elasticity, two Kelvin–Voigt elements for two viscoelasticities characterized by two time-constants, a slider for plasticity and a dashpot for viscoplasticity (Fig. 1). Two Kelvin–Voigt elements are adequate to describe correctly the viscoelastic response of the samples in our specific conditions. This description leads to a good fit of the indentation depth versus time, in contrast to a single Kelvin–Voigt element model. The displacement d of each element has a quadratic response to load F
 $$\sqrt F = {k_{\rm{e}}}{d_{\rm{e}}}$$
Material mechanical model used to describe the mechanical behavior of the rat femoral cortical bone. This model is composed of an elastic modulus, two viscoelasticities with different time-constants, a plasticity and a viscoplasticity.

For the spring (elastic response), where k e and d e are the mechanical parameter of the spring and the displacement respectively.
 $$\sqrt F = k_{{\rm{ve1}}} d_{{\rm{ve1}}} + {\rm{\eta }}_{{\rm{ve1}}} \dot d_{{\rm{ve1}}}$$
 $$\sqrt F = k_{{\rm{ve1}}} d_{{\rm{ve1}}} + {\rm{\eta }}_{{\rm{ve2}}} \dot d_{{\rm{ve2}}}$$
For the two Kelvin–Voigt elements (viscoelastic responses) where d ve, k ve, and ηve are the displacement and the mechanical parameters of the Kelvin–Voigt elements respectively.
 $$\sqrt F = pd_{\rm{p}}$$
 $$d_{\rm{p}} \left( {t + {\rm{\Delta }}t} \right) \ge d_{\rm{p}} (t)$$
For the slider (plastic response) where d p and p are the displacement and the mechanical parameter of the slider respectively.
 $$\sqrt F = {\rm{\eta }}_{{\rm{vp}}} \dot d_{{\rm{vp}}}$$
 $$d_{{\rm{vp}}} \left( {t + {\rm{\Delta }}t} \right) \ge d_{{\rm{vp}}} (t)$$
For the dashpot (viscoplastic response), where d vp and n vp are the displacement and the mechanical parameter of the dashpot respectively, the two displacements of the plastic slider and viscoplastic dashpot follow a monotonic law [Eqs. (5) and (7)] for ensuring irreversibility of the response.
Then, the sum of the displacement of all the elements d t is summed and compared with the indentation depth h t .
 $$d_t = d_{\rm{e}} + d_{\rm{p}} + d_{{\rm{ve1}}} + d_{{\rm{ve2}}} + d_{{\rm{vp}}}$$
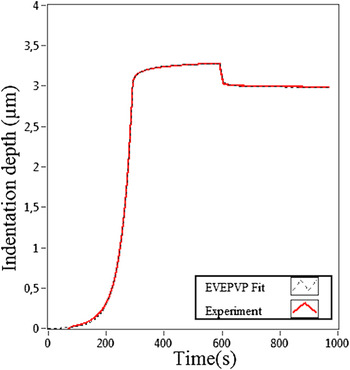
The set of parameters' values that gives the best fit of the indentation depth versus time is established. An excellent agreement is generally observed between the experimental curve and the indentation mechanical model fit (Figs. 1 and 2). To limit the error on the determination of the indentation depth due to the tip defect (missing end of the tip compared with a perfect Berkovich geometry) and roughness, the zero point is determined using the method proposed by Hochstetter et al. Reference Hochstetter, Jimenez and Loubet34 With this method the uncertainties on the zero point is estimated to be approximately 10 nm.
Indentation depth h t (red curve) and sum of the displacement of the mechanical model elements d p (black dashed line) versus time during the nanoindentation experiment. An excellent agreement was found between experimental data and the fit proposed by the mechanical model.

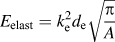
In a second step, the contact area is calculated from the beginning of the unloading curve using the Oliver and Pharr method. The indentation mechanical model used to fit the experimental curve in the first step is transformed into a corresponding material mechanical model composed of one elastic modulus E elas, two viscoelastic moduli composed of an elastic component E ve and viscous component ηve, one hardness H and one viscoplasticity ηvp. These mechanical properties could be related to the parameter values of the spring, Kelvin–Voigt elements, slider, and dashpot respectively of the indentation mechanical model. According to Mazeran et al. Reference Mazeran, Beyaoui, Bigerelle and Guigon32 the mechanical properties can be computed from the equations summarized in Table I by using the parameters of the different elements and the contact area.
Equations used to assess the mechanical properties from the nanoindentation model. The values of the displacement of the different elements are taken at the beginning of the unloading curve, point of the curve from which the contact area is computed.

The method gives excellent fits of the experimental curves on polymers Reference Mazeran, Beyaoui, Bigerelle and Guigon32 and bones. Nevertheless, for different load-time history the method gives different values of mechanical properties. This is due to the difficulties (i) in computing the material mechanical properties from the values of the parameter of the indentation mechanical model, (ii) in differentiating the viscoplastic behavior from the viscoelastic behavior with a long time constant in short-time experiments and in obtaining a unique solution of parameters for a given experimental curve. This phenomenon is a general problem in mechanical characterization and especially in nanoindentation for viscous materials. Reference Chen, Ogasawara, Zhao and Chiba35 Thus the values of the mechanical properties determined by this method and generally by nanoindentation in the case of viscous materials cannot be considered as accurate but only as semiquantitative indications. They could be used for comparison between different materials if the experimental conditions are similar. In the present study, the method is used to highlight the evolution of the different mechanical behaviors with age of rat cortical bone and determine maturation ages.
From this experimental data, the apparent elastic modulus of the samples for a given strain rate
 $\dot \varepsilon$
is computed using the following equations:
First, a reduced apparent elastic modulus E
app* is computed, i.e., the apparent value of the elastic modulus when the sample is strained at a given strain rate
 $\dot \varepsilon$
.
 $${1 \over {E_{{\rm{app}}}^* }} = {1 \over {E_{{\rm{elast}}} }} + {1 \over {E_{{\rm{ve1}}} + {{\dot \varepsilon \eta }}_{{\rm{ve1}}} }} + {1 \over {E_{{\rm{ve2}}} + {{\dot \varepsilon \eta }}_{{\rm{ve2}}} }}$$
The values of the reduced apparent elastic modulus have been calculated for three values of
 $\dot \varepsilon$
equal to (i) 0 s−1 to assess only to the minimum value of the apparent elastic modulus, (ii) 0.05 s−1 corresponding to the typical strain rate used in the nanoindentation tests, and (iii) an infinity value of strain rate to highlight the highest value that can reached by the apparent elastic modulus.
Then, to assess the apparent elastic modulus E app of the sample:
 $${1 \over {E_{{\rm{app}}}^* }} = {{1 - v_{\rm{s}}^2 } \over {E_{{\rm{app}}} }} + {{1 - v_{\rm{i}}^2 } \over {E_{\rm{i}} }}$$
where E i is elastic modulus of the indenter, νi and νs are the Poisson's ratio of the indenter and the sample respectively. Their values for a diamond indenter Reference Oliver and Pharr18 are E i = 1141 GPa and νi = 0.07 and for Poisson's ratio of bone Reference Reilly, Burstein and Frankel36 νs = 0.3. It is necessary to take into account the mechanical properties of the indenter as the value of the apparent elastic modulus could be higher than 40 GPa.
D. Statistical analysis
Statistical analyses were performed to test the evolution of time-dependent mechanical response with age. This task was completed by using the statistical analysis and graphics software SYSTAT version 2012 (SYSTAT Software Inc., San Jose, CA). Tests including all and consecutive age groups were compared by nonparametric Kruskal and Wallis test and Dwass–Steel–Chritchlow–Fligner (DSCF) test. In addition, an exponential growth model for male rats Wistar [Eq. (3)] and their coefficient of determination R 2 were computed for each mechanical property. This equation could be used in growing models to predict the evolution of the mechanical properties related to aging.
 $$X = {k_0}\, ^*\left( {1 - \exp ^{\left( { - k_1 - {k_2}\, ^*{\rm{age}}} \right)} } \right)$$
Where, the X term corresponds to each mechanical property of the model, k 0 is the estimated asymptote value when age approaches infinity. k 1 is the coefficient to adjust the equation for the initial conditions and k 2 is the growth rate. The asymptote value k 0 represents the end of growth; maturation age is computed as 95% of the estimated asymptote (k 0). Our proposed model is similar to most of growth models derived from Gompertz growth curve. Reference Winsor37
III. RESULTS
A summary of all mechanical properties as measured by nanoindentation at each age is presented in Table II. The results have been expressed as the mean ± standard deviation (SD).
Values of the mechanical properties computed from the nanoindentation experiments in the longitudinal direction of the rat femoral cortical bone.

Mean ± standard deviation (SD).
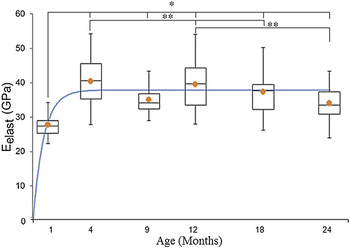
These values are illustrated graphically in box plot mode to represent the variation of the mechanical response (Figs. 3–5) and they are accompanied with the curve generated by the prediction equation.
Variation of elastic modulus E elast of the rat femoral cortical bone with age. Symbol “•” represents the mean value. (Significant differences from the DSCF test *P< 0.001 and **P < 0.05).

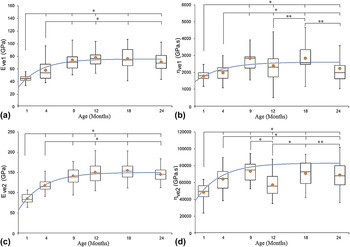
Variation of viscoelastic moduli of the rat femoral cortical bone with age: Elastic components ((a) and (c)) and the viscous component ((b) and (d)). Symbol “•” represents the mean value. (Significant differences from the DSCF test *P< 0.001 and **P < 0.05).

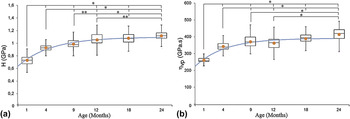
Variation of hardness (a) and viscoplasticity (b) of the rat femoral cortical bone with age. Symbol “•” represents the mean value. (Significant differences from the DSCF test *P< 0.001 and **P < 0.05).

The elastic response E elast is represented (Fig. 3). The E elast is statistically significantly very different (P < 0.001) between 1 and 4 months, the values increase about 50% in a period of 3 months.
The prediction equation of the elastic modulus E elast response as a function of age is represented by the expression:
 $$E_{{\rm{elast}}} = 37.91\,^*\left( {1 - \exp ^{\left( { - 0.01 - 1.19\,^*{\rm{age}}} \right)} } \right)\quad R^2 = 0.79$$
where elastic modulus is expressed in GPa and age in months.
The viscoelastic response of the model was assessed by two Kelvin–Voigt components. The viscoelastic mechanical response is represented (Fig. 4). On the one hand, values of the elastic component of the viscoelastic behavior E ve1 and E ve2 [Figs. 4(a) and 4(c)] increase with statistically significant differences (P < 0.001) between 1 and 9 months of the lifespan. After this age, the mechanical values do not have statistically significant differences until senescence. On the other hand, the viscous component ηve1 and ηve2 [Figs. 4(b) and 4(d)] have a similar evolution in their mechanical behavior. Values increase between 1 and 9 months with statistically significant differences (P < 0.001). However, after this period important dispersions were noted. For ηve2 at 12 months old, the values decrease and the statistical tests show significant differences (P < 0.001) between age groups.
Each mechanical component of the viscoelastic response can be represented by the following prediction equations:
 $$E_{{\rm{ve1}}} = 75.80\,^*\left( {1 - \exp ^{\left( { - 0.53 - 0.28\,^*{\rm{age}}} \right)} } \right)\quad R^2 = 0.94$$
 $${\rm{\eta }}_{{\rm{ve1}}} = 2611\,^*\left( {1 - \exp ^{\left( { - 0.82 - 0.23\,^*{\rm{age}}} \right)} } \right)\quad R^2 = 0.61$$
 $$E_{{\rm{ve2}}} = 150.25\,^*\left( {1 - \exp ^{\left( { - 0.49 - 0.25\,^*{\rm{age}}} \right)} } \right)\quad R^2 = 0.99$$
 $${\rm{\eta }}_{{\rm{ve2}}} = 83,165.48\,^*\left( {1 - \exp ^{\left( { - 0.63 - 0.25\,^*{\rm{age}}} \right)} } \right)\quad\! R^2 = 0.60$$
Elastic moduli are expressed in GPa, viscous components in GPa s−1, and age in months.
The results for the hardness (H) and viscoplasticity (ηvp) are presented [Figs. 5(a) and 5(b)] respectively. Both, the plastic and viscoplastic properties increase during the whole lifespan. Statistically significant differences (P < 0.001) are highlighted for almost all age-groups.
The prediction equations which describe the plastic and viscoplastic properties are:
 $$H = 1.10\,^*\left( {1 - \exp ^{\left( { - 0.87 - 0.19\,^*{\rm{age}}} \right)} } \right)\quad R^2 = 0.94$$
 $${\rm{\eta }}_{{\rm{vp}}} = 391.22\,^*\left( {1 - \exp ^{\left( { - 0.86 - 0.21\,^*{\rm{age}}} \right)} } \right)\quad R^2 = 0.93$$
Hardness is expressed in GPa, viscoplasticity in GPa s−1, and age in months.
Then, from the mechanical properties E elast, E ve, and ηve assessed by the material mechanical model, the variation of the apparent elastic modulus in function of the strain rate can be computed.
The apparent elastic modulus E app for each age and for a given strain rate (0, 0.05, and ∞ s−1) are shown (Fig. 6). The values of E app are also summarized in Table III. The values have statistically significant differences (P < 0.001) between 1 and 4 months old. After this age, the mechanical values tend to remain constant until senescence and they do not show significant variations.
Apparent elastic modulus as a function of age and strain rate: From top to bottom strain rate
 $\dot \varepsilon$
= ∞ 0.05 s−1 and 0. DSCF test shows that variation is statistically significant from 1 to 4 months old (P < 0.001).

Values of the apparent elastic modulus of the rat femoral cortical bone as a function of the strain rate and the age of the samples.
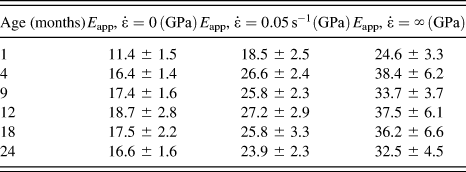
Mean ± standard deviation (SD).
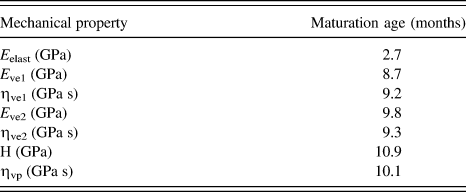
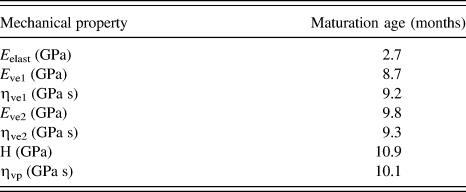
Finally, from the prediction equations [Eqs. (12)–(18)] the maturation age can be computed. The results are summarized in Table IV.
Maturation age of different mechanical properties for male rats RJHan:WI Wistar computed at the 95% of the estimated asymptote.
IV. DISCUSSION
This study demonstrates that the time-dependent mechanical behavior of bone could be described by an elastic–viscoelastic–plastic–viscoplastic model. The results show that mechanical properties assessed by nanoindentation vary with age. These variations are due to the change in the tissue composition, i.e., ratio between mineral and collagen content as evidenced in previous studies. Reference Iida and Fukuda11,Reference Vanleene, Rey and Ho Ba Tho13–Reference Burket, Gourion-Arsiquaud, Havill, Baker, Boskey and van der Meulen17
The values of the apparent elastic modulus and hardness of cortical bone are compared with those reported in the literature (Table V). Differences in the reported values could be due to factors like the animal model tested (different structural compositions of bones); Reference Liebschner38 the length of the lifespan investigated (sometimes only the growth period was used) Reference Donnelly, Boskey, Baker and Van der Meulen16 and the samples physiological conditions: dry or wet specimens. Rho et al. Reference Rho and Pharr39 reported that hardness and elastic modulus as measured by nanoindentation technique depend on whether the bone is wet or dry. In addition, in dry conditions the elastic modulus increases between 9.7 to 15.4% and hardness from 12.2 to 17.6%. Furthermore, the analyses of the nanoindentation data were performed with different mechanical models (Oliver and Pharr and viscoelastic–plastic models).
Mean values reported using nanoindentation for the reduced modulus and hardness in different animal models.

In this study, it was found that elastic modulus E elast increases by 50% between 1 and 4 months. The values remain constant between 4 and 12 months old with a light decrease between 12 and 24 months old but it remains statistically nonsignificant (Fig. 3). Previous studies Reference Vanleene, Rey and Ho Ba Tho13,Reference Hodgskinson and Currey40 suggest that variation of the elastic response at the macroscale can be related to structural component as the microporosity and density. In rat cortical bone Vanleene et al. Reference Vanleene, Rey and Ho Ba Tho13 found that cross-sectional area passes from a structure with a high porosity during 1–4 months old to a more mature lamellar shell during 4–12 months old. Then, microporosity increases between 12 and 24 months old but variation was not statistically significant. This behavior is similar to our results. It suggests that microporosity affects the elastic response of bone both at the macro- and microscale.
Another important observation of this work is that time-dependent mechanical properties vary with age from growth to senescence (Table II). In addition, the mechanical model used in the present study differentiates the viscoelastic and the viscoplastic response of bone.
The viscoelastic properties E ve and ηve increase from 1 to 9 months old. During this period, the values increase 80% for the elastic components and 60% for the viscous components. Then, the values remain constant until senescence. This variation could be explained by an increase of the density and the percentage of the carbonate weight (CO3W%) and a diminution of protein weight between 1 and 9 months old as reported by Vanleene et al. Reference Vanleene, Rey and Ho Ba Tho13
Concerning the viscoelasticity, similar behavior but over a different range of values was reported by Isaksson et al. (2010a). Reference Donnelly, Boskey, Baker and Van der Meulen16 These differences could be explained by the different species from which the bone came (rabbit and rat bones) and the mechanical model used to assess the viscoelastic response. In fact, Isaksson et al. (2010a) Reference Donnelly, Boskey, Baker and Van der Meulen16 used a Burger model and in the present study a two Kelvin–Voigt coupled with a dashpot model was used to describe the time-dependent response.
The viscoelastic response of bone may be related to layered water located between the crystal interfaces of the extrafibrillar mineral of bone as suggested by Eberhardsteiner et al. Reference Eberhardsteiner, Hellmich and Scheiner41
The hardness and the viscoplasticity increase during all lifespan. These properties increase 33% during the period between 1 and 4 months old and about 20% until senescence (P < 0.001). This increase can be quantified by the prediction equations. The maturation age computed for H and ηvp are almost identical and the ratio of ηVP/H is constant (360 ± 10 s). This behavior suggests that plasticity and viscoplasticity are intrinsically linked. Because the value of the viscoplasticity is much higher than the hardness, it is possible to suggest that the apparent hardness is only slightly affected by the strain rate. It must be noted that during senescence the values of H and ηvp continue to increase. This may be a process of hardening in the cortical shell of bone.
The apparent elastic modulus increases with the strain rate. The values increase by a factor of two when the strain rate rises from 0 to ∞. It can be noted, that nanoindentation experiments used classical strain rate of 0.05 s−1. The apparent elastic modulus obtained with this strain rate is around the average between the extreme values (0 and ∞ strain rate). The results are in agreement with previous studies reported by Fan and Rho Reference Fan and Rho23 and Vanleene et al. Reference Vanleene, Mazeran and Ho Ba Tho24 They showed that the increase of the strain rate affects the mechanical response of bone. Our results suggest that this parameter should be considered in the analyses of nanoindentation data as mentioned in previous study. Reference Mazeran, Beyaoui, Bigerelle and Guigon32 Consequently our protocol allowed us to highlight the different maturation ages for the different mechanical properties for male Wistar rats. In fact, the maturation age is approximately 3 months old for the elastic properties, 9 months old for the viscoelastic, and 11 months old for the plastic and viscoplastic properties.
To summarize, in this study, time-dependent mechanical properties were assessed in rat femoral cortical bones from growth to senescence. The results demonstrate that at the tissue level the mechanical properties varied with age. Elastic response increases from 1 to 4 months, the viscoelastic response from 1 to 9 months old and plastic and viscoplastic response over the whole of the period covered by our experiments. The apparent elastic modulus increases with an increase of the strain rate. Variations of the mechanical properties are found to be significant during the growth period of the rats. Using the data reported by Vanleene et al., Reference Vanleene, Rey and Ho Ba Tho13 the time-dependent mechanical response seems to be strongly related to microporosity and the tissue composition (mineral content and protein weight). However, quantitative relationships should be investigated between time-dependent mechanical properties and the morphological and physical–chemical properties to highlight clearer interpretations.
V. CONCLUSION
The present study shows that the time-dependent mechanical properties of cortical bone in lifespan model vary from growth to senescence. Our results suggest that different physical–chemical and structural processes occur at different ages of the lifespan of the rat. These material and structural changes are reflecting bone modeling and remodeling activities in all lifespan. Furthermore, the quantification of the variation of the mechanical properties from growth to senescence is crucial to improve our understanding about the process of bone maturation and bone remodeling. Under any circumstances, the extrapolation of the mechanical response of bone in animal models to humans should be handled carefully.
ACKNOWLEDGMENTS
This study was supported by the French National Scientific Research Center “Centre National de la Recherche Scientifique” (CNRS) and the Collegium-CNRS-UTC scholarship for the multidisciplinary research. The support of the European Fonds for the Development of the Regions (FEDER) and the Picardie Region. The authors thank Dr. T.T. Dao for assistance with the statistical analyses.