Too often, services fail poor people – in access, in quantity, in quality. But the fact that there are strong examples where services do work means governments and citizens can do better. How? By putting poor people at the center of service provision: by enabling them to monitor and discipline service providers, by amplifying their voice in policymaking, and by strengthening the incentives for providers to serve the poor.
5.1 Introduction
This chapter asks about the political conditions and governance structures that facilitate or hinder the translation of social program expenditures into public service delivery that helps the poor. We seek to contribute to a growing literature on public goods provision in developing countries. The story of Francisca told in the introduction to this book illustrates how basic public services can make a critical difference to improve health and prevent premature death. Without access to services like sanitation and health, Francisca’s children were very vulnerable: six out of thirteen died of preventable and curable health ailments. This story is hardly unique. Dehydration caused by diarrhea is the second greatest killer of children in developing countries. The World Health Organization (WHO) and the United Nations Fund for Children (UNICEF) calculate that in 2015 there will be 2.4 billion people without basic sanitation, and children will continue to pay the price in disease, malnutrition, and death. Poor sanitation has negative implications for education. Stomach-related illnesses not only prevent children from attending school regularly, but also have a negative impact on their cognitive skills.
By all accounts, life for the poor in Mexico has witnessed significant improvement with the expansion of public services. In 1990 the average municipal-level household coverage of water and sanitation was 65 and 35 percent, respectively; by 2000 coverage had increased to 72 and 50 percent. Such advances notwithstanding, a large proportion of the extreme poor still live without basic sanitation and other public services. In the state of Guerrero, for example, in 2010 one-fourth of the population lived without sewerage and 38 percent had no access to drinking water. The coverage in Chiapas was better, but still one-sixth had no sanitation system and one-fifth were not supplied with potable water. Similar averages could be found in Veracruz, San Luis Potosí, Puebla, and Oaxaca. And even within these states, inequalities are glaring. In rural villages, only a few households enjoy running water and proper sanitation, while in richer towns and cities the overwhelming majority is covered. High rates of infant mortality, as we discuss in the following chapter, are associated with the lack of access to basic services.
What accounts for variations in public service access and delivery? The failure of public service provision in developing countries can be attributed to both supply- and demand-side problems. Corrupt political institutions or unaccountable governments can be blamed for poor provision of services, while badly informed, distrustful, or ethnically divided citizens may generate free-riding and coordination problems as well as insufficient demand for public goods.
In this chapter we focus on supply, asking how the governance of social programs for public good provision and electoral accountability affect the delivery of collective benefits and services. The Mexican constitution grants the municipality responsibility for a wide range of public infrastructure investments, including roads, street pavement, sewers, running water, public markets and lighting, granaries, slaughterhouses, parks, garbage collection and public restrooms. Potable water, sewage systems, and electricity grids make up the bulk of municipal public goods spending. Although municipalities collect some taxes and can spend own revenues on social infrastructure projects, the overwhelming majority of these projects depend upon federal transfers to be funded.
Infrastructure projects can suffer from significant leakage. For example, successful projects sometimes benefit nontargeted populations; unsuccessful projects are often the result of rent-seeking or corruption on the part of politicians and service providers. Our goal is to identify which of the major social infrastructure programs, Pronasol and FISM, had fewer leakages, as reflected in their differential effect in expanding the provision of public services. These programs were characterized by radically different modes of governance: Pronasol was a centralized program administered from the president’s office while FISM is a decentralized program administered by municipal authorities; Pronasol was characterized by a high degree of governmental discretion in the targeting of programs and projects, while FISM targets funds to municipalities according to nondiscretionary formulas; Pronasol was predominantly a clientelistic program operated from the center to satisfy the PRI’s electoral clienteles and extensive patronage networks, while FISM, in sharp contrast, redistributes federal monies to municipalities on the basis of need rather than partisan interest. The governance of FISM thus works to restrain the manipulation of resource distribution among municipalities, although it does allow local governments considerable discretion to decide resource allocation within their jurisdictions.
This chapter also assesses the extent to which municipal variation in electoral accountability shapes public service delivery. A crucial aspect of accountability stems from voters’ capacity to sanction poor government performance (Ferejohn, Reference Ferejohn1986). Given the constitutional rule in Mexico proscribing reelection at all levels of government, the electoral accountability of municipal governments was necessarily limited.Footnote 1 With short time horizons, it could be argued that the temptation has been strong for mayors to behave as “roving bandits” (Olson, 2002), plundering as much as possible while in office.
The ban on reelection defangs the vote, since citizens cannot reward or punish mayors directly for their performance in office. But the vote retains some sanctioning power when applied to the political parties sponsoring mayoral candidates. Political incentives to serve voters largely hinge upon top-down, intraparty mechanisms available to discipline-elected officials. If parties promote local officials and cadres regardless of their records, accountability will be seriously jeopardized. However, electoral accountability without reelection might still be possible, albeit imperfect, if political parties choose to reward with nominations to higher office competent local elected officials with good reputations and performance (Langston, Reference Langston2011).
Our expectation is that, despite the lack of reelection, higher levels of political competition at the municipal level will increase a municipal government’s imperative to improve public service delivery. In monopolistic and hegemonic electoral markets there should be inadequate provision of collective benefits. As Chapters 3 and 4 discussed, voters in monopolistic places were almost condemned to support the PRI, even when it failed to deliver collective benefits. The problem is one of coordination: since each individual voter acting alone cannot defeat the ruling party; individuals are better off consenting to the system, no matter how corrupt or incompetent, so as to continue to have access to the party’s spoils system or the mere expectation to receive some future benefits. Voters in hegemonic localities had more leverage than voters in monopolistic places, but as we demonstrated in Chapters 3 and 4, the PRI preferred to target particularistic transfers to these localities so as to prevent its loyal base from eroding.
Incentives are likely to be different where there is electoral competition and partisan alternation in power is realistically possible, or where it has already occurred. In these settings, parties must pay closer attention to voters’ interests to be able to win future elections. To evaluate these propositions with empirical data, we measure local “electoral democracy” in several ways. Following Przeworski et al. (Reference Przeworski, Alvarez, Cheibub and Limongi2000), municipalities are classified as democratic where partisan alternation in power in office has taken place. We also create an index that measures a variety of factors normally associated with electoral democracy, including levels of electoral competitiveness and margin of victory. In addition, we analyze the effect of the cumulative number of years since a municipality first experienced partisan alternation.
Correcting for potential endogeneity between spending, electoral democracy, and coverage of public goods (as well as potential sources of unobserved heterogeneity),Footnote 2 our findings show that despite massive investments, the discretionary and centralized funds from Pronasol had negligible effects in improving the poor’s access to basic public services. In contrast, changes in the provision of potable water, electricity, and sewerage in municipal jurisdictions responded strongly to the decentralized and formula-based appropriations through FISM. Further, our results demonstrate that electoral democracy has a strong impact on improvements in public goods, propping a fairly optimistic view of the value of local electoral competition for the poor’s welfare in Mexico. The results are robust to various specifications of the statistical model. We estimate these effects of social programs and local democracy while controlling for the confounding impacts of municipal heterogeneity as captured by shifts in social participation, demography, and economic development.
In contrasting the effects of antipoverty programs and of local democracy on public service delivery, this chapter systematically evaluates the effectiveness of different governance modes for reaching the poor. Together with the next chapter, the discussion provides a clear measure of the leakages entailed in delivering collective benefits primarily through a party’s patronage networks relative to less politicized modes of resource distribution. In a nutshell, this chapter and the next provide measures of the scant welfare effects of discretionary antipoverty programs. Political linkages nurtured through discretionary social policy constitute a major barrier to accountability in governance, hindering effective poverty reduction.
The rest of this chapter is organized as follows. The next section provides an overview of the main theoretical hypotheses advanced in the comparative literature to explain variations in the provision of local public goods and services. We draw from that literature to justify the control variables we use in the estimation. The third section discusses the empirical strategy used to assess the policy effectiveness of funding for local public goods provision. We create two types of instruments for the identification of expenditure effects: one using geographic variables, and the other taking advantage of the mismatch between federal and state formulas in the allocation of social infrastructure funds. We follow with a discussion of our empirical results.
5.2 Heterogeneity, State Capacity, and Democratic Accountability
Well-being hinges not just on family income, but also on access to basic public goods and services. Although public goods can sometimes be privately provided, in general the provision of facilities such as potable water, sewage systems, electricity, schools, and health clinics devolves upon government. What explains differences in the provision of local public goods?
The literature offers four primary explanations for the differential provision of public goods. First, more ethnically homogenous communities seem more capable of providing public goods. Greater social heterogeneity, as measured, for example, through an index of ethnolinguistic fractionalization (ELF), makes it harder for communities to provide public goods (Alesina et al., Reference Alesina, Baqir and Easterly1999). This shortcoming is attributed to the idea that collective action when ethnic groups distrust outsiders and ethnic fragmentation breeds conflict among groups.Footnote 3
Studies linking ethnic diversity to public goods provision generally adopt a statistical approach. The association between polarization, as measured by ELF indexes, and failures to provide local public goods, as measured primarily by public expenditure patterns, seems to be a robust finding. However, there is considerable disagreement in the literature regarding the specific mechanisms through which heterogeneity influences public goods provision. It is possible that there is substitution among public goods, in the sense that some places might get less of certain types of goods, but more of others (Banerjee and Somanathan, 2001). Possibly, ethnically heterogeneous societies have a different taste profile for public goods than homogeneous ones, so that the result is driven by preferences, rather than polarization and conflict (Banerjee and Somanathan, Reference Banerjee and Somanathan2007; Banerjee, Reference Banerjee and Bas2004). The literature fails to specify how ethnic differences are reflected in bureaucratic structures and the political system (Posner, Reference Posner2005), arenas where the provision of public goods is decided.Footnote 4
Nonetheless, this literature suggests that a key determinant of success in local public goods provision is the capacity of communities to work together toward a common goal. In the Mexican context, religious divisions have emerged very strongly during the past decades, becoming an important source of community tensions, particularly in the South, and linguistic differences remain prominent, particularly in areas with a strong presence of indigenous communities.
Second, states that in some measurable way are more “capable” might be better able to provide public goods (Kohli, Reference Kohli2001). Failures in the provision of public goods reflect underlying problems arising from weak states that are incapable of taxing, running a bureaucracy or fulfilling basic public functions. Although there are variations in the administrative capacities of bureaucracies and service providers, state capacity tends to be difficult to measure. Very often states are defined as incapable precisely because they do not provide public goods and services. However, a well-documented example of the case of Ceará in Brazil has shown that it is possible to create an autonomous bureaucracy that can provide public goods effectively even within weak states (Tendler, Reference Tendler1997).Footnote 5 It is usually very hard to find a variable to measure state capacity that is not confounded with the general level of wealth or development. Nevertheless, it is important to acknowledge that public service provision might be better or worse due to differences in bureaucratic performance. In the Mexican context, there is wide variation in the administrative apparatus of municipal governments. Around half of the municipalities can be thought of as lacking state capacity due to their small size, precarious public finances, and high poverty levels (Cabrero, Reference Cabrero1998).
Third, while some cross-country studies show that democracy has a positive effect on the provision of public goods such as education and health (Stasavage, 2005; Besley and Kudamatsu, 2006; Baum and Lake, Reference Baum and Lake2003), others find either no effect in developing countries (Boix, Reference Boix2003) or no significant effect of regime types at all (Ross, Reference Ross2006). In a fascinating study on public service provision in an authoritarian regime, Tsai (Reference Tsai2007) finds that even when formal mechanisms of electoral accountability are not present, the existence of village solidarity groups in some villages in China made local officials more responsive to their communities, and also more likely to have better local public goods provision than villages without them. The uneven process of local democratization in Mexico provides us an opportunity to test regime differences from a subnational perspective.
Fourth, a growing set of studies focus on moral hazard and electoral control, trying to identify the conditions under which politicians’ interests align with voters. The general conclusion emerging from the literature is that electoral competition is not sufficient for good governance. We discuss this last strand of literature in greater detail, given its relevance for our empirical results. Some papers study how improving information among voters works at reducing moral hazard and elite capture, which in turn improves the provision of public services (Khemani and Keefer, Reference Keefer and Khemani2014). Policymakers have increasingly paid more attention to corruption as an explanation for the difficulties governments face in providing public goods and services.Footnote 6 In a particularly poignant example, Reinikka and Svensson (Reference Reinikka and Svensson2004) measured an astronomical leakage of 87 percent in a program in Uganda meant to provide grants to schools for nonwage expenditures. That leakage was successfully reduced through greater citizen involvement and information regarding the allocation of funds to local schools.Footnote 7 Olken (Reference Olken2006) similarly found that the leakage in a poverty-relief program delivering rice in Indonesia was large enough to offset the welfare gains from having the program in place at all. In a fascinating study, Ferraz and Finan (Reference Ferraz and Finan2008) show that providing information to voters about corruption makes them more likely to sanction bad politicians.Footnote 8
Other studies focus on participatory democracy and citizen engagement in collective decision making. In an important contribution to this literature, Olken (2010) shows that direct participation in political decision making can substantially increase satisfaction and legitimacy.Footnote 9 The link between electoral competition and public service delivery has also received some attention. Chhibber and Nooruddin (Reference Chhibber and Nooruddin2004) found that Indian states where electoral competition is stiff (the incumbent faces a strong contest from a single challenger) are more likely to increase expenditure on public goods. They also find that public goods provision in multiparty competition decreases, because in fragmented electorates politicians do not need to build large coalitions.Footnote 10
In the case of Mexico, Hiskey (Reference Hiskey2003) argues that in more competitive electoral environments, measured through the effective number of parties, public service provision is sensitive to public spending. In contrast, Cleary (Reference Cleary2004) does not find an effect of electoral configuration on public service provision, although he does show that variables related to political participation, such as literacy and turnout, improve public service delivery.Footnote 11 Neither of these studies is too conclusive, however, because they both fail to address a problem of endogeneity; namely, that while changes in public good coverage can be the product of electoral competitiveness, competitiveness, in turn, is likely shaped by public goods.Footnote 12
Other studies focus on the effects of particular political institutions on public service delivery. Elective public offices reserved for women leaders in India make local governments more representative by increasing the distribution of public goods preferred by women (Chattopadhyay and Duflo, Reference Chattopadhyay and Duflo2001).Footnote 13 In a similar vein, Pande (2000) has shown that better representation of the scheduled caste in the Indian states improved the provision of education and land reform, which are policies that the poor would surely favor.Footnote 14 In poor indigenous communities in Mexico, traditional participatory institutions, referred to as usos y costumbres, distribute services in a more egalitarian manner than local representative institutions, where political parties tend to distribute services along clientelistic lines (Diaz-Cayeros et al., 2014).
To a large extent these studies get leverage from analyzing the distribution of funds across levels of government. The literature on decentralization is often premised on the notion that local governments are better at providing public services than centralized bureaucracies. In a study of Bolivian municipalities, for example, Faguet (Reference Faguet2004) shows that decentralization made public expenditure decisions more effective for the provision of public goods. While decentralized public goods provision is often successful, the initial optimism regarding the virtues of decentralization has been tempered by a greater awareness that a crucial factor that determines whether a local government is capable of providing public goods is the accountability of local politicians to citizens (World Bank, 2004a; Bardhan, Reference Bardhan and Mookherjee2005).
To sum up, the general thrust of many of these empirical contributions has been to suggest the need to explore failures of electoral accountability and ways to enhance good governance. Our approach in this chapter and the following builds on this work. We explore how clientelism distorts the delivery of collective benefits, including basic services and health. There is consensus in the scholarly literature that clientelism corrupts democracy and electoral accountability (Stokes, Reference Stokes2005; Kitschelt and Wilkinson, Reference Kitschelt and Wilkinson2007; Kitschelt et al., Reference Kitschelt2011). Yet to our knowledge the negative effects of clientelism on government delivery of public goods and voters’ welfare have not been systematically measured.
5.3 Modeling Public Goods Provision
In the Mexican context, access to safe drinking water, electricity, and sewerage, among other local public goods, depends upon provision by municipal governments since the mid-1990s. While education and health facilities are also crucial inputs that impact well-being, their provision in Mexico has been decided from the center. Even after the decentralization of education in 1993 and health facilities a few years later, most of the financing for those two public goods remains federal (Courchene and Diaz-Cayeros, Reference Courchene, Diaz-Cayeros, Giugale and Webb2000), and the decisions regarding the location and support of schools and health clinics are primarily made by state and federal, not municipal, governments. In the empirical test that follows, we limit the analysis to municipal services, not including education and health provision.
Public spending in the past must account for most of the existing provision of local public goods, while current spending should impact that level only marginally, by investing in the maintenance and expansion of existing public assets. If we do not have data available measuring previous spending and the stock of past provision efforts, using as a dependent variable the level of public goods provision observed at a given point in time may involve a serious omitted variable bias. We may falsely attribute very large effects to current spending, only because of its inertial correlation with past expenditures. To solve this problem, the strategy suggested by Banerjee (Reference Banerjee and Bas2004) is to measure public service provision as a first difference. That way we avoid wrongly attributing levels of provision from the past to current spending.Footnote 15
Furthermore, independent variables should also be measured as first differences. That is, changes in public goods provision should be affected by changes in municipal conditions, including shifting expenditure strategies. The advantage of measuring independent variables in this way is that even if some unobserved variables are omitted in the estimation, which may account for some of the cross-sectional variance, their omission does not bias the estimation, provided that these variables do not change over time.
The dependent variable in the analysis is the change in the coverage of public provision of drinking water, electricity, and sanitation services in Mexican municipalities according to census data.Footnote 16 Rather than estimating determinants for each service, we averaged the supply of the three public goods to generate a simple index.Footnote 17 The index is expressed as the log-odds ratio of the average coverage for the years 1990 and 2000. We chose not to use the mid-census estimations (conteos) due to issues of data reliability.Footnote 18 The dependent variable hence takes the form of this first difference:
Where pt = ∑ri/3 and ri is the share of municipal households covered by a service i, namely, water, electricity, and sewerage in each census decade. We transformed the raw percentages into log-odds ratios because an OLS estimation using percentages yields predicted values that are implausible, falling outside the [0,1] interval (see Tucker, Reference Tucker2006). The transformation to log-odds ratio is also preferable because it fits more closely a normal distribution, and it is more sensitive to differences in the low and high ends of the variable’s range (Cleary, Reference Cleary2004). However, a general and well-known problem with a logistic formulation is aggregation. If there is heterogeneity in public service delivery in the localities that comprise the municipality, the model will be correct for the municipal level, but not for lower levels of aggregation (Mookherjee et al., Reference Mukherjee, White and Wuyts1998).Footnote 19
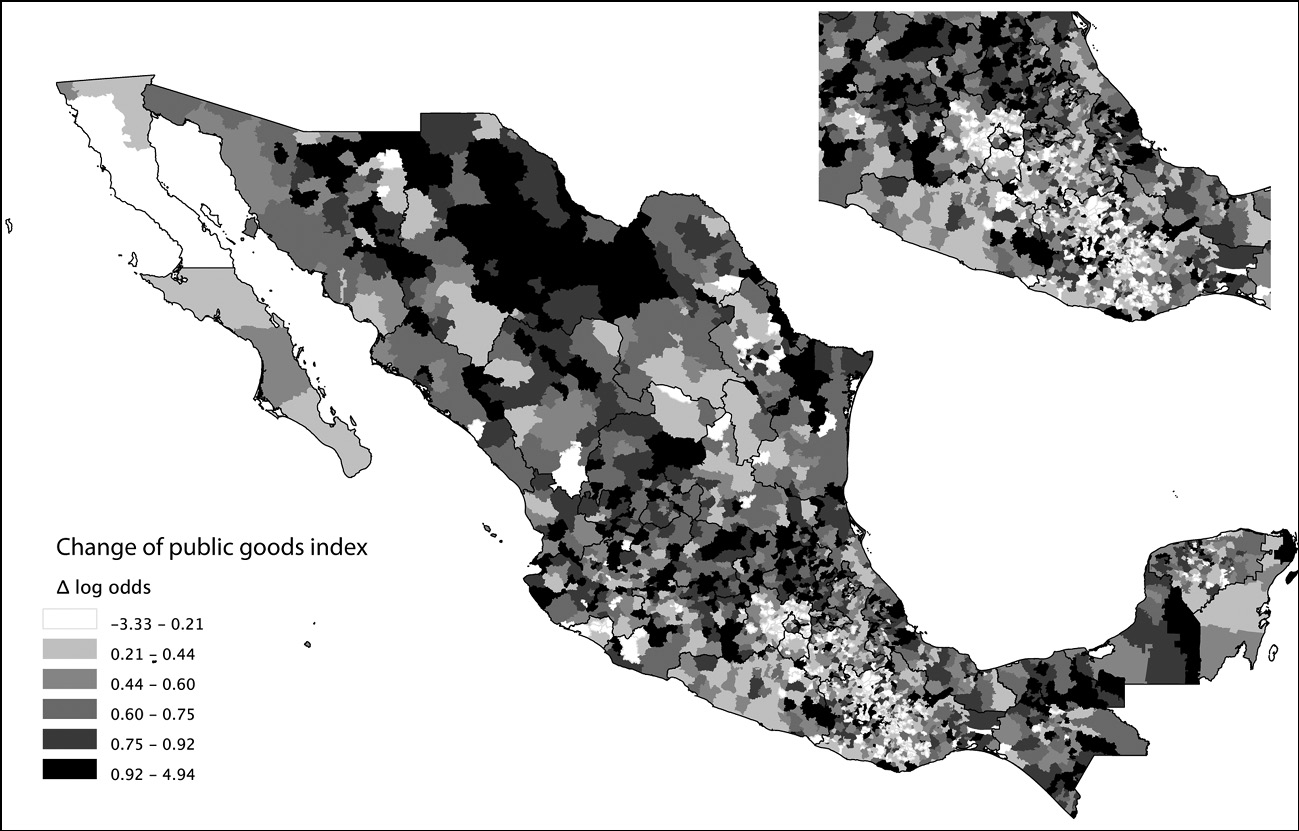
The public goods index coverage of the average municipality in Mexico was 58.9 percent in 1990, increasing to almost 69.7 percent by 2000. The average change in provision for that decade was 10.8 percent. Figure 5.1 maps the change in the index across Mexican municipalities. There were large differences in the provision of public services between poor and rich municipalities.Footnote 20 For example, in 1990 the first decile of the distribution of municipalities had an average coverage of 30.0 percent, while the top decile’s average was almost three times as great, at 85.1 percent.
Change in public good coverage, 1990–2000.
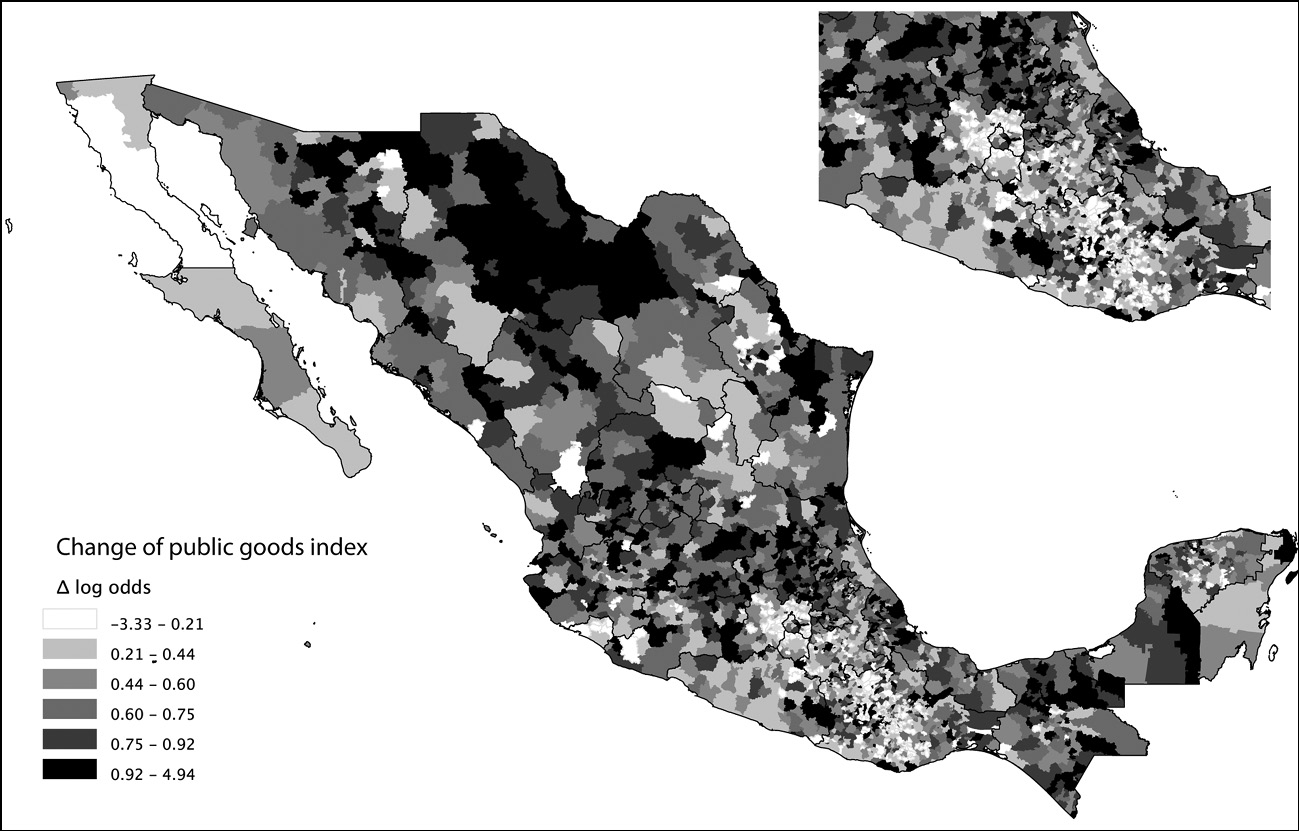
By 2010, the poorest municipalities had increased coverage to 44.5 percent and the richest municipalities to 91.1 percent. This means that the gap between rich and poor municipalities has somewhat narrowed. Improvements in local public goods progressed more rapidly among the lower half of the distribution. However, in 2000 the median municipality failed to provide these essential public goods to about one-fourth of its inhabitants, while the poorest municipalities still left almost half of their inhabitants without basic services.
Independent Variables
Studies by Cleary (Reference Cleary2002 and Reference Cleary2004) and Hiskey (Reference Hiskey2003) provide important insights into variations in public service delivery in Mexico. However, both studies suffer from a methodological shortcoming in that they fail to address endogeneity concerns, which have been central to the work on impact evaluation in development economics (Rawlings and Schady, Reference Rawlings and Schady2002). The problems at hand are twofold: first, budget appropriations are probably endogenous to investment outcomes. Funding allocations for social infrastructure projects for water, sanitation, and electricity are not independent from the perceptions policymakers have of where they believe they can get a larger return on their investment. While we seek to understand how much a given service, say potable water, improved as a consequence of public investment, the decisions regarding the allocation of discretionary funds across municipalities are most certainly influenced by engineering assessments of the conditions of the existing social infrastructure around the country and the likely impact policymakers and politicians believe spending in a particular place will have on the delivery of those social services. If this problem is not addressed, the estimations of the effects of policies may be seriously biased.
The same is true for other public services, such as electricity and sanitation. For example, if a politician wants to claim credit for a large improvement in the coverage of electricity in the few years of his short term in office, he might arguably prefer to allocate funds to urban places that already have a relatively well-developed grid, so that a large number of dwellings can improve very quickly. Or politicians might allocate spending in sanitation where it is more urgently needed, for instance, in some regions where the lack of a proper sewage system could produce a cholera outbreak or some other public health crisis. Policymakers in this case might actually be able to allocate resources with the highest priority to the places where no improvement has been observed in the past. These examples suggest that the selection of where to allocate electricity and sewerage projects might be determined precisely by the dependent variable we want to explain. The challenge is to find exogenous variation in expenditure or at least to isolate its exogenous component.
Municipal electoral democracy also exhibits identification challenges. The omitted correlates that account for levels of democracy (including higher electoral competitiveness, the presence of more political parties, and partisan alternation in office) are also likely to be related to changes in public goods provision. Results in the final chapter suggest, in fact, that changes in public goods provision influence electoral behavior. Thus, variables measuring levels of democracy and competition may well be at least partially endogenous, a consequence of the success or failure of earlier governments in delivering services.
To address these concerns, the literature on impact evaluations has become increasingly demanding about the use of instrumental variable approaches in order to obtain solid inferences concerning the impact of public investments. Zhurakvskaya (Reference Zhurakvskaya2000), for example, uses the Soviet legacy of industrial output over agricultural production as an instrument of spending, in order to assess its impact on public goods provision in Russia. Banerjee and Iyer (Reference Banerjee and Iyer2005) take advantage of the different political organizations and land tenure arrangements among Indian princely states during the colonial era in order to assess the effect of land distribution on economic performance. Paxson and Schady (Reference Paxson and Schady2002) use President Fujimori’s vote share as an instrument to predict Foncodes resource allocations in Peru. In the following section, we explain the strategy employed to instrument the funding of Pronasol and FISM as well as the levels of democracy.
Instrumenting Pronasol Transfers
Public good expenditures in Pronasol were more concentrated in relatively developed municipalities. Despite widespread poverty in the South of the country, a visual inspection of the map in Figure 2.3 shows that few of those funds were targeted to those areas. Pronasol spending is measured as the log of average per capita Pronasol public goods expenditure, measured in real terms (1994 pesos).Footnote 21 If this spending had an effect on public service provision this variable should be positive.
To instrument Pronasol‘s expenditures in public goods we employ alpha, which is our measure of PRI core support, as explained in Chapter 4. The earlier chapter demonstrated that alpha shaped expenditures within Pronasol and in this sense satisfies the first requirement for a good instrument – namely, being a strong predictor of our endogenous independent variable. The exclusion restriction – that the instrument be uncorrelated with the dependent variable – is also satisfied. Recall that alpha is calculated using data from 1970 until 1988 and is hence unaffected by changes in public goods coverage between 1990 and 2000. The share of core voters in the period 1970–1988 in a given municipality cannot be causally related to changes in public goods coverage, except through the way it shapes expenditures.
We also include an additional instrument for public goods expenditures, the Euclidean distance of each municipality from the railroad network. This geographic variable is exogenous to changes in public goods coverage, yet a remarkably good predictor of Pronasol expenditures. Railroads in Mexico were built fundamentally during the late nineteenth and early twentieth centuries. By 1990 no investment in railroad tracks had been made for half a century. Proximity to railroads does not directly influence improvements in public goods, because railroads have become mostly irrelevant for local market activity or passenger transportation (which now pass through the road network). This means that a municipality’s proximity to a railroad is orthogonal to improvements in public infrastructure.Footnote 22
Although distance to railroads is uncorrelated to improvements in public goods provision, it is a good predictor of Pronasol‘s expenditures on public goods. This is because the public goods projects that Pronasol financed were disproportionately assigned to urban and semiurban localities, which happen to be closer to railroad tracks.Footnote 23 Railroads were originally built to connect the main cities and mining towns with ports on the coast and the US-Mexico border. Municipalities that were closer to the railroads were better integrated along trading routes and they developed into more urbanized places. These types of localities happened to also benefit from higher levels of public infrastructure expenditures within Pronasol.
Simulated Instrumental FISM Transfers
The second program we evaluate is FISM. The allocation of these funds was in principle determined by a federal formula, but the actual implementation of this program gave room for states to choose how they would apply the formula. FISM allocations raise a problem of identification because unobserved variables may have caused some states to distribute funds among their municipalities according to desired impacts in public goods provision (precisely the variable we are trying to estimate). Fortunately, we can exploit some details regarding the implementation of the federal formula that generate exogenous variation in the funds municipalities receive, captured by the use of a simulated instrumental variable.
The federal formula for the allocation of FDSM created in 1997 was based on calculating gaps in public service provision and poverty, similar to a Foster-Greer-Thorbecke poverty index (Mogollón, 2012; Levy, Reference Levy1998). These gaps provided estimates of so-called deprivation densities (Masas Carenciales Estatales), which determined the amount of funds states would receive.
However, for the distribution from states to municipalities, governors could either use exactly the same federal formula, or choose a much simpler allocation formula based on similar variables (known as “formula 2”), and incorporating precisely the variables we use in our public goods coverage index (percentage of households with water, electricity, and access to sewerage) as well as the share of residents below the poverty line.Footnote 24 Nineteen states used the simpler formula, while twelve used the federal formula. Since the federal formula was calculated as a gap rather than just a headcount, it was better targeted to the poor.Footnote 25 Once the specific formula was chosen, governors had no discretion in the allocation of these funds to the municipalities. In addition to this choice of formula, during the first years of the FDSM/FISM, one-third of the funds were distributed to states in equal shares, regardless of their population size. State governments, in turn, were bound to distribute the total pool of state resources to their municipalities by their chosen formula.Footnote 26
Our simulated instrumental variable approach captures how much allocations deviated from the counterfactual allocation that would have prevailed had states strictly followed the federal formula, giving greater weight to poverty gaps in fund allocation, instead of the “simpler” formula that most states actually used, which was heavily driven by population and prior public service coverage.Footnote 27 Specifically, we regress INEGI indicators of the percentage of households without electricity and sewerage, the illiteracy rate, the poverty headcount of population earning less than one minimum wage and the inverse of the population in 1995,Footnote 28 on the per capita FDSM/FISM funds between 1996 and 2000 (in real terms).Footnote 29
The results run separately for each year are reported in Table 5.1. Our simulated instrumental variable is the residual of this estimation, measuring how much FISM allocations per municipality depart from an implicit formula.Footnote 30 The simulated instrument can be interpreted as credibly capturing the exogenous variation in appropriations generated by federal law, excluding the endogenous variation due to states’ own choices.
| (1) | (2) | (3) | (4) | |
|---|---|---|---|---|
| FDSM 1996 | FDSM 1997 | FISM 1998 | FISM 2000 | |
| Pronasol | 0.236 | 0.122 | 0.024 | 0.019 |
| (log) | (0.018)** | (0.014)** | (0.011)* | (0.011) |
| No Electricity | 0.414 | 0.448 | 0.840 | 0.833 |
| (0.067)** | (0.048)** | (0.041)** | (0.042)** | |
| No Sewerage | 0.298 | 0.491 | 0.867 | 0.866 |
| (0.061)** | (0.048)** | (0.045)** | (0.044)** | |
| Wage Poverty | 0.469 | 0.264 | 0.388 | 0.402 |
| (0.077)** | (0.061)** | (0.051)** | (0.052)** | |
| Illiteracy | 0.309 | 0.384 | 0.728 | 0.757 |
| (0.121)* | (0.081)** | (0.065)** | (0.066)** | |
| Population | –0.362 | –0.38 | –0.013 | –0.016 |
| (log) | (0.011)** | (0.010)** | (0.008) | (0.008)* |
| Constant | 5.654 | 6.685 | 3.773 | 4.451 |
| (0.189)** | (0.155)** | (0.130)** | (0.130)** | |
| State Fixed Effects | YES | YES | YES | YES |
| Observations | 2208 | 2208 | 2208 | 2208 |
| R-squared | 0.78 | 0.79 | 0.81 | 0.86 |
Note: Robust standard errors in parentheses.
* Significant at 5% level; ** significant at 1% level.
Just like the Pronasol expenditure variable, we expect FISM to have a positive sign, suggesting that when more money is spent, the percentage of households with access to basic public services will increase.
Democracy
To estimate the impact of electoral accountability on public service delivery, we rely on several alternative metrics of democratization. Our first measure focuses exclusively on the impact of partisan alternation in office (a dummy variable where 1 indicates that the PRI lost power in a given municipality in the period between 1990 and 2000, and 0 otherwise). The second measures electoral competitiveness, a dummy variable that takes the value of 1 for municipalities that are marginally won or lost by 10 percent or less of the vote, and 0 otherwise. Our third measure looks at the number of years since a municipality first experienced partisan alternation in office. This can be thought of as a measure of democratic consolidation. Finally, we use an index of “local democratic practice” that reflects the variance in political competition and political change across Mexican municipalities (see Chapter 2). The index ranges from 1 to 7, where 7 reflects highly competitive municipalities in both federal and local elections that have also experienced partisan alternation in office.Footnote 31 This index is akin to measures of democracy that attempt to capture graduation in democratic quality, such as the Freedom House or Polity indexes, rather than a sharp categorical distinction between regimes.
Since levels of democracy, alternation in political power and small margins of victory are likely to be endogenous, we also require an identification strategy. We instrument democracy relying on the alpha parameter, which measures PRI core support. There is compelling evidence that democracy was more likely to take root in Mexico where the PRI was less entrenched. But we believe areas of core support for the PRI were the consequence of deep-rooted historical processes (including organizational linkages forged between peasant and worker confederations in the aftermath of the Mexican Revolution), which are unlikely to be associated with the change in the provision of public goods in the 1990s, for reasons other than the influence core supporters had on the assignment of public expenditures.
We rely on two additional geographic instruments. First we use the (Euclidean) distance to railroad tracks mentioned earlier. Investments in railroads took place almost exclusively before the foundation of the PRI in 1929. A municipality’s proximity to a railroad determined its early chances of development, indicating whether a town was integrated into the main trading routes or stagnated in isolation. Municipalities that were connected to the railroads were thus better able to accumulate capital, tap information and cultural flows, and grow into larger towns. A municipality’s location with respect to railroads hence shaped its long-term economic and institutional development, including its urbanization and propensity to democratize.
In addition, we instrument democracy with the East-West gradient (longitude) of a municipality’s centroid. The geography of settlements in Mexico is not determined by the ease or difficulty with which their location facilitates public goods provision. A well-known North-South gradient of development persists in Mexico, wherein the areas of densely settled indigenous communities of Central and Southern Mexico are poorer than the rich towns and cities emerging from mining and cattle-raising activities in the North. But latitude is not a very plausible instrument for the effect of democracy on the changes in public good provision, because it is correlated with virtually every modernization indicator. A less acknowledged geographic feature in Mexico is that a longitude gradient of settlement patterns, in which the pre-Hispanic civilizations of the Toltec, the Maya, and particularly the Olmec, emerged from the southern Gulf of Mexico toward the central highlands, rather than towards the North or the West. Eastern settlements have a longer tradition of being subject to hierarchical social orders, while the West is characterized by more recent settlement in frontier spaces originally populated by nomadic groups.Footnote 32 As it turns out the longitude gradient is correlated with democratization, but is not a predictor of public good provision.
Sociodemographic and Fiscal Controls
As controls we use a set of independent variables that are consonant with the debates in the literature. First, we control for changes in literacy. This variable can be thought of as a control for political awareness and citizen demands for public services (Banerjee, 2002). It might also reflect overall levels of development. Cleary (Reference Cleary2004) argues that although literacy is correlated with development, it can measure some of the participatory elements of democracy. We include the change in illiteracy, measured as the difference in the percent of population over 15 that could not read and write between the 2000 and 1990 censuses, as an indicator of lack of local empowerment.
For measures of social polarization, religious competition is the most salient cleavage that drives conflict in Southern Mexico (Trejo, 2009 and Reference Trejo2012). The connection between religion and conflict is related to religious organizations’ active construction of social networks for pastoral purposes, spurred by the pressures of religious competition. Trejo shows that as a reaction to evangelical inroads in its dioceses, the Catholic Church in Chiapas became more attentive to the needs and demands of poor indigenous communities. This does not mean that religious affiliation became a source of violence or contention, but rather that conflicts between citizens and state structures might be more intense in places with more active religious competition. A gap within indigenous groups is less prevalent, since localities tend to be more homogeneous in the ethnic dimension than in the religious one. We have thus calculated a measure of religious fractionalization, which is an index of how divided religious beliefs are in a municipality. We calculate the index defined as F = 1 − ∑ pi2, where p is the share of each of the religious affiliations reported in the 1990 census (Protestantism, Catholicism, Judaism, other religions, and agnostic).Footnote 33
A second indicator of social cleavages we use is the share of “bilingual” and “indigenous population,” according to the 1990 census. The indigenous population variable is more inclusive, counting both bilingual and monolingual speakers of indigenous languages. While there is a very high correlation between being poor and Indian identity, the indigenous character of a community might not reflect divisiveness, but in fact improve the provision of public goods. This might be particularly true in places where social organization makes collective endeavors less subject to shirking and opportunism. For example, the most tightly knit communities in Oaxaca use the Tequio as a tax-like mechanism for the provision of public goods and services (Diaz-Cayeros et al., Reference Díaz-Cayeros, Magaloni and Ruiz-Euler2014).Footnote 34 Those municipalities often also use a system of rotation rather than party competition to choose their authorities. These traditional systems, called usos y costumbres have turned out to be a very effective form of governance.Footnote 35 Hence we do not expect a specific direction in the effect of this control variable.
We include a control for demographic change that might exert pressure on the existing physical infrastructure, measuring the rate of population change between 1990 and 2000 (“Population”). We expect the demographic variable to have a negative sign. We also include a measure of the changes in poverty rates. The measure is a “poverty headcount,” defined as the share of individuals earning less than twice the minimum wage according to the 2000 and 1990 censuses. This variable should control for the distribution of poverty in the municipality.
Finally, public expenditure through federal programs is complemented by municipal funds. Public works spending by municipalities constitutes the part of their budget they invest, as distinct from expenditures for debt service and general administration (mostly comprising the municipal payrolls). On average, municipalities during this period spent about half of their budgets on public works. These budgets were much smaller than the total Pronasol funds, and relatively similar to FDSM/FISM funds.Footnote 36 We include municipally allocated public works spending (Local Public Works Budget or lworks), measured as the logged average per capita allocation from 1989 to 2000.
Hence, the reduced form of our estimations has the following specification:
| Δ Public Good Index1990–2000 = | α1 Pronasol (IV) 1989–1994 + |
| α2 FISM (Simulated IV) 1996–2000 + | |
| β1 Local democracy (IV) 2000 + | |
| γ1 Δ Religious Fractionalization 1990–2000 + | |
| γ2 Δ Indigenous Population 1990–2000 + | |
| γ3 Δ Bilingual Population 1990–2000 + | |
| γ4 Δ Population 1990–2000 + | |
| γ5 Δ Poverty Headcount 1990–2000 + | |
| γ6 Δ Illiteracy 1990–2000 + | |
| γ7 Local Public Works Budget 1989–2000 + ε |
5.4 Results
We now proceed to discuss the main findings. The results of the instrumental variable regressions are presented in Table 5.2. The first column is a naive regression without instrumenting for the endogenous explanatory variables, namely, Pronasol and partisan alternation in municipal office. Both variables show positive and statistically significant effects. Our simulated instrumental variable for FISM and local public works budget also impacts the provision of public goods in the same manner. The last columns, instead, provide instruments for Pronasol and alternation of political power in office, estimating one variable at a time or simultaneously. The results of the last model can be summarized as follows: FISM retains its strong positive effects on improvements in public goods coverage, whereas Pronasol’s impact becomes statistically insignificant. In other words, discretionary pork-barreling fails to deliver welfare enhancing infrastructure to the community at large, while nondiscretionary projects accomplish that feat.
| 1 | 2 | 3 | 4 | 5 | 6 | |
|---|---|---|---|---|---|---|
| Pronasol | 0.05 | –0.19 | –0.093 | 0.08 | 0.105 | 0.131 |
| (2.69)*** | (1.84)* | (1.25) | (3.44)*** | (4.03)*** | (1.52) | |
| Alternation | 0.064 | 0.011 | 0.031 | 0.49 | 0.87 | 0.662 |
| (3.01)*** | (–0.36) | (–1.21) | (2.68)*** | (3.74)*** | (4.17)*** | |
| FISM | 0.432 | 0.481 | 0.46 | 0.409 | 0.387 | 0.387 |
| (1.95)** | (1.82)* | (1.87)* | (1.94)* | (1.95)* | (2.00)** | |
| Observations | 2399 | 2375 | 2375 | 2375 | 2388 | 2369 |
| Endogenous | None | Pronasol | Pronasol | Alt. Power | Alt. Power | Pronasol |
| Variable | Alt. Power | |||||
| Instruments | None | Alpha | Railroads | Alpha | Railroads | Railroads |
| Alpha | Longitude | Alpha | ||||
| Longitude |
Note: All models include a constant term and control variables in first differences: population growth, illiteracy, bilingualism, indigenous population, poverty, and religious fractionalization index changes. All models use robust standard errors. All expenditure variables are logged. Instruments pass the Sargan and Basmann tests of overidentification.
* Significant at the 10% level; ** significant at 5% level; *** significant at the 1% level.
t statistics in parentheses.
The second finding is that local democratization is a strong predictor of gains in public goods provision. In order to assess the robustness of this finding, Table 5.3 presents the same basic model using our alternative specifications of local electoral democracy. Once again, Pronasol and the variables measuring electoral democracy are instrumented simultaneously. The table shows that both the index of a minimalist definition of democracy as well as the number of years accumulated since the first turnover in partisan control of local government exhibit positive and statistically significant effects on public goods coverage.
| 1 | 2 | 3 | |
|---|---|---|---|
| Pronasol | 0.094 | –0.029 | 0.207 |
| (1.08) | (0.41) | (1.82)* | |
| Dem. Index | 0.111 | ||
| (2.72)*** | |||
| Margin < 10% | 0.237 | ||
| (1.27) | |||
| Alternation | 0.109 | ||
| (3.40)*** | |||
| FISM | 0.451 | 0.469 | 0.516 |
| (2.09)** | (1.97)** | (2.01)** | |
| Observations | 2332 | 2332 | 2369 |
| Endogenous | Pronasol | Pronasol | Pronasol |
| Variable | Dem. Index | Margin | Alt. power years |
| Instruments | railroads | railroads | railroads |
| alpha | alpha | Alpha | |
| longitude | longitude | longitude |
Note: All models include a constant term and control variables in first differences: population growth, illiteracy, bilingualism, indigenous population, poverty, and religious fractionalization index changes. All models use robust standard errors. All expenditure variables are logged. Instruments pass the Sargan and Basmann tests of overidentification.
* Significant at the 10% level; ** significant at 5% level; *** significant at the 1% level.
t statistics in parentheses.
Pronasol has no significant effects on the first two models, while FISM shows robust positive effects in all models. Overall, our results thus suggest that the decentralized and formula-based program, FISM, is robust in its impact upon municipal-level public service delivery. Local electoral democracy, by various definitions, also consistently drives our dependent variable. By contrast, the centralized/discretionary program, Pronasol, is clearly not robust in its meager effects.
The possibility that general results for these variables, including Pronasol, may hide distinct distributive effects within the total sample of municipalities, leads us to disaggregate the models. The challenges of providing basic public goods in highly marginalized municipalities are likely to be quite different from those facing more developed municipalities. The well-known thesis of the advantages of backwardness implies that poverty-stricken municipalities may exhibit faster improvements in public good coverage than rich municipalities.Footnote 37 Convergence might ensue because latecomers enjoy some advantages adopting technologies that may have become cheaper through time or expanding services that are already being provided elsewhere.Footnote 38 Furthermore, the administrative and political process through which poor municipalities improve public goods coverage is usually quite different from what obtains in richer municipalities. To explore the presence of this heterogeneity in our data, we perform quantile regressions.
This technique allows us to parse the range in the distribution of the dependent variable over which independent variables exert their influence. OLS remains the most efficient unbiased estimator when the conditional distribution is normal. But when there is strong heteroskedasticity and suspected nonlinear effects, the versatility of the quantile regression is that of allowing an estimation of effects not just at the mean, but at various quantiles of the full distribution of municipalities (q20, q40, q60, and q80). Instead of minimizing the sum of squared terms as in OLS, the technique finds the Least Absolute Deviations with respect to any cutoff point. The quantile regression is also more resistant to outliers. Deaton explains the advantage of quantile regressions:
Quantile regressions are not just useful for discovering heteroskedasticity. By calculating regressions for different quantiles, it is possible to explore the shape of the conditional distribution, something that is often of interest in its own right.
Although quantile regression provides a more complete picture than OLS regression, one should be careful in its interpretation. As noted by Angrist and Pischke (2009), one can learn about the characteristics of the distribution, but not necessarily about individuals. Although we may find that a certain treatment (say, democracy) may have a positive effect in the provision of public goods for the lowest quintile of the distribution, that does not mean that the poorest municipalities are necessarily better provided when they have democracy. The estimation only tells us that a regime with democracy yields improvements at that lower tail of the distribution. Quantile regression will allow us to estimate differential effects for our covariates in municipalities that exhibit large improvement (normally the poorest) and in municipalities that exhibit smaller improvements (which tend to be richer).
Tables 5.4 and 5.5 study the differential effect of the two antipoverty programs and two measures of democracy on public goods provision. To be consistent, our endogenous variables are instrumented as before.Footnote 39 The results of these models provide interesting insights into the distributive effects of the independent variables: FISM shows positive and strong effects on improvements in local public goods provision in all but the highest quantile. FISM’s impact increases for lower quantiles, suggesting that federal transfers for social infrastructure are better able to spur improvements in public goods provision at the lower end of the distribution. Strikingly, the opposite is true for Pronasol. The quantile regressions show that the discretionary poverty-relief program produced major improvements in public goods coverage only at the top end of the municipal universe. At the lowest end, it may well have contributed to a deterioration of public service delivery.
| q.2 | q.4 | q.6 | q.8 | |
|---|---|---|---|---|
| ^Alternation | –0.176 | –0.027 | 0.036 | 0.331 |
| (0.93) | (0.23) | (0.36) | (1.95)* | |
| ^Pronasol | –0.26 | –0.098 | 0.102 | 0.415 |
| (1.81) | (1.13) | (1.5) | (4.24)*** | |
| FISM | 1.136 | 1.046 | 0.686 | 0.461 |
| (5.36)*** | (5.23)*** | (2.28)** | –1.5 | |
| Observations | 2369 | 2369 | 2369 | 2369 |
Note: All models include a constant term and control variables in first differences: population growth, illiteracy, bilingualism, indigenous population, poverty, and religious fractionalization index changes. All models use robust standard errors. All expenditure variables are logged. Instruments pass the Sargan and Basmann tests of overidentification.
* Significant at 10%; ** significant at 5%; *** significant at 1%.
t statistics in parentheses.
| q.2 | q.4 | q.6 | q.8 | |
|---|---|---|---|---|
| ^Pronasol | –0.026 | 0.082 | 0.102 | 0.255 |
| (0.24) | (0.75) | (2.44)** | (3.31)*** | |
| ^Dem. Index | 0.118 | 0.105 | 0.259 | 0.823 |
| (2.67)*** | (1.69)* | (2.84)*** | (5.58)*** | |
| FISM | 1.235 | 1.007 | 0.661 | 0.472 |
| (5.67)*** | (5.08)*** | (2.78)*** | (1.43) | |
| Observations | 2369 | 2369 | 2369 | 2369 |
Note: We instrument for democracy and Pronasol with alpha, longitude, and distance to railroads. All models include a constant term and control variables in first differences: population growth, illiteracy, bilingualism, indigenous population, poverty, and religious fractionalization index changes. All models use robust standard errors. All expenditure variables are logged. Instruments pass the Sargan and Basmann tests of overidentification.
* Significant at 10%; ** significant at 5%; *** significant at 1%.
FISM performs much better than the decentralized decisions of mayors with respect to their own budgets. This could be the consequence of a “crowding-out” phenomenon, in which mayors see little reason to devote sizeable parts of their budget to public works when they know they have the earmarked FISM funds available. While FISM greatly improved targeting, its decentralized control by mayors might still have an urban bias. Such bias would limit its effectiveness in the improvement of public good provision.
With respect to the democratization, the results of the models show that partisan turnover in power had a strong positive impact on the highest quintiles, but nil effect in all the other quintiles. Apparently, its impact at the high end accounts for the result for the general models in Table 5.2. Perhaps a more fine-grained specification of local democracy can clarify the mechanisms behind this distributive impact. Thus we run the model for the index of democracy in Table 5.5. The results confirm in this specification very strong effects of democracy on improvements in the highest quantile, and also show smaller but positive and statistically significant impacts on the whole range of quantiles.
In sum, we find that the highly centralized and discretionary Pronasol program was at best a mixed blessing with respect to welfare enhancing infrastructure in Mexican municipalities. Pronasol appears to have widened the gap in public services between rich and poor territories. In dramatic contrast, the decentralized formula-based program, FISM, always has strong positive effects on public goods provision while its impact was skewed in favor of the most marginalized municipalities. The emergence of electoral democracy at the municipal level is also a significant factor accounting for improvements in public services in that decade. However, its distributive profile across all municipalities is much less redistributive than FISM. Democratization, in other words, does not entail the rapid catch-up in public goods promise that well-targeted government expenditures can accomplish. Nonetheless, in Mexico in the 1990s, democracy decidedly improved welfare at the local level. We turn now to the question of whether the effects observed in public goods provision, as well as direct transfers given to individuals, impacted well-being, based on an analysis of infant mortality. Did antipoverty programs in Mexico save lives?