My title, “The map is not the territory,” is a famous sentence from a 1931 lecture by the general semanticist Alfred Korzybski (Reference Korzybski1933, p. 750). His meaning is that the graphical structure of a map need not be the structure of the territory (here, the scientific field) that it purports to represent. Statistical graphics, the discipline to which I have migrated his aperçu, is a field in which this insight has particular force. The target article's authors, Bentley et al., declare in their Abstract that they have “create[d] a multiscale comparative ‘map’ that, like a principal-components representation, captures the essence of decision making,” that “each quadrant … features a signature behavioral pattern,” and that “the map will lead to many new testable hypotheses concerning human behavior.” My critique would have been Korzybski's: this map of theirs is not the territory, and cannot be trusted to capture any “essence.” In particular, its topology, which is the conventional topology of principal component score plots, is all wrong for this subject-matter, which is preference profile patterns.
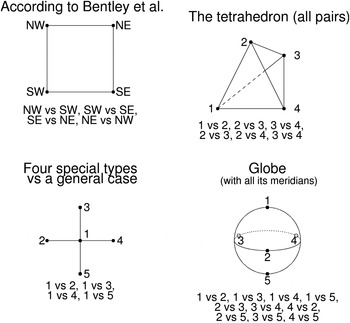
The objection is not so much to Bentley et al.’s quadrants per se as to the geometry of their diagram, which, in keeping with the conventional interpretation of principal components, is flat with a particularly depauperate connectivity. In the upper left panel of my Figure 1, I have redrawn Bentley et al.’s Figure 1 to emphasize the contrasts that concern the authors; these are along the edges of this square. The corresponding philosophical anthropology is a pure distillation of Levi-Strauss: two verbal oppositions (“independent” vs. “social” and “transparent” vs. “opaque”) are treated as if these are as obvious and fundamental as water versus land, male versus female, light versus darkness, alive versus dead, or raw versus cooked, then converted into abstract propositions. We have no information about relationships along the diagonals, or relationships of the periphery to the center; in fact, the center is no construct at all. Nor is there any argument that the right axes are the north–south and east–west here; the phrases remain mere words. Nor do we know if the meaning of “independent versus social,” for instance, is the same in “transparent” as in “opaque” domains of decision-making. There may be more than two types of edges here.
Figure 1.
The “map” according to Figure 1 of Bentley et al., together with three other graphics (tetrahedron, contrast with a general type, globe) based on the same data resources but leading to quite different lists of contrasts, rhetorics of interpretation, and suggested hypotheses for subsequent testing. See text.
“The map,” which is Bentley et al.’s Figure 1, is certainly not “the territory,” which is the actual information content of the data resources. For data arising from samples of time-series, as shown in Bentley et al.’s Equation (1) and Figures 2 and 3, there are many other ways to organize a diagram that lead to quite different reporting languages and quite different “testable hypotheses.” Here are three other possibilities.
Upper right: Four types symmetrically connected
This is the general situation of four types. No evidence is given that the configuration of the authors’ data reduces to the two dimensions Bentley et al. show or, indeed, any two dimensions. Then there need to be six contrasts, not four.
Lower left: Four specialized types out of a common center
This is a commonly encountered topology in studies of biological evolution, wherein multiple descendant species are characterized by derived features that all descend from the same original feature. To the extent that preferences are developmental, they may embody the same central focus.
Lower right: Globe with an axis
Imagine Bentley et al.’s map as a local expansion of coordinate possibilities along an axis that shrinks these possibilities toward zero at either of two extremes, “everything popular” (without further profile) and “everything unpopular” (without further profile). The topology is now a globe. On it, the north and south poles stand for the pure configurations, while an equatorial band offers space for additional parameters corresponding to the decision profiles that incorporate behavioral modifiers. Such data structures are commonly encountered in the compositional sciences, such as mineralogy or personality profiles. The authors’ map is the equatorial plane of this construction (but it still has the wrong topology).
No one of these topologies is more consistent with the authors’ data than any of the others, and nothing about their fundamental Equation (1) prefers the organization of a “map” over any other organization. Instead, each chart generates a different rhetoric of “testable hypotheses.” For instance, the center–periphery topology at lower left would generate hypotheses that each “quadrant” defines itself with respect to an undifferentiated stem, not its opposite on either of the two proferred dimensions; while the topology of the globe would suggest that social agents place their profiles in a context of two extreme pure types, rather than profiling them after the stereotyped fashion of the “principal-components representation” mentioned in the target article's Abstract. The tetrahedral network in my Figure 1's upper right is a far more congenial context than the quadrant scheme for discussions of how a population might be “drifting,” as drifting could be along any angle in the “map,” not just the two cardinal directions.
If my argument here, which is essentially an appeal to foundations of graphical semiotics, is accepted, then the range of “testable hypotheses” flowing from Bentley et al.’s “big data” has been crippled by their choice of a stereotypical graphical metaphor, the “map,” which is flat, with squares on it, and which profoundly lacks the options that real actors in a real situation will refer to as they go about their preference-linked business (e.g., reference profiles, satisficing criteria). It is unfortunate that the authors limit their scientific hypotheses to just the ones that flow from their unquestioned conventional graphical metaphor. For a social world in which the idealization of types need not correspond to any idealization either of their relationships or their representations in the minds of the agent, the imposition of a false symmetry of this kind entails the embrace of a potentially fatal rhetorical risk without any concomitant benefit.





 You have
Access
My title, “The map is not the territory,” is a famous sentence from a 1931 lecture by the general semanticist Alfred Korzybski (Reference Korzybski1933, p. 750). His meaning is that the graphical structure of a map need not be the structure of the territory (here, the scientific field) that it purports to represent. Statistical graphics, the discipline to which I have migrated his aperçu, is a field in which this insight has particular force. The target article's authors, Bentley et al., declare in their Abstract that they have “create[d] a multiscale comparative ‘map’ that, like a principal-components representation, captures the essence of decision making,” that “each quadrant … features a signature behavioral pattern,” and that “the map will lead to many new testable hypotheses concerning human behavior.” My critique would have been Korzybski's: this map of theirs is not the territory, and cannot be trusted to capture any “essence.” In particular, its topology, which is the conventional topology of principal component score plots, is all wrong for this subject-matter, which is preference profile patterns.
The objection is not so much to Bentley et al.’s quadrants per se as to the geometry of their diagram, which, in keeping with the conventional interpretation of principal components, is flat with a particularly depauperate connectivity. In the upper left panel of my Figure 1, I have redrawn Bentley et al.’s Figure 1 to emphasize the contrasts that concern the authors; these are along the edges of this square. The corresponding philosophical anthropology is a pure distillation of Levi-Strauss: two verbal oppositions (“independent” vs. “social” and “transparent” vs. “opaque”) are treated as if these are as obvious and fundamental as water versus land, male versus female, light versus darkness, alive versus dead, or raw versus cooked, then converted into abstract propositions. We have no information about relationships along the diagonals, or relationships of the periphery to the center; in fact, the center is no construct at all. Nor is there any argument that the right axes are the north–south and east–west here; the phrases remain mere words. Nor do we know if the meaning of “independent versus social,” for instance, is the same in “transparent” as in “opaque” domains of decision-making. There may be more than two types of edges here.
The “map” according to Figure 1 of Bentley et al., together with three other graphics (tetrahedron, contrast with a general type, globe) based on the same data resources but leading to quite different lists of contrasts, rhetorics of interpretation, and suggested hypotheses for subsequent testing. See text.
“The map,” which is Bentley et al.’s Figure 1, is certainly not “the territory,” which is the actual information content of the data resources. For data arising from samples of time-series, as shown in Bentley et al.’s Equation (1) and Figures 2 and 3, there are many other ways to organize a diagram that lead to quite different reporting languages and quite different “testable hypotheses.” Here are three other possibilities.
Upper right: Four types symmetrically connected
This is the general situation of four types. No evidence is given that the configuration of the authors’ data reduces to the two dimensions Bentley et al. show or, indeed, any two dimensions. Then there need to be six contrasts, not four.
Lower left: Four specialized types out of a common center
This is a commonly encountered topology in studies of biological evolution, wherein multiple descendant species are characterized by derived features that all descend from the same original feature. To the extent that preferences are developmental, they may embody the same central focus.
Lower right: Globe with an axis
Imagine Bentley et al.’s map as a local expansion of coordinate possibilities along an axis that shrinks these possibilities toward zero at either of two extremes, “everything popular” (without further profile) and “everything unpopular” (without further profile). The topology is now a globe. On it, the north and south poles stand for the pure configurations, while an equatorial band offers space for additional parameters corresponding to the decision profiles that incorporate behavioral modifiers. Such data structures are commonly encountered in the compositional sciences, such as mineralogy or personality profiles. The authors’ map is the equatorial plane of this construction (but it still has the wrong topology).
No one of these topologies is more consistent with the authors’ data than any of the others, and nothing about their fundamental Equation (1) prefers the organization of a “map” over any other organization. Instead, each chart generates a different rhetoric of “testable hypotheses.” For instance, the center–periphery topology at lower left would generate hypotheses that each “quadrant” defines itself with respect to an undifferentiated stem, not its opposite on either of the two proferred dimensions; while the topology of the globe would suggest that social agents place their profiles in a context of two extreme pure types, rather than profiling them after the stereotyped fashion of the “principal-components representation” mentioned in the target article's Abstract. The tetrahedral network in my Figure 1's upper right is a far more congenial context than the quadrant scheme for discussions of how a population might be “drifting,” as drifting could be along any angle in the “map,” not just the two cardinal directions.
If my argument here, which is essentially an appeal to foundations of graphical semiotics, is accepted, then the range of “testable hypotheses” flowing from Bentley et al.’s “big data” has been crippled by their choice of a stereotypical graphical metaphor, the “map,” which is flat, with squares on it, and which profoundly lacks the options that real actors in a real situation will refer to as they go about their preference-linked business (e.g., reference profiles, satisficing criteria). It is unfortunate that the authors limit their scientific hypotheses to just the ones that flow from their unquestioned conventional graphical metaphor. For a social world in which the idealization of types need not correspond to any idealization either of their relationships or their representations in the minds of the agent, the imposition of a false symmetry of this kind entails the embrace of a potentially fatal rhetorical risk without any concomitant benefit.