


1. Introduction
The 1960s' term “future shock” (Toffler Reference Toffler1970) seems ever more relevant today in a popular culture that seems to change faster and faster, where global connectivity seems to spread changes daily through copying the behavior of others as well as through random events. Humans evolved in a world of few but important choices, whereas many of us now live in a consumer world of almost countless, interchangeable ones. Digital media now record many of these choices. Doubling every two years, the digital universe has grown to two trillion gigabytes, and the “digital shadow” of every Internet user (the information created about the person) is already much larger than the amount of information that each individual creates (Gantz & Reinsel Reference Gantz and Reinsel2011).
These digital shadows are the subjects of “big data” research, which optimists see as an outstandingly large sample of real behavior that is revolutionizing social science (Aral & Walker Reference Aral and Walker2012; Golder & Macy Reference Golder and Macy2011; Onnela & Reed-Tsochas Reference Onnela and Reed-Tsochas2010; Ormerod Reference Ormerod2012; Wu & Huberman Reference Wu and Huberman2007). With all its potential in both the academic and commercial world, the effect of big data on the behavioral sciences is already apparent in the ubiquity of online surveys and psychology experiments that outsource projects to a distributed network of people (e.g., Rand Reference Rand2012; Sela & Berger Reference Sela and Berger2012; Twenge et al. Reference Twenge, Campbell and Gentile2012). With a public already overloaded by surveys (Hill & Alexander Reference Hill and Alexander2006; Sumecki et al. Reference Sumecki, Chipulu and Ojiako2011), and an ever-increasing gap between individual experience and collective decision making (Baron Reference Baron2007; Plous Reference Plous1993), the larger promise of big-data research appears to be as a form of mass ethnography – a record of what people actually say and decide in their daily lives. As the Internet becomes accessible by mobile phone in the developing world, big data also offer a powerful means of answering the call to study behavior in non-Western societies (e.g., Henrich et al. Reference Henrich, Heine and Norenzayan2010).
But there is a downside to big-data research. Without clear objectives and a unifying framework, behavioral scientists may ask whether it is useful, for example, to infer from millions of Facebook pages or Twitter feeds that “men are more influential than women … [and] that influential people with influential friends help spread” information (Aral & Walker Reference Aral and Walker2012) or that “people awaken later on weekends” (Golder & Macy Reference Golder and Macy2011). Big-data research runs the risk of merely reinforcing the most convenient “as if” assumptions about human behavior that currently divide the behavioral sciences (e.g., Gintis Reference Gintis2007; Reference Gintis2009; Laland & Brown Reference Laland and Brown2011; Mesoudi Reference Mesoudi2011; Mesoudi et al. Reference Mesoudi, Whiten and Laland2006; Rendell et al. Reference Rendell, Fogarty, Hoppitt, Morgan, Webster and Laland2011). Such assumptions are often chosen to fit the purpose, either (a) at the economic end of the social-science spectrum, where individual decision rules are optimized for the environment and maximize reproductive success or some utility function (Gintis Reference Gintis2007), or (b) at the cultural-historical end, where choices are programmed by broader social influences, “culture” (Davis & Fu Reference Davis and Fu2004), “norms” (Postmes et al. Reference Postmes, Spears and Cihangir2001), or “habitus” (Bordieu Reference Bordieu1990).
The degree of social influence on decision making is an empirical question that underlies what big data mean and how they can be used. As an example of the importance of this issue, consider the ubiquitous reliance on crowdsourcing in behavioral studies, business, and politics (Horton et al. Reference Horton, Rand and Zeckhauser2011) – what Wegner (Reference Wegner1995) termed “transactive memory” and now commonly called the “wisdom of crowds” (Couzin et al. Reference Couzin, Ioannou, Demirel, Gross, Torney, Hartnett, Conradt, Levin and Leonard2011; Lorenz et al. Reference Lorenz, Rauhut, Schweitzer and Helbing2011; Surowiecki Reference Surowiecki2004): Ask a question of a group of diverse, independent people, and the errors in their answers statistically cancel, yielding useful information. Wikipedia is founded on this assumption, of course, even though copying of text is essential to its growth (Masucci et al. Reference Masucci, Kalampokis, Martínez Equíluz and Hernández-García2011).
The wisdom-of-crowds effect is lost, however, if agents are not thinking independently (Bentley & O'Brien Reference Bentley and O'Brien2011; Salganik et al. Reference Salganik, Dodds and Watts2006). There are numerous indications that online behavior may be getting more herdlike, more confused, or even more “stupid” (Carr Reference Carr2008; Onnela & Reed-Tsochas Reference Onnela and Reed-Tsochas2010; Sparrow et al. Reference Sparrow, Liu and Wegner2011). In economies replete with online communication and a constant barrage of information – often to the point of overload (Hemp Reference Hemp2009) – crucial human decision making might be becoming more herdlike in contexts such as voting (Arawatari Reference Arawatari2009) and forming opinions about climate change (Ingram & Stern Reference Ingram and Stern2007), mating (Lenton et al. Reference Lenton, Fasolo and Todd2008; Reference Lenton, Fasolo and Todd2009), music (Salganik et al. Reference Salganik, Dodds and Watts2006), and finances (Allen & Wilson Reference Allen and Wilson2003). Herdlike behavior could be worrisome, say, for those in the public-health and medical sectors (e.g., Bates et al. Reference Bates, Romina, Ahmed and Hopson2006; Benotsch et al. Reference Benotsch, Kalichman and Weinhardt2004; Zun et al. Reference Zun, Blume, Lester, Simpson and Downey2004).
How does one take advantage of big data, with its huge sample sizes and natural contexts, and still address the degree and nature of social influence among the contexts being studied? We introduce here a simple map of the different types and domains of human behavioral innovation – translated as “decision making” – that can be characterized directly from population-scale data. We view the map as analogous to a coarse-grained tool much like a Google map. We illustrate the “zoom” feature of the tool by using one major theory of human decision making: discrete-choice analysis (see McFadden [Reference McFadden2001] and his references to creators of the theory [e.g., Kahneman, Tversky, and Luce]). We chose discrete-choice theory as an expository vehicle because it is related to many other theories of human decision making, both individually and in groups, such as replicator dynamics (Krakauer Reference Krakauer2011), Bayesian updating and information theory (Krakauer Reference Krakauer2011), and statistical mechanics (Durlauf Reference Durlauf1999), as well as to empirical problems associated with measuring “social capital” (Durlauf Reference Durlauf2002). We argue that our conceptual tool – a “reduced form” parameterization of the large research area of discrete-choice approaches to decision making – is useful in helping social scientists navigate these large areas of science just as the Google map tool is useful in navigating geographical areas at various levels of resolution.
2. The map
In the simplest of terms, the map (Figure 1) graphs two analytical dimensions: (1) the extent to which a decision is made independently or socially, and (2) the transparency or opaqueness of the decision in terms of payoff. The western edge of the map represents completely independent decision making, where agents use no information from others in making decisions, and the eastern edge represents pure social decision making, where agents' decisions are based on copying, verbal instruction, imitation, or other similar social process (Caldwell & Whiten Reference Caldwell and Whiten2002; Heyes Reference Heyes1994). The north–south dimension of the map represents a continuum from omniscience to ignorance, or – more formally – the extent to which there is a transparent correspondence between an individual's decision and the consequences (costs and payoffs) of that decision. The farther north we go on the map, the more attuned agents' decisions will be with the landscape of costs and payoffs. As we move south, agents are less and less able to discern differences in potential payoffs among the choices available to them.
Summary of the four-quadrant map for understanding different domains of human decision making, based on whether a decision is made independently or socially and the transparency of options and payoffs. The characteristics in the bubbles are intended to convey likely possibilities, not certitudes.

The map is considerably more than a qualitative description, as it is grounded in established discrete-choice approaches to decision making. If we start with the full version, which we simplify below, we have the equation
 $$\eqalign{&P_t \lpar k\rpar = \displaystyle{1 \over Z_t} {\rm e}^{b_t U\lpar x_{kt} \comma J_t \bar P_t \lpar k\rpar \rpar} \cr & Z_t \equiv \sum\limits_{j = 1}^{N_t} {\rm e}^{b_t U\lpar x_{jt} \comma J_t \bar P_t \lpar\ j\rpar \rpar}}$$
where there are N
t
possible choices at date t, and
 $\bar{P}_t \lpar k\rpar \comma \; b_t \comma \; U\lpar x_{kt} \comma \; J_t \bar{P}_t \lpar k\rpar \rpar$
denote: (1) the probability that choice k is made at date t; (2) the “intensity of choice,” which is inversely related to a standard-deviation measure of decision noise in choice and is positively related to a measure of transparency (clarity) of choice; and (3) the deterministic payoff of choice k at date t. The deterministic payoff is a function,
 $U\lpar x_{kt} \comma \; J_t \bar{P}_t {\rm \lpar }k{\rm \rpar \rpar }$
, of a list of covariates, x
kt
, that influence choice at date t.
 $\bar{P}_t {\rm \lpar }k{\rm \rpar }$
denotes the fraction of people in a relevant peer or reference group that choose option k, and J
t
denotes a strength of social-influence parameter that the fraction of people,
 $\bar{P}_t {\rm \lpar }k{\rm \rpar }$
, in an individual's peer group (sometimes called “reference group”) has on the person (agent) under study. Subscripts appear on variables because their values may change over time, depending on the dynamical history of the system.
The map allows us to operate with only two parameters extracted from Equation (1) above: J t and b t . The east–west dimension of the map represents J t – the extent to which a decision is made independently or socially. The western edge, representing completely independent learning, corresponds to J t = 0 in mathematical notation. Conversely, the eastern edge, pure social decision making, corresponds to J t = ∞. In between the extremes is a sliding scale in the balance between the two. This is a flexible measure in terms of the agents represented. The midpoint could represent, for example, a population of half social learners and half individual learners, or each individual giving a 50% weight to his or her own experience and a likewise amount to that of others. Location along the east–west dimension may not always affect the equilibrium toward which each behavior evolves, but it will certainly affect the dynamics by which that equilibrium is approached.
The north–south dimension of the map represents b t – the extent to which there is a transparent correspondence between an individual's decision and the consequences of that decision. The farther north we go on the map, the more attuned agents' decisions will be with the landscape, which we can represent by the function U(...) of costs and payoffs. At the extreme northern end are behaviors where there is an immediately detectable impact of getting a decision right or wrong. It corresponds to b t = ∞. As we move south, behavioral evolution can begin to create an unconstrained set of possible solutions, meaning there are fewer and fewer reasons for one solution to be preferred over another. The farthest south one can go corresponds to total indifference, which is where b t = 0, and the probability of any particular choice among N t possible choices approaches zero (because 1/N t goes to zero as N t goes to infinity). Choices in the southern extreme of the map need not be trivial, as this end also represents cases where people are poorly informed about their choices and perhaps overwhelmed by decision fatigue – for example, when the number of choices, N t , is very large, or when agents are otherwise unable to discern differences in potential payoffs among the choices available to them (Baumeister & Tierney Reference Baumeister and Tierney2011; Sela & Berger Reference Sela and Berger2012). As the number of options grows, a natural way to try to minimize the cognitive cost of choosing among them would be to simply copy the choices of more-experienced choosers.
In terms of J t and b t , we now have a four-quadrant map on which the extreme northwest is (J t , b t ) = (0,∞), the extreme southwest is (J t , b t ) = (0, 0), the extreme northeast is (J t , b t ) = (∞, ∞), and the extreme southeast is (J t , b t ) = (∞, 0). In addition to characterizing the quadrants in terms of J t and b t , we can characterize them in terms of empirical signatures amenable to big-data analysis.Footnote 1 Our estimations are displayed in Figure 2. The default assumption for many social scientists is the normal distribution – shown in the northwest quadrant in Figure 2a – but there are others, including the negative-binomial distribution, which typifies the southwest quadrant, as well as highly right-skewed, “long-tailed” distribution, which is consistent with phenomena on the eastern half of the map (Fig. 2a).Footnote 2 Figure 2b shows the same distributions plotted as cumulative functions, which accommodate different forms that data might take (cumulative distributions are especially useful for smaller data-sets so that histogram binning is not an issue).
(a) Generalized distributions characterizing the different map quadrants: normal (Gaussian) in the northwest, negative binomial in the southwest, log-normal in the northeast, and power law in the southeast. Each plot shows popularity of a choice on the x-axis versus cumulative probability of having at least that popularity on the y-axis. The left, boxed insets show the non-cumulative fraction of choices on the y-axis that have the popularity indicated on the x-axis; the right, unboxed insets show the same cumulative distributions but with double-logarithmic axes. (b) Representative timelines for the popularity of different options, for each quadrant. Note that the different lines plotted for the northwest quadrant represent different payoffs, such that curves with a lower y-intercept at asymptote represent lower payoff/cost decisions than those with higher intercepts. For the northeast quadrant, the curves (after Kandler & Laland Reference Kandler and Laland2009) represent innovations adopted at different rates and subsequently declining in popularity to levels commensurate with their real-world utility.

In general, the farther south on the map we go, the noisier and less predictable the time series are for the different options. In the northwest, the time series are essentially flat, except when a new discovery is made and adopted according to a rapidly rising r-curve (Fig. 2a, northwest). In the (b t , J t ) discrete-choice setting, this would correspond to adding a new option, call it N t +1, to the original N t options, where the payoff of the new option is larger than that of any of the original options. Given that b t is large in the northwest, we would expect rapid movement toward the new and superior option. Indeed, as b t becomes very large (approaching infinity), all choice jumps as fast as possible to the new option. In the northeast, these behaviors are adopted through social diffusion, which takes the shape of an S-curve, but over the long term, the result is similarly flat timelines (Fig. 2a, northeast). In the northeast, the system can get stuck on inferior alternatives if the social influence to conform to a previously popular choice is strong enough relative to the gain to switching even when the intensity of choice is large (Brock & Durlauf Reference Brock, Durlauf, Heckman and Leamer2001b). In contrast to the north, timelines in the south show turnover in the most popular behavior, either dominated by random noise (Fig. 2a, southwest) or stochastic processes (Fig. 2a, southeast). Turnover in the composition of long-tailed distributions is a fairly new discussion (e.g., Batty Reference Batty2006; Evans & Giometto Reference Evans and Giometto2011), as much of the work in the past century has considered the static form of these distributions.
The map requires a few simplifying assumptions to prevent it from morphing into something so large that it loses its usefulness for generating potentially fruitful research hypotheses. First, it treats the various competencies of agents (intelligence, however measured; education, motor, and cognitive skills; and so on) as real but too fine-grained to be visible at the scale of data aggregated across a population and/or time. Second, agents are not assumed to know what is best for them in terms of long-term satisfaction, fitness, or survival (even rational agents, who are very good at sampling the environment, are not omniscient). Third, we blur the distinction between learning and decision making. Technically, they are separate actions, but this distinction draws too fine a line around our interest in what ultimately influences an agent's decision and how clearly the agent can distinguish among potential payoffs. Fourth, although the map represents a continuous space of b t and J t , we divide it into quadrants for ease of discussion and application to example datasets. Importantly, our characterizations are based on extreme positions of agents within each quadrant. As agents move away from extremes, the characterizations are relaxed.
2.1. Northwest: Independent decision making with transparent payoffs
The northwest quadrant contains agents who make decisions independently and who know the impact their decisions will have on them. The extreme northwest corner is where rational-actor approaches and economic assumptions (Becker Reference Becker1976; Reference Becker1991) – for example, that individuals will always choose the option that provides the best benefit/cost ratio – most obviously and directly apply. Although we cite Becker (Reference Becker1976), especially his Treatise on The Family (Becker Reference Becker1991), as examples of research work on the northwest, we also note Becker's (Reference Becker1962) article in which he shows that many predictions of economic rational-actor theory that would appear in the northwest quadrant (e.g., downward-sloping demand curves) still hold when agents are irrational and simply choose their purchases at random, subject to budget constraints – a behavior found in the southwest quadrant. This is the continuous-choice analog of b t = 0 in a discrete-choice model.
We put Kahneman-type bounded-rationality theories (e.g., Kahneman Reference Kahneman2003) in the northwest because they emphasize actual cognitive costs of information processing and other forces that are rational responses to economizing on information-processing costs and other types of costs in dealing with decision making in a complex world. One of many examples of empirical patterns in the northwest is the “ideal-free distribution,” which predicts the pattern of how exclusive resources are allocated over time through individual agents seeking the best resource patches (e.g., Winterhalder et al. Reference Winterhalder, Kennett, Grote and Bartruff2010). Reward-driven trial and error and bounded rationality contribute to powerful hill-climbing algorithms that form the mechanism delivering the fitness-maximizing behaviors predicted by models of microeconomics and human behavioral ecology (e.g., Dennett Reference Dennett1995; Mesoudi Reference Mesoudi2008; Nettle Reference Nettle2009; Winterhalder & Smith Reference Winterhalder and Smith2000).
It is precisely these algorithms that also begin to move individuals out of the extreme northwest corner and into other areas of the map. This is why we state repeatedly that although we categorize each quadrant with a certain kind of behavior, they represent extremes. An example of a type of dynamic-choice mechanism that fits in the northwest quadrant, but toward the center of the map, is replicator dynamics,
 $$\displaystyle{{{\rm d}P_k } \over {{\rm d}t}} = bP_k \left({U_k - \sum\limits_{j = 1}^N {P_j U_j } } \right)\comma \; \; \; k = 1\comma \; 2\comma \; \ldots N\comma \;$$
where U k is the payoff to choice k (called “fitness” of choice k in the evolutionary-dynamics literature), P k is the fraction of agents making choice k, and b measures the speed of the system in reaching the highest fitness peak, that is, the best choice (Krakauer Reference Krakauer2011; see also Mesoudi Reference Mesoudi2011). Here, b t plays a role similar to what it does in the discrete-choice model: It measures the “intensity” of adjustment of the replicator dynamics toward the highest fitness choice. It is easy to introduce social effects into the replicator dynamics by adding the term JP k to each U k .
2.1.1. Patterns in the northwest
In the northwest quadrant, the popularity of variables tends to be normally (Gaussian) distributed as a result of cost/benefit constraints underlying them.Footnote 3 In terms of resource access, the northwest is exemplified by the “ideal-free distribution,” which predicts the static, short-tailed distribution of resource access per agent through time, as individual agents seek the best resource patches (e.g., Winterhalder et al. Reference Winterhalder, Kennett, Grote and Bartruff2010). In terms of behavior, the northwest implies that the maximal behavior should become the most popular option and remain so until circumstances change or a better solution becomes available. As the new behavior is selected, choices in the northwest will thus have either a stable popularity over time (stabilizing selection) or a rapidly rising r-curve (Fig. 2b, northwest). The sizes of human tools and equipment – handaxes, pots of a certain function, televisions – are normally distributed and located in the northwest quadrant because humans select tools to fit the constraints of the purpose (Basalla Reference Basalla1989). The same is true of the market price of a product or service (Nagle & Holden Reference Nagle and Holden2002), daily caloric intake (Nestle & Nesheim Reference Nestle and Nesheim2012), culturally specific offers in the Ultimatum Game (Henrich et al. Reference Henrich, Boyd, Bowles, Gintis, Fehr, Camerer, McElreath, Gurven, Hill, Barr, Ensminger, Tracer, Marlow, Patton, Alvard and Henrich2005), numerical calculations (Hyde & Linn Reference Hyde and Linn2009; Tsetsos et al. Reference Tsetsos, Chater and Usher2012), and ratings of attractiveness by body-mass index (George et al. Reference George, Swami, Cornelissen and Tovee2008). If these constraints change over time, the mean of the normal distribution shifts accordingly.
2.2. Northeast: Socially based decision making with transparent payoffs
As opposed to the northwest, where individuals recognize new beneficial behaviors and make decisions on their own, behaviors spread socially in the northeast quadrant. Once they learn about a new behavior, through any number of social processes (Laland Reference Laland2004; Mesoudi Reference Mesoudi2011), agents along the northern edge clearly understand the rationale for adopting it in terms of payoff. As the transparency of payoffs begins to blur, however, there is less and less conscious weighing of options and more use of heuristics – efficient cognitive processes, whether conscious or unconscious, that focus only on a portion of the available information. One heuristic is to simply copy what others are doing, whether it is copying the majority (Laland Reference Laland2004) or copying the behaviors of individuals with the most skill or prestige (Atkisson et al. Reference Atkisson, O'Brien and Mesoudi2012; Henrich & Gil-White Reference Henrich and Gil-White2001).
When decisions are based on either success or perceived fitness, eventual outcomes will parallel those of the northwest; human behavioral ecologists call this the “phenotypic gambit” (e.g., Low Reference Low2001; Nettle Reference Nettle2010). The northeast quadrant can therefore apply on a longer time scale, in which an adaptive equilibrium is reached by social-learning processes. Different culture-specific mean offers in the Ultimatum Game, for example, reflect the costs and benefits of group adaptation in a wide range of different environments (Henrich et al. Reference Henrich, McElreath, Bar, Ensminger, Barrett, Bolyanatz, Cardenas, Gurven, Gwako, Henrich, Lesorogol, Marlowe, Tracer and Ziker2006). As long as there is some individual learning and decision making going on within a population – that is, anywhere but along the extreme eastern edge of the map – the eventual outcome can be the same as if all learning and decision making were independent. Along the extreme eastern edge, where there is no independent learning at all to inform the socially learned (imitated) practices in circulation, adaptive potential to an exterior environment is lost. For example, fishermen who always copy other, perhaps more successful fishermen can get stuck in a poorer part of a fishery and fail to locate better areas (Allen & McGlade Reference Allen and McGlade1986). Efficient communal fishing requires some individual boats to randomly probe other areas of a fishery than the ones that look apparently the best based on past catch experience (see Mesoudi Reference Mesoudi2008).
2.2.1. Patterns in the northeast
Along the northern edge of the northeast quadrant, population size affects the efficiency with which agents learn and retain new and better behavioral strategies (Henrich Reference Henrich, O'Brien and Shennan2010; Shennan Reference Shennan2000). This northeast pattern results from plotting the sizes of sample populations, N pop,I, on the x-axis and the number of tools or inventions in those populations on the y-axis. A linear correlation between these variables is predicted for small-scale, adaptive societies (Henrich Reference Henrich, O'Brien and Shennan2010), which was demonstrated empirically by the number of tools recorded on different Oceanic islands at early European contact (Kline & Boyd Reference Kline and Boyd2010). This pattern distinguishes the northeast, as in the other three quadrants population size should not affect the likelihood of adaptive innovations (e.g., Bentley & O'Brien Reference Bentley and O'Brien2011; Bentley et al. Reference Bentley, Lipo, Hahn and Herzog2007; Henrich Reference Henrich, O'Brien and Shennan2010).
One pattern that is consistent with behavior along the far eastern edge of the map is the breakdown of the Law of Large Numbers and the Central Limit Theorem. The idea is this: As the product of the intensity of choice and the strength of social interactions, b t J t , grows larger than some threshold, one can show (Amaro de Matos & Perez Reference Amaro de Matos and Perez1991; Brock & Durlauf Reference Brock, Durlauf, Heckman and Leamer2001b; Repetto Reference Repetto2006) that the Central Limit Theorem underlying the Gaussian distribution breaks down, and more-complicated distributions – mixtures of Gaussian distributions – appear. This behavior is consistent with the east side of the map because it can't happen unless there is positive social influence. However, it can happen when social influence is weakly positive but intensity of choice is high enough so that the product of social influence and intensity of choice exceeds the critical threshold that causes the breakdown of the Central Limit Theorem. Intuitively, what is happening here is a pile-up of correlated behaviors caused by the interaction of social influences coupled with strong enough intensity of choice, which can become large enough to prevent the familiar “washing out” of weakly correlated or zero-correlated effects.
A simple model for this resembles the Gaussian model except that agents do not judge directly which behavior is best but rather which behavior is most popular. If agents copy with a probability proportional to the existing popularity, but with some error, the result should be a log-normal distribution of popularity levels (Fig. 2a, northeast). This is a common pattern, and established modelsFootnote 4 of proportionate advantage (or “preferential attachment” for networks) assume that the popularity of a choice in the current time slice is proportional to its popularity at the previous time slice multiplied by some growth rate normally distributed over time (e.g., Adamic & Huberman Reference Adamic and Huberman2000; Huberman & Adamic Reference Huberman and Adamic1999; Stringer et al. Reference Stringer, Sales-Pardo and Amaral2010; Wu & Huberman Reference Wu and Huberman2007). The result is a log-normal distribution of the accumulated popularity that spreads outward through time on a logarithmic scale, such that turnover is fairly minimal – the most popular choices tend to remain popular (Fig. 2, northeast).
2.3. Southeast: Social decision making without transparent payoffs
The southeast quadrant combines the lack of transparency of payoffs found in the south with the social learning of the east. This is the part of the map where, for the discrete-choice area, J t is large and b t is small. It stimulates the researcher to try to uncover and measure processes that cause the choice system to be located in this quadrant, that is, where social forces are strong and the intensity of choice across available options is small. The low intensity of choice may be the result of a large standard deviation of the random elements in the choice process, and that, in turn, may be a result of a lack of information about the choices relative to the differences in underlying values of the choices. The farther south we go, the less transparent payoffs become. Just to the south of the “equator,” agents might lack knowledge of the benefits of the behavior itself, or even of the qualifications of the people they might learn from, so they imitate based solely on popularity (frequency-dependent decisions) (Eriksson et al. Reference Eriksson, Enquist and Ghirlanda2007). In the extreme southeast, not only are the options themselves equivalent (as in the southwest), but so too are the people who potentially serve as models. It is as if each person points to someone else and says, “I'll have what she's having” (Bentley et al. Reference Bentley, Earls and O'Brien2011).
The null model for the southeast is imitating others as if it were done randomly, which is also known as the neutral model because there is an ignorance – a neutrality – in saying, “I'll have what she's having.” As we discuss below, the neutral model usually requires some minority of independent learning to fit the data, so rarely do real-world situations plot along the extreme eastern edge of this quadrant, which is reserved for complete herding, where everyone imitates someone else (e.g., Helbing et al. Reference Helbing, Farkas and Vicsek2000).
Another type of behavior that one might argue belongs in the southeast is confirmation bias plus weak feedback loops (Strauss Reference Strauss2012). Strong feedback loops induce rapid learning toward the best choice, but weak feedback loops do the opposite. Confirmation bias is a form of mistaken choice and/or mistaken belief that requires repeated challenge and strong immediate feedbacks to change, even though it may be wrong, and perhaps very wrong. Although it is true that confirmation bias and weak feedback loops have nothing to do with social pressures per se, Strauss's (Reference Strauss2012) “filter bubble” – one of six reasons he sees for increasing polarization among U.S. voters – is a channel through which the Internet can reinforce one's own confirmation bias from “linking” that individual to other Internet users with similar preferences. This force could act “as if” it were an increase in peer-group social-influence strength, J t .
2.3.1. Patterns in the southeast
In the extreme southeast, socially based decisions are made, but payoffs among different options completely lack transparency. In this extreme, a simple null model is one in which agents copy each other in an unbiased manner – not intentionally copying skill or even popularity. For maximum parsimony, this can be modeled as a process of random copying. This is not to say that agents behave randomly; rather, it says that in the pattern at the population scale, their biases and individual rationales balance out, just as the errors balance out in the other quadrants. It is “as if” agents are ignorant of the popularity of a behavior.
One version of the unbiased-copying model (e.g., Mesoudi & Lycett Reference Mesoudi and Lycett2009; Simon Reference Simon1955; Yule Reference Yule1924) assumes that N pop agents make decisions in each time step, most of whom do so by copying another agent at random – not another option at random, a behavior that belongs in the southwest, but copying another agent's decision. This model also uses the individual learning variable, μ. Varying this parameter shifts the longitude on the map (μ can be seen as a distance from the eastern edge at μ = 0, with μ = 100% at the extreme western edge). In the core of the southeast, μ is usually rather small, say, 5% of agents choosing a unique, new variant through individual learning. This model can be translated, in a mathematically equivalent way, from populations to individuals by effectively allowing previous social-learning encounters to populate the mind, so to speak. In this Bayesian learning model, social-learning experiences are referenced in proportion to their past frequency (such as number of times a word has been heard), with occasional unique invention (Reali & Griffiths Reference Reali and Griffiths2010).
Unbiased-copying models predict that if we track individual variants through time, their frequencies will change in a manner that is stochastic rather than smooth and continual (northwest and northeast) or completely random (southwest). The variance in relative popularity of choices over time should depend only on their prior popularity and on the population size, N pop. If we use evolutionary drift as a guide, the only source of change in variant frequencies, ν, over time is random sampling, such that the variance in frequencies over time is proportional to ν(1−ν)/N pop (Gillespie Reference Gillespie2004). The popularity is thus stochastic, with the only factors affecting popularity in the next time step being the current popularity and population size. Unbiased-copying models yield highly right-skewed, or long-tailed, distributions of popularity, as shown in Figure 2a (southeast).
This means that turnover (Fig. 2b, southeast) is a diagnostic difference from the northeast quadrant, in that in the southeast the accumulation of innovations – the cultural “ratchet” (Tomasello et al. Reference Tomasello, Kruger and Ratner1993) – should not correlate strongly with population size in the southeast (Bentley et al. Reference Bentley, Lipo, Hahn and Herzog2007; Evans & Giometto Reference Evans and Giometto2011). As Bettinger et al. (Reference Bettinger, Boyd, Richerson and Maschner1996) point out, although there are μ N pop inventions per generation in large populations, “the rate at which they will become fixed is an inverse function of N pop. [T]he two exactly cancel, so that . . . the turnover rate is just the reciprocal of the innovation rate” (p. 147). Although the problem becomes more complicated if the variants are ranked by frequency, such as a “top 10 most-popular list,” the result is essentially the same. As long as a list is small compared with the total number of options (top 10 out of thousands, for example), the list's turnover is continual and roughly proportional to the square root of μ, that is, it is not strongly affected by population size (Eriksson et al. Reference Eriksson, Jansson and Sjöstrand2010; Evans & Giometto Reference Evans and Giometto2011).
2.4. Southwest: Individual decision making without transparent payoffs
The southwest quadrant, where agents interact minimally and choose from among many similar options, is characterized by situations confronted individually but without transparent payoffs. In other words, it is as if agents were guessing on their own. Although this may be a rare situation for individuals in subsistence societies, it may well apply pervasively to modern Western society, where people are faced with literally thousands of extremely similar consumer products and information sources (Baumeister & Tierney Reference Baumeister and Tierney2011; Bentley et al. Reference Bentley, Earls and O'Brien2011; Evans & Foster Reference Evans and Foster2011; Sela & Berger Reference Sela and Berger2012). One candidate phenomenon, however, is entertainment, as preferences can vary such that choices at the population level appear to be random (we present an example in the next section). If hurried decisions are biased toward the most recent information (Tsetsos et al. Reference Tsetsos, Chater and Usher2012), for example, the outcome may appear “as if random” with respect to payoffs. In consumer economics, an effective, practical assumption can be that “purchase incidence tends to be effectively independent of the incidence of previous purchases . . . and so irregular that it can be regarded as if random” (Goodhardt et al. Reference Goodhardt, Ehrenberg and Chatfield1984, p. 626, emphasis in original).
2.4.1. Patterns in the southwest
Whereas the null model for the southeast is imitating others as if it were done randomly, the null model for the southwest is choosing options. In the southwest quadrant, we expect popularity to be governed by pure chance (Ehrenberg Reference Ehrenberg1959; Farmer et al. Reference Farmer, Patelli and Zovko2005; Goodhardt et al. Reference Goodhardt, Ehrenberg and Chatfield1984; Newman Reference Newman2005). In short, the probability of any particular choice becoming popular is essentially a lottery, and as this lottery is continually repeated, the turnover in popularity can be considerable (Fig. 2b, southwest). Ehrenberg (Reference Ehrenberg1959) provided an idealized model for the guesswork of the southwest quadrant, where the distribution of popularity follows the negative binomial function,Footnote 5 in which the probability falls off exponentially (Fig. 2a, southwest). Choices made by guesswork are uncorrelated, yielding a diagnostic pattern, as the exponential tail of the distribution is a sign that events are independent of one another (e.g., Frank Reference Frank2009).
3. Is human decision making drifting to the southeast?
We expect that, in the big-data era, certain aspects of decision making have moved to the southeast, especially given the exponential increase in information and interconnected population sizes (Beinhocker Reference Beinhocker2006; Bettencourt et al. Reference Bettencourt, Lobo, Helbing, Kühnert and West2007; Hausmann et al. Reference Hausmann, Hidalgo, Bustos, Coscia, Chung, Jimemez, Simoes and Yildirim2011). In the subsections below, we consider three examples: language and ideas, relationships, and wealth and prestige.
3.1. Language and ideas
Considering the deep evolutionary roots of human sociality, it is not surprising that social learning (northeast) is how small-scale societies have adapted and accumulated technical knowledge for most of human existence (Apicella et al. Reference Apicella, Marlowe, Fowler and Christakis2012; Henrich et al. Reference Henrich, Boyd, Bowles, Camerer, Gintis, McElreath and Fehr2001; Reference Henrich, Boyd, Bowles, Gintis, Fehr, Camerer, McElreath, Gurven, Hill, Barr, Ensminger, Tracer, Marlow, Patton, Alvard and Henrich2005; Hill et al. Reference Hill, Walker, Božicčević, Eder, Headland, Hewlett, Hurtad, Marlowe, Wiessner and Wood2011). Clearly, the ratchet of cumulative cultural evolution (Tomasello et al. Reference Tomasello, Kruger and Ratner1993) requires a balance of individual and social learners and decision makers (Mesoudi Reference Mesoudi2008; Rendell et al. Reference Rendell, Fogarty, Hoppitt, Morgan, Webster and Laland2011). Often, a small amount of informed individual learning goes a long way, amplified by a majority context of social learning, even among animals (e.g., Couzin et al. Reference Couzin, Krause, Franks and Levin2005). This mix is essentially a description of the northeast quadrant, with b t set to high transparency and J t set at a level of mainly social learning.
As technology has evolved and become something that is cumulative, it has become a phenomenon of the northeast quadrant. In the northeast, if social learners copy the best strategies and thereby make the best decisions (Bentley & O'Brien Reference Bentley and O'Brien2011; Henrich Reference Henrich2004; Mesoudi Reference Mesoudi2008), larger populations will find better technologies faster because there are more individual learners producing information, assuming that individual learners are a fixed proportion of the population.
As another practical measure, increased population size, N, should correlate positively with the rate of new innovations, which has been shown to be linear in small-scale societies (Kline & Boyd Reference Kline and Boyd2010). In modern cities, however, the correlation has become superlinear, where the number of inventions grows proportional to N 1.24 (Bettencourt et al. Reference Bettencourt, Lobo and Strumsky2007b). Bettencourt et al. suggest two alternative explanations for this superlinearity: either inventors are individually more productive in a larger city or there are a disproportionate number of inventors in larger metropolitan areas. Both explanations seem consistent with location in the northeast. If it is the former, then most likely inventors are able to take advantage of more information and not be overwhelmed by it. If it is the latter, then it is still a northeastern pattern, only with a higher proportion of individual learners in the population.
Changing patterns may signal a shift toward the southeast with increased population densities and urbanism. In 1900, approximately 13% of the world's population lived in urban areas. That figure reached 29% in 1950 and 49% in 2005, and it is expected to rise to 60% by 2030 (United Nations 2006). This increase in density could lead human populations away from optimality, in contrast to naturally selected relationships, such as the way the heart rate of organisms shows an optimized, inverse-scaling relationship with body size. As Bettencourt et al. (Reference Bettencourt, Lobo, Helbing, Kühnert and West2007a) observed, there is no such optimization for a modern city, where walking speed scales with population size: The pace of urban life increases with city size in contrast to the pace of biological life, which decreases with organism size.
Of course, as stressed by Romer (Reference Romer, Blanchard, Romer, Spence and Stigltiz2012) and many others, institutions must support innovation, otherwise a large population density does not matter. In other words, when population size is large, individuals on their own cannot search the full space of ideas and must rely on institutions (or, more recently, on search engines) to ensure transparency. As transparency decreases and social influence increases through a combination of inexpensive social-learning opportunities and multiple similar options, there are now ubiquitous highly right-skewed popularity distributions with continual turnover of contemporary commercial markets (Beinhocker Reference Beinhocker2006).
Now, in the big-data era, the process of science and invention – the creation of ideas – has become well-documented. If science proceeds ideally (Kitcher Reference Kitcher1993), it ought to plot in the northeast, where social learning is well-informed and seminal works by academic leaders are selectively adopted and developed by followers (Rogers Reference Rogers1962). Indeed, bibliometric studies show the most successful (highly cited) scientific mentors are those who train fewer protégés (Malmgren et al. Reference Malmgren, Ottino and Nunes Amaro2010), which confirms high J t (more social interaction) together with high b t (more transparency). Also consistent with characteristics of the northeast, citations to scientific articles, and also patents, exhibit a highly right-skewed distribution with only slow turnover in the ranked popularity of citation rates (Bentley & Maschner Reference Bentley and Maschner2000; de Sola Price Reference de Sola Price1965; Stringer et al. Reference Stringer, Sales-Pardo and Amaral2010). This regularity also applies to the keywords used, as Figure 3 shows for a tradition of academic papers. Note that the distribution of word frequencies is log-normal but the turnover within the most popular keywords has been minimal.
Distribution and turnover of keywords among all the articles citing a certain seminal article (Barabási & Albert Reference Barabási and Albert1999): (a) Timelines of relative frequencies (number of keyword appearances divided by total number of words for the year), using the top five keywords of 2005 (logarithmic y-axes); (b) cumulative frequency distributions of all keywords. Open circles show distribution for 2001 and filled circles for 2005.

Further support of scientific publishing's being a phenomenon of the northeast comes from Brock and Durlauf's (Reference Brock and Durlauf1999) use of the binary discrete-choice framework to examine potential social effects on the dynamics of “Kuhnian paradigm shifts” when evidence is accumulating against a current paradigm. Instead of the rapid acceptance of the new paradigm depicted in the northwest time-series plot of Figure 2b, Brock and Durlauf show that social pressures can easily lead to “sticky” dynamics of popularity around the old paradigm but then to a burst of speed toward the new paradigm once a threshold is passed. Consider a population, N pop,t , of scientists, each of whom takes a position on an academic debate. We can represent this by a continuum that is divided into equal-sized “bins.” If J t = 0, meaning that there are no social influences and each academician makes up his or her own mind independently, we might expect a normal distribution centered on the median (mean) academician. As transparency, b t , increases (moves northward), the spread of the distribution narrows. As social influence, J t , increases (moves eastward), the distribution can become bimodal or even multimodal – a mix of normal distributions centered at different means. The map, therefore, leads us to investigate the strength of social influences whenever we see evidence of polarization, that is, evidence of multimodal distributions.
Not surprisingly, compared to more-transparent scientific usage of words necessary to communicate new ideas, the public usage of language is more prone to boom-and-bust patterns of undirected copying in the southeast quadrant. Using raw data in Google's freely available files, we obtained the yearly popularity data for a set of climate-science keywords such as biodiversity, global, Holocene, and paleoclimate (established against a baseline of exponential growth in the number of words published over the last 300 years, a rate of about 3% per year). As we show (Bentley et al. Reference Bentley, Garnett, O'Brien and Brock2012), most of the keywords fit the social-diffusion model almost perfectly. Indeed, almost all of them are becoming passé in public usage, with turnover suggestive of the southeast. Conversely, when we examined the narrow realm of climate-science literature, we found it plots farther north, as its keywords are not nearly subject to the same degree of boom and bust as in the popular media, with a consistency similar to that shown in Figure 3.
With the exceptional changes of online communication and texting, could language itself be drifting into the southeast? Perhaps it has been there for a long time; Reali and Griffiths (Reference Reali and Griffiths2010) suggest that the best null hypothesis for language change is a process analogous to genetic drift – “a consequence of being passed from one learner to another in the absence of selection or directed mutation” (p. 429). We see at least some southeast patterning in published language. By at least 1700, the frequency of words published in English had come to follow a power law, now famously known as Zipf's Law (Clauset et al. Reference Clauset, Shalizi and Newman2009; Zipf Reference Zipf1949). There is regular turnover among common English words (Lieberman et al. Reference Lieberman, Michel, Jackson, Tang and Nowak2007), but turnover among the top 1,000 most-published words seems to have leveled off or even slowed between the years 1700 and 2000, despite the exponential rise in the number of published books (Bentley et al. Reference Bentley, Garnett, O'Brien and Brock2012). This deceleration of turnover with growing effective population is intriguing, as it is not expected for the northeast. A southeast trend is also indicated as online language is copied with much less transparency regarding the quality of the source (Bates et al. Reference Bates, Romina, Ahmed and Hopson2006; Biermann et al. Reference Biermann, Golladay, Greenfield and Baker1999). This would, then, be a long way from the origins of language, which presumably began in the northwest, as straightforward functions such as primate alarm calls have low J t (individual observation of threat), high b t (obvious threat such as a predator), and exhibit Gaussian frequency distributions (Burling Reference Burling1993; Ouattara et al. Reference Ouattara, Lemasson and Zuberbühler2009).
3.2. Relationships
A specific category of language, names within traditional kin systems, acts as a proxy for relationships by informing people of how to behave toward one another. For traditional naming systems, the distribution of name popularity is constrained by the number of kin in different categories, but, of course, first names are socially learned from other kin. Good examples that use big data are the naming networks of Auckland, New Zealand, which Mateos et al. (Reference Mateos, Longley and O'Sullivan2011) have visualized online (http://www.onomap.org/naming-networks/fig2.aspx). Mateos et al. also looked at 17 countries, finding that first-name popularity distributions retain distinct geographic, social, and ethnocultural patterning within clustered naming networks. Many traditional naming systems, therefore, belong in the northeast quadrant, after evolving over generations of cultural transmission into adaptive means of organizing social relations (Jones Reference Jones2010).
If traditional naming tends to map in the northeast quadrant, then the exceptional freedom of naming in modern “WEIRD” (Western, Educated, Industrialized, Rich, and Democratic) nations (Henrich et al. Reference Henrich, Heine and Norenzayan2010) fits the fashionable nature of the southeast model (Berger & Le Mens Reference Berger and Le Mens2009). Studying recent trends in Norwegian naming practices, Kessler et al. (Reference Kessler, Maruvka, Ouren and Shnerb2012, p. 1) suggest that “the rise and fall of a name reflect an ‘infection’ process with delay and memory.” Figure 4 shows how the popularity of baby names yields a strikingly consistent, nearly power-law distribution over several orders of magnitude. Also expected for the southeast, the twentieth-century turnover in the top 100 U.S. names was consistent, with about four new boys' names and six new girls' names entering the respective top-100 charts per year (Bentley et al. Reference Bentley, Lipo, Hahn and Herzog2007).
Distribution of the popularity of boys' names in the United States: left, for the year 2009; right, top 1,000 boys' names through the twentieth century, as visualized by babynamewizard.com.

Although it should not be surprising if names traditionally map in the northeast, and have shifted southeast in Western popular culture, what about relationships themselves? For prehistoric hominins, one of the most basic resource-allocation decisions concerned the number of relationships an individual maintained, which was constrained by cognitive capacity and time allocation (Dunbar Reference Dunbar1993). We would expect such crucial resource-allocation decisions to plot in the northwest, with low J t and high b t . We therefore expect a Gaussian distribution of number of relationships, although the mean will vary depending on how costly the relationships are. Indeed, the “Dunbar number” (Dunbar Reference Dunbar1992) limit of approximately 100–230 stable social relationships per personFootnote 6 refers to a mean of this normal distribution, which varies according to relationship type (e.g., friendships, gift partners, acquaintances).
Figure 5 shows that the mean number of gift partners among hunter-gatherers is Gaussian, with a mean of a few or several individuals (Apicella et al. Reference Apicella, Marlowe, Fowler and Christakis2012). The data are from surveys (subjects were asked to whom they would give a gift of honey) of more than 200 Hadza (Tanzania) women and men from 17 distinct camps that have fluid membership (Apicella et al. Reference Apicella, Marlowe, Fowler and Christakis2012). The Gaussian distribution in Hadza “gift network” size surely reflects the constraint of living in camps of only about 30 individuals. In the post-industrial West, with the differences of time expenditure, we might expect a larger mean number of relationships, but still with the same evidence for low J t and high b t of the northwest. Figure 5 shows how the distribution is similar to that of close friends among students at a U.S. junior high school (Amaral et al. Reference Amaral, Scala, Barthélémy and Stanley2000). We expect the distribution mean to increase even further as relationships go online. The mean number of Facebook friends per user (Lewis et al. Reference Lewis, Kaufman, Gonzalez, Wimmer and Christakis2008, Reference Lewis, Gonzalez and Kaufman2011) is indeed larger, and yet still the distribution follows almost the same Gaussian form when scaled down for comparison (Fig. 5). This Gaussian distribution of friends per Facebook users is consistent, with their interaction network being bounded at around 100 (Viswanath et al. Reference Viswanath, Mislove, Cha, Gummadi, Crowcroft and Krishnamurthy2009). Given that the friendship distributions are consistent for the different categories of relationships, we assume their Gaussian distributional form has been consistent through time, as expected for the northwest (Fig. 2b).
Gaussian distributions of social ties per person as examples of behavior in the northwest. Open circles show hunter–gatherer gift-exchange partners, gray circles show school friends, and black circles show Facebook friends. The main figure shows cumulative distributions of social ties per person; the unboxed inset shows the same distribution on double logarithmic axes (compare to Figure 2, northwest inset); and the boxed inset shows the probability distribution. Data for the hunter–gatherer gift-exchange partners are from Apicella et al. (Reference Apicella, Marlowe, Fowler and Christakis2012); for school friends from Amaral et al. (Reference Amaral, Scala, Barthélémy and Stanley2000); and for Facebook friends from Lewis et al. (Reference Lewis, Kaufman, Gonzalez, Wimmer and Christakis2008; see also Lewis et al. Reference Lewis, Gonzalez and Kaufman2011).

Unlike Facebook, other online social networks (e.g., Skitter, Flickr) show more fat-tailed distributions in numbers of relationships; these right-skewed distributions resemble information-sharing sites such as Digg, Slashdot, and Epinions (konect.uni-koblenz.de/plots/degree_distribution). Krugman (Reference Krugman2012) points out how the number of followers among the top-100 Twitter personalities is long-tailed, and indeed the continually updated top 1,000 (on twitaholic.com) is log-normally distributed, as confirmed by a massive study of over 54 million Twitter users (Cha et al. Reference Cha, Benevenuto, Haddadi and Gummadi2012). Checking in June 2012 and then again in the following November, we found that the log-normal distribution of followers remained nearly identical (in normalized form), despite Twitter growing by roughly 150,000 followers a day.
These heavily right-skewed distributions place Twitter in the east, with high J t , but is it northeast or southeast? Overall, the turnover and right-skewed popularity distributions of Twitter would appear to map it in the southeast. By tracking the most influential Twitter users for several months, Cha and colleagues (Reference Cha, Haddadi, Benevenuto, Gummadi, Hearst, Cohen and Gosling2010) found that the mean influence (measured through re-tweets) among the top 10 exhibited much larger variability in popularity than the top 200. This can be roughly confirmed on twitaholic.com, where the mean time on the top-1,000 Twitter list on June 10, 2012, was 42 weeks, with no significant correlation between weeks on the chart and number of followers. Twenty-four weeks later, the mean time on the top-1,000 list had increased by six weeks. At both times, the lifespan in the top 10 was only several weeks longer than that in the top 1,000, suggesting surprisingly little celebrity (prestige) bias as opposed to just unbiased copying that occurs in rough proportion to current popularity.
These changes appear to reflect the media more than the individuals within them. Twitter, for example, is more a broadcasting medium than a friendship network (Cha et al. Reference Cha, Benevenuto, Haddadi and Gummadi2012). Unlike with traditional prestige, popularity alone on Twitter reveals little about the influence of a user. Cha and colleagues found that Twitter allows information to flow in any direction (southeast) rather than the majority learning from a selected group of well-connected “influentials” (northeast). Because information flows in all directions, we place Twitter in the southeast, as it “does not follow the traditional top-to-bottom broadcast pattern where news content usually spreads from mass media down to grassroots users” (Cha et al. Reference Cha, Benevenuto, Haddadi and Gummadi2012, p. 996). This suggests information sharing may be shifting southeast even if actual relationships are not. Indeed, there is evidence for a critical level of popularity, where the downloading of “apps” from Facebook pages shifts eastward on our map, that is, from individual decision making to socially based decision making (Onnela & Reed-Tsochas Reference Onnela and Reed-Tsochas2010).
3.3. Wealth and prestige
Although Twitter exhibits a new, grassroots role in terms of influencing and spreading information, there is no doubt that just about all the members of the top-1,000 on Twitter are prestigious, at least by the definition of Henrich and Gil-White (Reference Henrich and Gil-White2001), in that millions of people have freely chosen to “follow” them. If prestige and popularity are to become synonymous on Twitter, then prestige on this medium will plot in the southeast, as people naturally copy those whom others find prestigious rather than make that determination individually (Henrich & Gil-White Reference Henrich and Gil-White2001). To an unprecedented level, Twitter clearly exploits our preference for “popular” people, which “evolved to improve the quality of information acquired via cultural transmission” (Henrich & Gil-White Reference Henrich and Gil-White2001, p. 165). Twitter celebrities are thus more able to act as “evangelists” who can “spread news in terms of . . . bridging grassroots who otherwise are not connected” (Cha et al. Reference Cha, Benevenuto, Haddadi and Gummadi2012, p. 997).
Most of the top-1,000 Twitter personalities are also wealthy, of course, and prestige, wealth, and popularity are well entwined in this medium. Could this signal a future shift toward the southeast? We would normally map gift-giving in the northeast, as a transparent means of maintaining relationships and reducing risk through social capital (Aldrich Reference Aldrich2012). Even in the West, patterns of charity still exhibit northeast patterns. Charitable giving in the United States from 1967 to the present, for example, has exhibited a log-normal distribution per category (religion, education, health, arts/culture, and so on) that did not change appreciably in form over a 40-year period (Fig. 6). Nor did the rank order of charitable giving by category change. It is immediately striking what a long-term, sustained tradition charitable giving is among generations of Americans.
Charitable giving in the United States: left, past 30 years, at the national level; right, relative growth of several categories of charitable giving in the United States, over a 40-year period (popularity is expressed as the fraction of the total giving for that year, on a logarithmic scale). Data from Giving USA Foundation (2007).

As charitable-giving habits are inherited through the generations, the wealth of the recipients, such as universities and churches, depends on this northeast pattern. It should not be surprising, then, if wealth itself shows a northeast phenomenon, even in small-scale societies. Pareto distributions of wealth typify modern market economies, but even in traditional pastoralist communities, for example, wealth may follow the highly right-skewed form of the northeast. Figure 7 shows how distributions can vary. We would map Karomojong pastoralists (Dyson-Hudson Reference Dyson-Hudson1966), whose cattle-ownership distribution is the most Gaussian (Fig. 7), farther west than the Ariaal of northern Kenya (Fratkin Reference Fratkin1989) and the Somali (Lewis Reference Lewis1961), whose wealth is highly right-skewed (Fig. 7). This fits with ethnographic information, as Karomojong pastoralists culturally impose an equality among members of each age set (Dyson-Hudson Reference Dyson-Hudson1966), whereas Ariaal herd owners “increase their labor through polygyny, increased household size, and the hiring of poor relatives” (Fratkin Reference Fratkin1989, p. 46). Transparency of wealth increases with the rising cost of competition and the agglomeration of power, as powerful tribes expand at the expense of smaller groups (Salzman Reference Salzman1999).
Wealth among pastorialists, with a cumulative probability distribution plot comparing published ethnographic data from the Somali (Lewis Reference Lewis1961) with gray circles, the Ariaal (Fratkin Reference Fratkin1989) with white circles, and Karomojong (Dyson-Hudson Reference Dyson-Hudson1966) with filled black circles.

Given these northeast patterns for the fairly static distributions of wealth and prestige in traditional societies, what could we expect from emerging southeast patterns in an online society? On the one hand, we have a pull toward the southeast in highly social realms of information overload such as Twitter. On the other hand, powerful search engines that help people find the most relevant information from others, the ubiquity of social rating, and the increased relevance of “grassroots” influences (Cha et al. Reference Cha, Benevenuto, Haddadi and Gummadi2012) may keep things in the northeast, as social learning is better informed. If intelligent search technology gains the upper hand on information overload, then b t increases and the crucial variable is J t . If J t is low, then prestige or exclusive access to resources is less transferrable from one person to another, and inequality is lessened.
4. Discussion and conclusions
To address collective behavior in the big-data era, the map we present here, with its dimensions of social influence and transparency of payoff, has allowed us to situate big data in a much broader perspective, alongside data from past and present societies. Although some of the conclusions we make from these data are clear from qualitative observation, the new world of big-data research makes it impossible to personally witness all of the decisions being made. We therefore have sought a set of empirical signatures that can be detected in massive sets by simple statistical means, which we might someday even see automated. The mapping then helps identify the more granular tools of various social-science research traditions that will be most useful for a particular case study: the northwest (economic), the southeast (cultural-historical), the northeast (both), and the southwest (neither).
The map quadrants can be characterized by different patterns – change through time and distributions of popularity – that can be gleaned from the kinds of data that the behavioral sciences hope to understand. The map is more than an academic exercise. It becomes highly practical with respect to public policy, for example, by providing direction over whether it is more effective to disseminate information in the northwest, engage targeted “word of mouth” campaigns in the northeast, or place many bets more randomly in the southeast (Bentley et al. Reference Bentley, Earls and O'Brien2011; Sela & Berger Reference Sela and Berger2012; Watts & Hasker Reference Watts and Hasker2006). The map provides a means for evaluating population-level trends in the kinds of decision-making categories noted earlier – voting, opinions on climate change, mating, health care, consumer trends – which we see beginning to move to the southeast.
This can be important in a world where policy may not match the way human decisions are made. Much of traditional social science and policy has used the northwest as its base assumption that public behavior is dictated by cost/benefit ratios and incentives, even if slightly flawed or biased in perception (e.g., Kahneman Reference Kahneman2003). This comprehensive practicality is why the map is not just another theoretical classification scheme. It allows a data-driven study question, reframed as a hypothesis, to be tested with appropriate datasets by examining whether b t , the degree of transparency of payoffs, decreases through time and whether J t , the intensity of social influence, increases through time for contexts in which the (b t , J t ) discrete-choice framework is appropriate. Because these dimensions are general, realms of behavior can potentially be linked through this approach. For example, the discrete-choice framework has been used to document the rise of polarized political behavior in the United States: Li and Lee (Reference Li and Lee2009) found J t > 0 for the Clinton–Dole presidential election, and McCarty et al. (Reference McCarty, Poole and Rosenthal2006) linked this polarization to the dramatic rise in income inequality.
Of course, b t and J t are not everything. One interesting future project would be to explore the effects of other dimensions (parameters) that we have deliberately avoided with our simplified map. Where social learning is well informed, personal biases such as trust, prestige, and status will obviously matter (e.g., Eriksson et al. Reference Eriksson, Enquist and Ghirlanda2007; Reference Eriksson, Jansson and Sjöstrand2010; Henrich & Gil-White Reference Henrich and Gil-White2001). Perhaps the most important phenomenon we might next consider is how the structure of social networks affects the dynamics of social learning (e.g., Borgatti et al. Reference Borgatti, Mehra, Brass and Labianca2009; Dodds & Watts Reference Dodds and Watts2005). The map quadrants relate to contemporary debates such as the “spread” of obesity (Christakis & Fowler Reference Christakis and Fowler2007) or voting and consumer preferences (Aral & Walker Reference Aral and Walker2012), in which each debate revolves around whether certain behaviors are really spreading along a directed network as opposed to like-minded people simply associating (e.g., Shalizi & Thomas Reference Shalizi and Thomas2010). The map changes the discussion about interaction networks. Rather than a “wiring diagram” between human beings, what matters is understanding how the dynamics of decision making derive from overall network structure (Ormerod Reference Ormerod2012). For example, highly clustered social networks appear to favor the spread of norms of cooperation (Ohtsuki et al. Reference Ohtsuki, Hauert, Lieberman and Nowak2006) and norms of innovations by introducing them repeatedly to individuals through different neighbors of a cluster (Centola Reference Centola2010; Helbing & Yu Reference Helbing and Yu2009; Lorenz et al. Reference Lorenz, Rauhut, Schweitzer and Helbing2011).
More generally, Lieberman et al. (Reference Lieberman, Hauert and Nowak2005) identified those social-network arrangements favorable to selection (northeast) versus random drift, or undirected copying (southeast), in the sorting of variation. These generalized networks fit the map well. In Figure 8, we have placed in the southeast the diffuse networks that Lieberman et al. (Reference Lieberman, Hauert and Nowak2005) identify with drift and in the northeast the hierarchical networks they associate with selection. Figure 8 illustrates how the map organizes the behavior of a binary dynamic-choice system. The northwest quadrant illustrates that when the intensity of choice, b t , is very large, P +,t will be close to one when the net payoff to +1 is positive (the dot is solid black) and will be close to zero when the net payoff to +1 is negative (the dot is solid white). This case corresponds to a very strong force of selection in Krakauer's (Reference Krakauer2011) evolutionary dynamics, meaning that the replicator equation has a large value of b t . The mix of dots with various shades of gray in the southwest depicts the wide range of values of P +,t when b t is very small, even when the net payoff to +1 is positive. The directed networks (with either black dots or white dots for the choices) depicted in the northeast quadrant are intended to capture the idea that social influence will be very strong (and P +,t will be close to one or zero) when b t is large, even if J t is of moderate size. The various shades of gray in the directed network in the southeast quadrant are intended to capture the idea that many values of P +,t are likely to be observed because b is small.
A representation of how social-network structure (or lack thereof) fits onto the map (schema adapted from Lieberman et al. Reference Lieberman, Hauert and Nowak2005). In each quadrant, circles represent agents, and shades represent their choices. In the east, arrows represent social influences through which agents make most of their choices, whereas in the west, agents make choices independently.

The network rendition of the map helps us match big-data patterns to practical or theoretical challenges. If one aims to shift collective behavior from the herdlike southeast to the more-informed northeast, then learning networks ought to become more directed and hierarchical. In fact, it appears that hierarchical networks are a natural component of group adaptation (Hamilton et al. Reference Hamilton, Milne, Walker, Burger and Brown2007; Hill et al. Reference Hill, Bentley and Dunbar2008; Saavedra et al. Reference Saavedra, Reed-Tsochas and Uzzi2009) and may provide a crucial element to the debate over the evolution of cooperation, for which punishment of non-cooperators appears to be insufficient (Dreber et al. Reference Dreber, Rand, Fudenberg and Nowak2008; Helbing & Yu Reference Helbing and Yu2009; Rand et al. Reference Rand, Dreber, Ellingsen, Fudenberg and Nowak2009).
In this way, the map puts big data into the big picture by providing a means of representing, through case-specific datasets, the essence of change in human decision making through time. In a given context, we may wish to assess, from population-scale data, whether people are still responding to incentives and/or behaving in near-optimal ways with respect to their environment (e.g., Horton et al. Reference Horton, Rand and Zeckhauser2011; Nettle Reference Nettle2009; Winterhalder & Smith Reference Winterhalder and Smith2000). If so, then cumulative innovations should generally improve technological adaptation over time or even human biological fitness (Laland et al. Reference Laland, Odling-Smee and Myles2010; Milot et al. Reference Milot, Mayer, Nussey, Boisvert, Pelletier and Réale2011; Powell et al. Reference Powell, Shennan and Thomas2009; Tomasello et al. Reference Tomasello, Kruger and Ratner1993). Conversely, if the vicissitudes of social transmission, fads, and cultural drift are driving innovation, then such improvements are not guaranteed (e.g., Cavalli-Sforza & Feldman Reference Cavalli-Sforza and Feldman1981; Koerper & Stickel Reference Koerper and Stickel1980).
A big question is whether change in hominin evolution has been roughly clockwise, from the individual learning of the northwest, to the group traditions of the northeast with the evolution of the social brain, to the south – particularly the southeast – as information and interconnected-population sizes have increased exponentially through time (Beinhocker Reference Beinhocker2006; Bettencourt, Lobo & Strumsky Reference Bettencourt, Lobo and Strumsky2007). If we consider the smaller societies of human prehistory, crucial resource-allocation decisions would plot in the northern half of the map, and the more specific behaviors would range between the northwest and the northeast. Because Homo economicus is located at the extreme northwest, he does not appear to be the primary model for human culture, considering that the deep evolutionary roots of human sociality, social-learning experiments, and ethnographic research all suggest that social learning is how small-scale societies have adapted to environments for most of human existence (e.g., Apicella et al. Reference Apicella, Marlowe, Fowler and Christakis2012; Byrne & Russon Reference Byrne and Russon1998; Henrich et al. Reference Henrich, Boyd, Bowles, Camerer, Gintis, McElreath and Fehr2001, Reference Henrich, Boyd, Bowles, Gintis, Fehr, Camerer, McElreath, Gurven, Hill, Barr, Ensminger, Tracer, Marlow, Patton, Alvard and Henrich2005; Tomasello et al. Reference Tomasello, Carpenter, Call, Behne and Moll2005). The ideal position in the northeast appears to be dictated by the spatial and temporal autocorrelation of the environment and the cost of individual learning (Mesoudi Reference Mesoudi2008).
The examples we discussed in section 3 place many social-network media on the east side of the map. This does not necessarily mean that people are fundamentally changing, however, although perhaps they are to a small degree (Sparrow et al. Reference Sparrow, Liu and Wegner2011). Rather, it means that online environs sort behavior differently. In our Internet world of viral re-tweets and their associated scandals, interest in a “world brain” – a science fiction of H. G. Wells's – has been reborn, as the number of people exchanging ideas in an economy determines the complexity of a nation's science and technology (Hausmann et al. Reference Hausmann, Hidalgo, Bustos, Coscia, Chung, Jimemez, Simoes and Yildirim2011).
When humans are overloaded with choices, they tend to copy others and follow trends, especially apparently successful trends. If too far southeast, this corrodes the distributed mind. One realm where this may clearly be important is academic publishing. Should we worry that academic publishing may drift southeast? A drift in this direction certainly seems possible, especially with quality no longer transparent among an overwhelming number of academic articles (Belefant-Miller & King Reference Belefant-Miller and King2001; Evans & Foster Reference Evans and Foster2011; Simkin & Roychowdhury Reference Simkin and Roychowdhury2003). To maintain transparency in the northeast, it seems sensible to maintain support for rigorous, specialist-access academic journals, against pressure to blur scientific publications with blogs and social media (Bentley & O'Brien Reference Bentley and O'Brien2012).
Could a drift southward be even a more-general trend? Successful technological innovations generate a multitude of similar options, thereby reducing the transparency of options and payoffs (O'Brien & Bentley Reference O'Brien and Bentley2011). One consequence of this proliferation of similar alternatives is that it becomes more and more difficult for learning processes to discover which options are in fact marginally better than others. This pushes decisions southward and paradoxically may mean that modern diverse consumer economies may be less-efficient crucibles for the winnowing of life-improving technologies and medicines than societies were in the past and some traditional societies are today (Alves & Rosa Reference Alves and Rosa2007; Marshall Reference Marshall2000; Voeks Reference Voeks1996). It might be argued that the drift in mass culture toward the southeast is not a particularly fit strategy, as the propensity for adaptation found in the north is lost.
We might assume that because we've spent most of our evolutionary history in the north, the “best” behaviors, in terms of fitness, are the ones that become the most popular. It could be argued that important health decisions ought to lie in the northwest, and in traditional societies it seems that's the case – such decisions are not strongly socially influenced (Alvergne et al. Reference Alvergne, Gurmu, Gibson and Mace2011; Mace & Colleran Reference Mace and Colleran2009). To the extent that there is social influence, it typically comes from close kin (Borgatti et al. Reference Borgatti, Mehra, Brass and Labianca2009; Kikumbih et al. Reference Kikumbih, Hanson, Mills, Mponda and Schellenberg2005). As modern mass communication becomes available, however, the cost of gaining health information socially declines – a shift eastward on the map – but it also makes socially transmitted health panics more common (Bentley & Ormerod Reference Bentley and Ormerod2010).
In conclusion, we note that it is easy to be intimidated by big-data studies because the term really means BIG data. In these early days of big data, however, many studies seem to show us the obvious. In the best case, big-data studies will not compete with more traditional behavioral science but instead will allow us to see better how known behavioral patterns apply in novel contexts. In fact, they may even validate the most basic Bayesian analysis of human behavior there is, which is human experience. Humans sample the actions of their peers just by living among them for a lifetime. This takes us back to the northwest: Popularity does not guarantee quality. As long as people trust their own individual experiences, even in observing the behavior of others, a collective wisdom is possible.
ACKNOWLEDGMENTS
We thank Barbara Finlay, Herbert Gintis, David Geary, and our anonymous reviewers for excellent comments and advice on earlier drafts. We also thank Daniel Nettle for his many insights and suggestions for strengthening the argument, and Jonathan Geffner and Sumitra Mukerji for their editorial and production assistance.


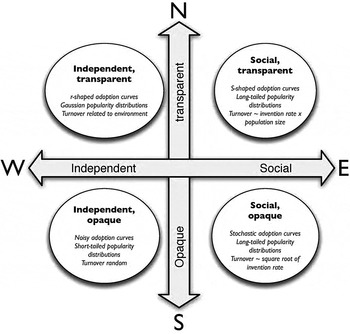
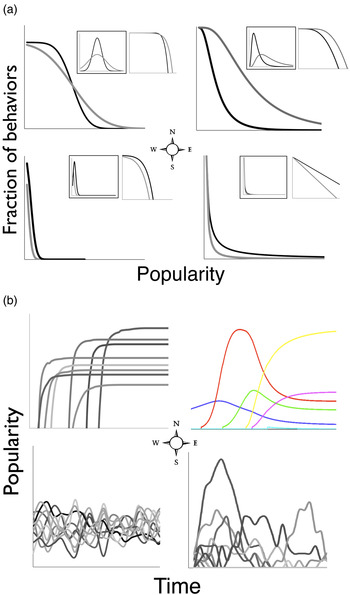
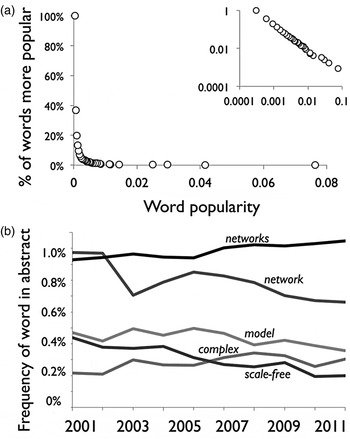
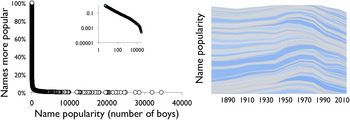
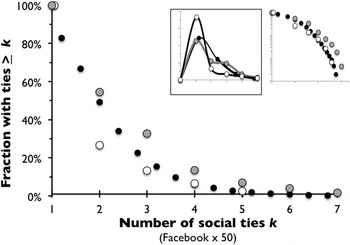
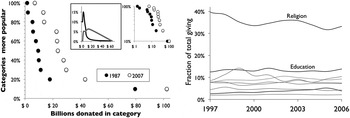
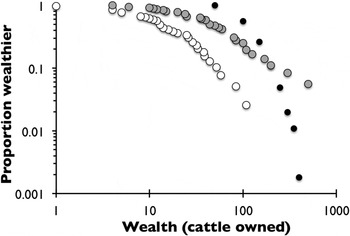
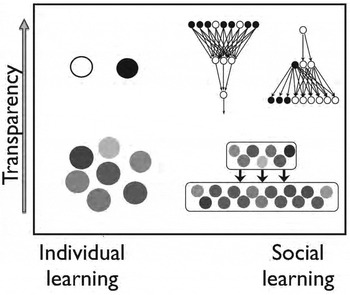



Target article
“Big data” needs an analysis of decision processes
Related commentaries (1)
Mapping collective behavior in the big-data era