We applaud Bentley et al. for postulating a map of the environment in the form of a two-by-two classification. Too much of psychological theorizing still focuses on internal factors alone, such as traits, preferences, and mental systems – a kind of theorizing that social psychologists once labeled the “fundamental attribution error.” Yet Bentley et al. are in danger of committing the opposite error: to theorize without regard of the cognitive processes. Herbert Simon (Reference Simon1956) noted more than 50 years ago that decision making is rather akin to the two blades of a scissors: the one blade is the decision strategy or heuristic; the other, the environment. Decision strategies have evolved and adapted to a given environment, and their rationality is ecological: therefore, one needs to analyze both the cognitive processes and the structure of the environment (Gigerenzer et al. Reference Gigerenzer and Todd1999).
To apply this argument to Bentley et al., we show that the distributions in the four quadrants do not simply depend on the two environmental features, but, in addition, on the decision processes people rely on. We illustrate this point by a demonstration: We define two decision processes that have a strong social component but differ in whether social influence comes in the first step (the construction of the consideration set) or in the second step (the choice from this set). We then demonstrate that (1) within the same environmental structure (quadrant), the two decision processes can generate different distributions, and that (2) when the same decision process is used in two quadrants that differ in terms of transparency, the resulting distributions are almost identical.
We simulate 10,000 agents who sequentially choose from a set of 100 items (e.g., cameras, wines) drawn from a multivariate normal distribution. The agents aim for the item with the highest possible quality. The agents cannot evaluate the quality of the item with certainty but have to infer it from three attributes. They learn about each attribute's validity, that is, the relative frequency with which the attribute correctly predicts the item with the highest quality in pair-comparisons, in an initial training phase where they randomly sample 10 items.
Endowed with this knowledge, agents use a two-step decision process to select the best item. In the first step, each agent forms a subset of the available items, the consideration set (n = 3; Hauser & Wernerfelt Reference Hauser and Wernerfelt1990). In the second step, the agents decide which item to choose from this set by using a lexicographic decision rule akin to the take-the-best heuristic (Gigerenzer & Goldstein Reference Gigerenzer and Goldstein1996). It ranks the attributes according to their validity; the item with the highest value on the most valid attribute is then chosen. In case two or more items have the same value on the first attribute, the second, and then the third attribute, respectively, is examined; if neither discriminates, the agents choose randomly.
Social influence is introduced in both processes but in different steps of the process. In the popularity-set heuristic, social influence is introduced in the first step. The probability that an item is part of the consideration set is proportional to how often the item has been selected by other agents in the past. In the popularity-cue heuristic, social influence enters in the second step as an additional, equally treated, fourth attribute corresponding to how often the item had been selected by others.
In the low-transparency environment, the correlations between quality and the three attributes are weak (0.11, 0.10, 0.10). In the high-transparency environment, the correlations between quality and attributes are strong (0.90, 0.69, 0.61). These environments correspond to the very north and south of the map by Bentley et al. just short of the border. In both scenarios, the inter-correlations between the attributes are held constant at 0.4. [The details of the simulation can be found at:http://www.mehdimoussaid.com/.]
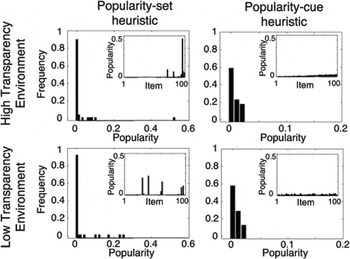
As shown in Figure 1, the popularity-set heuristic generates collective herding, regardless of the environmental features. Here, a feedback loop operates: The more people choose an item, the more this item becomes attractive for subsequent decision-makers. This leads to a few products becoming very popular, while most others are ignored. In contrast, the popularity-cue heuristic generates a homogeneous distribution of popularity, where each item receives a similar, low amount of choices, in high- and low-transparency environments alike. Here, social influence applies to a reduced subset of the items only, which prevents the feedback loop from setting up. These results show that different processes generate strikingly different results in the same environment. Likewise, the same process generates similar results when it is applied to different environments.
Figure 1.
The popularity distributions do not simply depend on Bentley et al.’s distinction between low- and high-transparency environments but also on the decision processes (heuristics). Within the same environmental structure (rows), the distributions change with the decision processes. When the same process (heuristic) is applied to different environments (columns), the result can be the same distribution. The outside graphs show the distribution of items’ popularity at the end of the simulation. The popularity of an item is measured as the fraction of agents who have chosen that item. The inner graphs show the popularity reached by each of the 100 items separately, which are ordered according to their quality, from low quality (left) to high quality (right).
The conceptual map by Bentley et al. neatly reduces the environment to two variables. However, whether decisions are arrived at independently or not, and whether the information is transparent or not, is only half of the story. To fully understand what patterns emerge, one needs to account for the decision process. The relevance of such an approach is heightened by the interdependence of the social context where both mind and environment adapt to each other (see, e.g., Artinger & Gigerenzer, in preparation; Moussaïd et al., Reference Moussaïd, Kämmer, Analytis and Neth2013). The advent of big data and the combination of experimental and simulation methods provide ample opportunities to study adaptive decision processes, stepping outside the black box of “as-if” decision theories.





 You have
Access
We applaud Bentley et al. for postulating a map of the environment in the form of a two-by-two classification. Too much of psychological theorizing still focuses on internal factors alone, such as traits, preferences, and mental systems – a kind of theorizing that social psychologists once labeled the “fundamental attribution error.” Yet Bentley et al. are in danger of committing the opposite error: to theorize without regard of the cognitive processes. Herbert Simon (Reference Simon1956) noted more than 50 years ago that decision making is rather akin to the two blades of a scissors: the one blade is the decision strategy or heuristic; the other, the environment. Decision strategies have evolved and adapted to a given environment, and their rationality is ecological: therefore, one needs to analyze both the cognitive processes and the structure of the environment (Gigerenzer et al. Reference Gigerenzer and Todd1999).
To apply this argument to Bentley et al., we show that the distributions in the four quadrants do not simply depend on the two environmental features, but, in addition, on the decision processes people rely on. We illustrate this point by a demonstration: We define two decision processes that have a strong social component but differ in whether social influence comes in the first step (the construction of the consideration set) or in the second step (the choice from this set). We then demonstrate that (1) within the same environmental structure (quadrant), the two decision processes can generate different distributions, and that (2) when the same decision process is used in two quadrants that differ in terms of transparency, the resulting distributions are almost identical.
We simulate 10,000 agents who sequentially choose from a set of 100 items (e.g., cameras, wines) drawn from a multivariate normal distribution. The agents aim for the item with the highest possible quality. The agents cannot evaluate the quality of the item with certainty but have to infer it from three attributes. They learn about each attribute's validity, that is, the relative frequency with which the attribute correctly predicts the item with the highest quality in pair-comparisons, in an initial training phase where they randomly sample 10 items.
Endowed with this knowledge, agents use a two-step decision process to select the best item. In the first step, each agent forms a subset of the available items, the consideration set (n = 3; Hauser & Wernerfelt Reference Hauser and Wernerfelt1990). In the second step, the agents decide which item to choose from this set by using a lexicographic decision rule akin to the take-the-best heuristic (Gigerenzer & Goldstein Reference Gigerenzer and Goldstein1996). It ranks the attributes according to their validity; the item with the highest value on the most valid attribute is then chosen. In case two or more items have the same value on the first attribute, the second, and then the third attribute, respectively, is examined; if neither discriminates, the agents choose randomly.
Social influence is introduced in both processes but in different steps of the process. In the popularity-set heuristic, social influence is introduced in the first step. The probability that an item is part of the consideration set is proportional to how often the item has been selected by other agents in the past. In the popularity-cue heuristic, social influence enters in the second step as an additional, equally treated, fourth attribute corresponding to how often the item had been selected by others.
In the low-transparency environment, the correlations between quality and the three attributes are weak (0.11, 0.10, 0.10). In the high-transparency environment, the correlations between quality and attributes are strong (0.90, 0.69, 0.61). These environments correspond to the very north and south of the map by Bentley et al. just short of the border. In both scenarios, the inter-correlations between the attributes are held constant at 0.4. [The details of the simulation can be found at:http://www.mehdimoussaid.com/.]
As shown in Figure 1, the popularity-set heuristic generates collective herding, regardless of the environmental features. Here, a feedback loop operates: The more people choose an item, the more this item becomes attractive for subsequent decision-makers. This leads to a few products becoming very popular, while most others are ignored. In contrast, the popularity-cue heuristic generates a homogeneous distribution of popularity, where each item receives a similar, low amount of choices, in high- and low-transparency environments alike. Here, social influence applies to a reduced subset of the items only, which prevents the feedback loop from setting up. These results show that different processes generate strikingly different results in the same environment. Likewise, the same process generates similar results when it is applied to different environments.
The popularity distributions do not simply depend on Bentley et al.’s distinction between low- and high-transparency environments but also on the decision processes (heuristics). Within the same environmental structure (rows), the distributions change with the decision processes. When the same process (heuristic) is applied to different environments (columns), the result can be the same distribution. The outside graphs show the distribution of items’ popularity at the end of the simulation. The popularity of an item is measured as the fraction of agents who have chosen that item. The inner graphs show the popularity reached by each of the 100 items separately, which are ordered according to their quality, from low quality (left) to high quality (right).
The conceptual map by Bentley et al. neatly reduces the environment to two variables. However, whether decisions are arrived at independently or not, and whether the information is transparent or not, is only half of the story. To fully understand what patterns emerge, one needs to account for the decision process. The relevance of such an approach is heightened by the interdependence of the social context where both mind and environment adapt to each other (see, e.g., Artinger & Gigerenzer, in preparation; Moussaïd et al., Reference Moussaïd, Kämmer, Analytis and Neth2013). The advent of big data and the combination of experimental and simulation methods provide ample opportunities to study adaptive decision processes, stepping outside the black box of “as-if” decision theories.