Introduction
Material scientists have long desired to image, with high-spatial and temporal resolutions, material structures, and interactions in chemical, material, and biologic processes, because visual information with sufficient details is vital to discovery as emphasized in many scientific activities.[1] Major research efforts have been made to develop material imaging tools, including various kinds of electron microscopes (EM)[Reference Crewe2] and scanning probe microscopes (SPM).[Reference Salapaka and Salapaka3] The wide use of these microscopes leads naturally to the exponential increase in material imagery data, which in turn calls for efficient and effective analysis methods to extract useful information from the raw images for aiding designs, discoveries, and decision-makings in materials science.
An EM operates with an electron beam, which illuminates materials to create an image of materials. A scanning electron microscope (SEM) creates images based on electrons reflected by material surfaces, whereas a transmission electron microscope (TEM) creates images based on electrons transmitted through material samples. When the electron beam in a TEM rasters across the sample, the resulting technique is called scanning transmission electron microscopy (STEM). Historically, EM techniques were capable of capturing only a static image, because an EM requires samples to be placed in a high-vacuum environment, meaning that the samples are typically frozen or dried before imaging. Recent progress in environmental in situ EM, including liquid phase EM and in situ gas EM, allows direct, high magnification, and real-time imaging of material structures or objects during experiments, capturing their evolution at high-imaging speeds.[Reference Abellan, Mehdi, Parent, Gu, Park, Xu, Zhang, Arslan, Zhang and Wang4–Reference Patterson, Abellan, Denny, Park, Browning, Cohen, Evans and Gianneschi11] By their very nature, these imaging strategies generate material images at a high-frame rate, streaming out a tremendous amount of image data.
An SPM makes use of the dynamic interaction between a cantilever and a material, for inferring the nanoscale surface structure and functionality of the materials. Considerable progress in SPM techniques has been made since early 2000s. In particular, there is a growing trend toward developing multi-frequency SPM techniques that enable simultaneous capture of multiple imaging channels and complex modes of operation.[Reference Jesse and Kalinin12,Reference Rodriguez, Callahan, Kalinin and Proksch13] These new techniques generate a large volume of multi-dimensional data, creating needs for novel image analyses that visualize and convert the raw data to material specific information. Machine learning research for SPM data is reviewed in Kalinin's recent review paper.[Reference Kalinin, Strelcov, Belianinov, Somnath, Vasudevan, Lingerfelt, Archibald, Chen, Proksch, Laanait and Jesse14] This review paper focuses therefore on machine learning and data science research for EM data.
Research needs for machine learning and data science in high-resolution imaging of materials are the topic of increasing discussion in many nation-wide research initiatives and white papers, including the National Nanotechnology Initiative's Signature Initiative[Reference Roco15] and the recent Department of Energy (DOE) workshop report,[1] entitled “Basic Research Needs For Innovation and Discovery of Transformative Experimental Tools,” emphasizing new machine learning and data science methods to triage, accelerate, and scale up the analysis of image data to provide real-time feedback to materials science researchers. Material image data are of large volumes because of the high-frame rates and high-spatial resolutions required to capture interesting phenomena, as explained above. There is also an increasing desire to search image data with great attention to find the right kind of details, because materials frequently embed complicated structural features that may not be obvious in a plain view. There are unresolved issues in almost every facet of the material image processing problems, ranging from data storage and communication to analysis and decision making.
Manual analysis of high-resolution image data is definitely inefficient and may no longer be feasible in the era of big data. The manual task could take months of dedicated work by an expert just for a partial analysis. The fast arrival of large volumes of material image data creates a major bottleneck in advancing fundamental materials science, in spite of the fact that the innovation in imaging techniques is an enabler in the first place leading to new material discoveries. What this means is that in addition to the development of image acquisition techniques and instruments, we are in pressing needs of better and capable image data analysis methods to convert the massive amounts of raw data into useful information that is directly or substantively linked to fundamental chemical and physical mechanisms of material formation and dynamics.
Motivated by the emerging needs, this paper reviews recent research efforts that aim at automating material image analysis. Our review is organized based on different perspectives of visual information relevant to materials research, including morphology, location, dispersion, and spatial arrangements of materials, and dynamic material evolutions. We also discuss ongoing efforts and future research needs, following the review.
Morphology analysis
Many materials science problems are centered around understanding the relationship between material structures and properties or functionalities. Material structures are often imaged and characterized using microscopy techniques, and are described by the outlines of material interior and exterior structures as well as the geometric features of these outlines, such as sizes, shapes and topology. We call the problem of extracting the outlines from material images and quantifying their geometric features as morphology analysis. We discuss the state-of-the-art in morphology analysis for two-dimensional (2d) microscopic images and extend the discussion to the three-dimensional (3d) images in the last paragraph of this section.
The most challenging part in morphology analysis is to extract the outlines of the material structures. The task is difficult due to many complicating factors, including but not limited to, the high image noises, low image contrasts, and uneven background illumination. Many practitioners attempted to apply simple edge detection algorithms such as Canny's edge detector[Reference Canny16] that locates the “edge pixels” or the intensity jump pixels around the interfacial areas between different materials. For micrographs of low contrast, however, “true” edge pixels and the intensity jumps become almost indiscernible due to background noises, and consequently, the edge detector produces fragmented edges, mixed with noise pixels. Combining the fragmented edge pixels into holistic outlines is not straightforward.
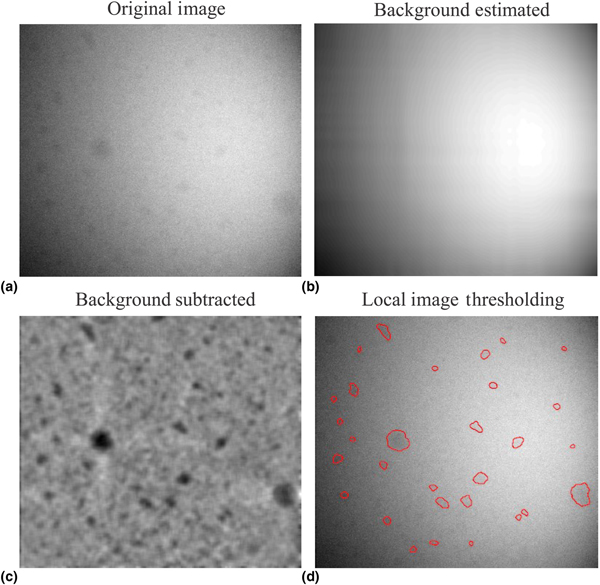
When the outlines of the materials imaged do not overlap, a good alternative is to denoise and binarize an image to its background and foreground—foreground corresponding to materials—and then extract the outlines of the foreground, as illustrated in Fig. 1. This approach is referred to as image binarization. The simplest approach for image binarization is a global image thresholding that compares image pixel intensities with a chosen threshold; a popular algorithm which most commercial or open source software implements is the Otsu image thresholding.[Reference Otsu17] However, the algorithm does not work well for many micrographs, particularly when the background intensity of a micrograph changes in space due to focused beam radiation or transitions between different background materials, to which local thresholds need to be applied.[Reference Jiang and Mojon18] Local thresholding is to estimate the background of an image, subtract the background from the image, and then apply a global threshold on the subtracted image (i.e., the residual image); the steps and intermediate results are illustrated in Figs. 1(b)–1(d). Vo and Park[Reference Vo and Park19] provide a comprehensive summary of image binarization approaches and propose an effective background estimation method, enabling local thresholds to be constructed for a robust binarization of material images.
Image binarization to extract the outlines of nanocrystals: (a) original image, (b) background image estimated, (c) image after the background subtraction, and (d) outlines extracted by local image thresholding.

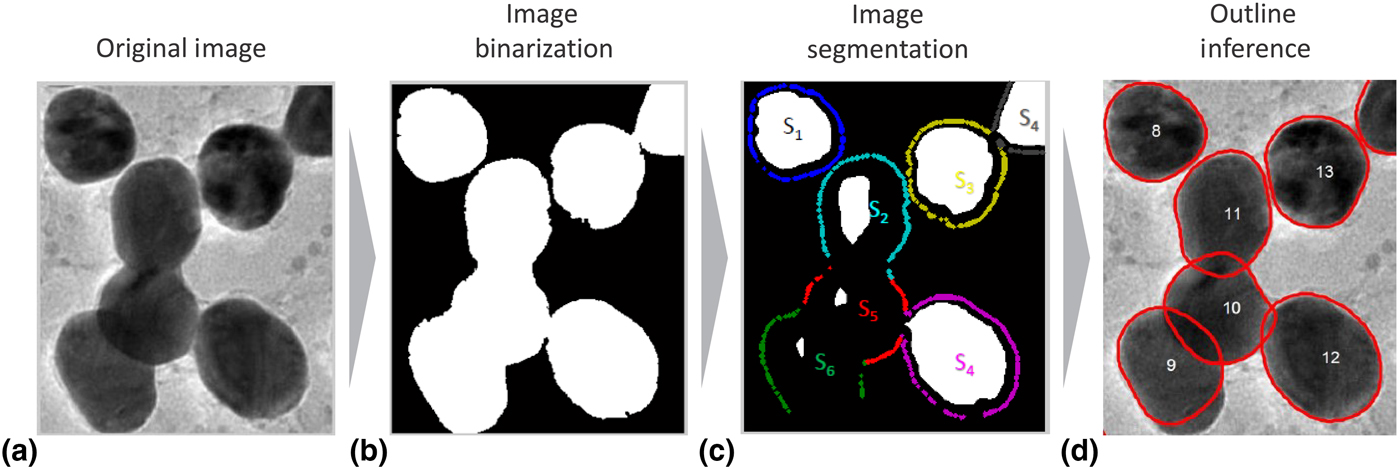
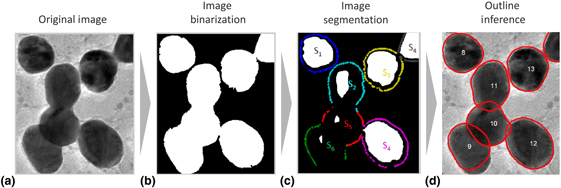
When materials are overly crowded in a sample and their images in a micrograph partially overlap, a simple binarization of the micrograph gives only the outlines of the overlapped materials instead of individual outlines. More sophisticated image analysis methods are needed to recover the outlines of individual material objects or structures buried in the overlaps. Park et al.[Reference Park, Huang, Huitink, Kundu, Mallick, Liang and Ding20,Reference Park, Huang, Ji and Ding21] framed three necessary analysis steps for extracting the individual outlines. The first is to segment the binarization outcome into the images of individual material objects. In computer vision, such separation step is called image segmentation.[Reference Beucher and Meyer22] The segmentation by itself does not yield the complete outlines of individual material objects, because the outlines are partially occluded due to the overlapping, and as such, the segmentation outcomes are incomplete outlines as illustrated in Fig. 2(c). The missing parts of the outlines must be inferred and recovered; this step is referred to as outline inference and illustrated in Fig. 2(d). The inference can exploit prior knowledge of material structures to fill in the blanks. For example, in particle analysis, when nanoparticle shapes are circular or elliptical, the prior shape information is used to formulate the segmentation and outline inference problem.[Reference Qian, Huang, Li and Ding23,Reference Zafari, Eerola, Sampo, Kälviäinen and Haario24] When the prior knowledge is unavailable, material structure information of the well-isolated material structures in the same sample can be exploited for inference. For doing so, statistical modeling is needed to encode the structural information, which includes defining the metric and probability space of shapes or structures and formulating the statistical inference problems on the shape space. Park et al.[Reference Park, Huang, Ji and Ding21] used a curve, parameterized by multivariate parameters, to represent a shape. A Gaussian mixture distribution was imposed on the parameters to represent multiple different shapes of materials and their variations. The modeling was combined with the outline inference step, which was iteratively solved by an expectation-conditional-maximization algorithm.[Reference Meng and Rubin25] For very noisy images taken from solid samples, complementary imagery information such as both intensity and gradient must be used together to achieve a more practical segmentation and shape identification.[Reference Qian, Huang, Li and Ding23] Nevertheless, the current approaches tend to use a curve representation of material outlines, which may not apply to the outlines of materials having complex geometries and topology. A general shape space needs to be defined. This calls for new research ideas and approaches in modern shape data analysis and topological data analysis.[Reference Bubenik26] A Bayesian object identification[Reference Konomi, Dhavala, Huang, Kundu, Huitink, Liang, Ding and Mallick27] can presumably handle complex shapes from a library of prescribed shapes, but faster Bayesian solution algorithms need further attention and research.
(a) Three steps for morphology analysis; (b) the original image is binarized for the binary image of partially overlapping materials in the image; (c) the binary image is segmented into individual foreground images; and (d) the occlusions due to overlaps are estimated and filled for complete outlines. *Reprinted with permission from Park et al.Reference Park, Huang, Ji and Ding21

All the aforementioned morphology analysis methods have been mainly devised for extracting and analyzing the outlines of material objects in 2d microscopic images, for the understandable reasons that the majority of material imaging instruments are still 2d microscopy techniques. Although 3d electron tomography does exist and is gaining popularity,[Reference Frank28] electron tomography comes with many more unresolved technical issues; a case in point is the well-known missing wedge problem due to the limited tilt angle series of sinograms.[Reference Mu and Park29] Morphology analysis in 3d would involve similar analysis steps, outlined above for the same analysis in 2d,[Reference Park, Huang, Ji and Ding21] but each step is much more complicated due to the complexity in the representation of 3d structures. The aforementioned 2d morphology analysis methods are by and large based on a curve representation of material boundary, which is ineffective in representing 3d morphologies. Should the same 2d models be used for 3d objects, a much greater degree of freedom would have to be used, but then, the models would become too complex to be practical. Furthermore, many 3d morphologies come with intrinsic topologies with interior holes, which cannot be represented adequately by commonly used 2d surface or shape models. The lack of effective representation of shapes and topologies in 3d is still a big hurdle to having effective 3d morphology analyses.
Location, dispersion, and lattice analysis
Beyond morphology, studies on the spatial positioning and arrangements of smaller scale elements within bulk scale materials are of great interest to material scientists because analysis of such arrangements could yield insights concerning functionalities of materials. For example, crystallographic studies at atomic length scales locate individual atoms and identify symmetries, dislocations, and defects in their locations. Quantification of these material features allows material scientists to map material performance as a function of measurable parameters such as distance or energy, which can be extracted directly from microscopic data.[Reference Li, Belianinov, Dyck, Jesse and Park30] Another example is the composite matrix mixed with nanoparticles. Properties of a composite, such as its strength, conductivity, or transparency, can be remarkably enhanced by blending nanoparticles into the polymer host materials, but the result of the enhancement is inevitably dependent on the dispersion and distribution of nanoparticles within the host materials.[Reference Dong, Li, Qian, Yu, Zhang, Zhang and Ding31] Here we summarize the state-of-the-art machine learning and data science approaches developed in these two specific contexts.
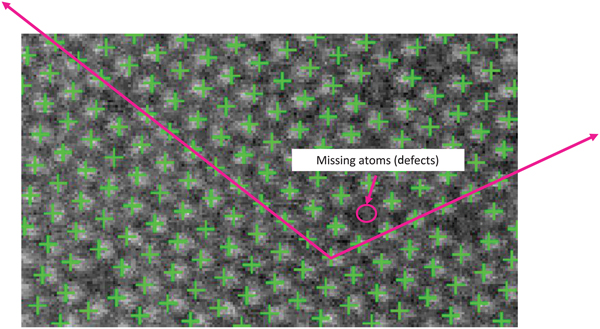
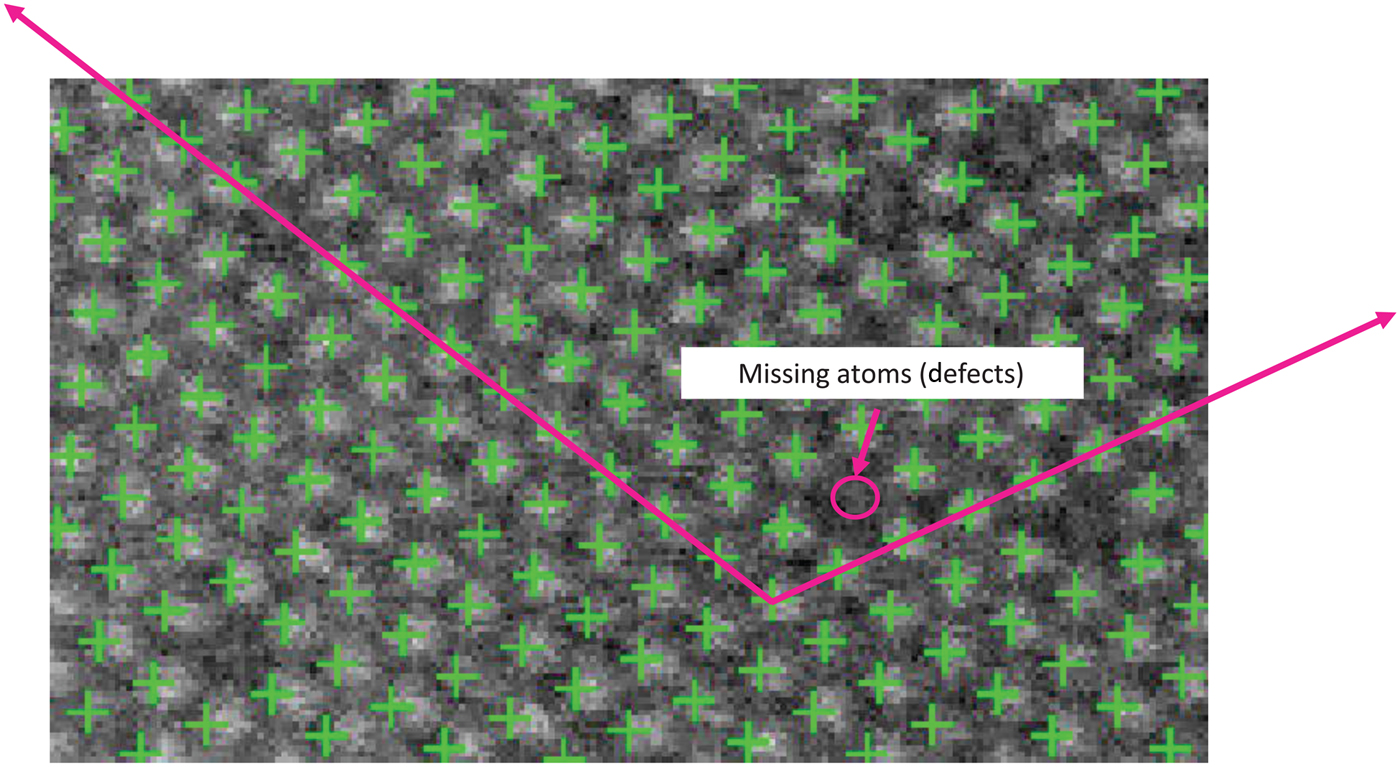
The progress in high-resolution, real space imaging techniques has allowed 10 pm or better precision in the measurements of atomic positions. The amazing technology opens new scientific discovery for correlating the lattice structures of atoms and the lengths and angles of bonds to the functionalities of materials.[Reference Belianinov, He, Kravchenko, Jesse, Borisevich and Kalinin32] Typical image analysis for such scientific research comes in two stages, i.e., locating individual atom locations and identifying local and global symmetries, or deviation from symmetries, i.e., defects in locations. The first stage of the analysis without any local or global symmetry references is a general spot detection problem. Although spot detection algorithms exist, such as Laplacian of Gaussian filters,[Reference Bright and Steel33–Reference Hughes, Fricks and Hancock35] employing them to locate atoms is a non-trivial matter because those contrast-based algorithms are prone to errors, particularly for low-contrast images (which is common in material imagery). Once all atom locations are identified, location symmetries or the lack thereof (defects) are characterized by analyzing the spatial arrangement of the atom locations. The case for all atoms being homogeneous and aligned to a global lattice with hardly any defects has been extensively studied, and such structure can be described by a global descriptor, i.e., the basis vectors of the global lattice, as illustrated in Fig. 3. When materials are composing of multiple heterogeneous atoms and multiple local lattice structures, the global descriptor is insufficient to describe the material structure. Consequently, multiple local descriptors are needed to describe such multiphase materials. Currently, there is no well accepted approach to describe such varying, heterogeneous local structures. Some papers analyze the spatial arrangements of the nearest neighboring atoms using distance matrices and the corresponding principal components.[Reference Belianinov, He, Kravchenko, Jesse, Borisevich and Kalinin32,Reference Laanait, Ziatdinov, He and Borisevich36] A principal score is assigned to each atom and visualized for finding the boundaries among different phases. More recent research tries to solve the two-stage problem (identification and characterization) simultaneously, instead of doing so separately and sequentially.[Reference Li, Belianinov, Dyck, Jesse and Park30] Intuitively, the outcome from one stage could help improve the accuracy of analysis at the other stage. For instance, knowing the local and global symmetric patterns of atoms definitely helps improve the accuracy of identifying individual atom locations in the low-contrast images, because the symmetry information can be used as a reference to hint on potential atom locations.
Symmetries and defects of atom locations. The crosses point individual atom locations, and two arrow lines represent the basis vectors of a global lattice. *Figure from Li et al.Reference Li, Belianinov, Dyck, Jesse and Park30
Analyzing the mixing states of nanoparticles in a composite material is of great interest due to the relationship between the mixing states and the resulting material functionalities. The mixing states are described using the metrics known as dispersion and distribution. Dispersion refers to the degree of nanoparticles being separated instead of aggregating, whereas distribution refers to the degree of nanoparticles being located uniformly throughout the host composite material. The characterization of the mixing states of a composite mixture was performed by taking and analyzing the electron microscopic image of the composite mixture. When nanoparticles are well dispersed in a composite, the centroids of individual nanoparticles can be extracted, and the distribution of the centroids is used to quantify the distribution of nanoparticles. The Ripley's K function[Reference Ripley37] is a spatial statistic that quantifies the homogeneity of spatial point distribution, which was applied to the centroid locations for characterizing the distribution of nanoparticles.[Reference Li, Zhang, Jin, Huang, Qi, Zhang and Yu38] Direct application of the spatial statistics such as the Ripley's K function loses its effectiveness when nanoparticles aggregate severely, forming large agglomerates in a composite. The spatial statistical approaches treat each material object as a dimensionless dot in the space. In doing so, the approach counts an agglomerate of multiple particles as a single particle, losing the information of the individual particles. One can certainly discretize each agglomerate with patches of smaller sizes that are comparable with that of individual particles, and then apply the Ripley's K function to the centroids of patches. A great care[Reference Dong, Li, Qian, Yu, Zhang, Zhang and Ding31] must be taken to adjust the normalizing constant used in the Ripley's K function or other similar spatial statistics metrics; otherwise, the resulting analysis could lead to erroneous orders while ranking and selecting the material samples with the best mixing state.
Dynamic material evolution
Many material and biologic processes take place in a liquid or gas environment, where the final process outcome is the result of a complicated transient process in which the material objects evolve from its initial state to the equilibrium state. Understanding and subsequently controlling the final process outcome require a capability of directly observing the kinetics of the transient processes as they are happening. Recent advances in in situ and operando electron microscopy allow atomic resolution imaging of the transient processes with high temporal resolutions, promising to expand the frontiers of our understanding in material and biologic science.[Reference De Jonge and Ross39–Reference Zheng, Meng and Zhu41] One example is the bottom up colloidal self-assembly process in which nanoparticles are organized into ordered structures.[Reference Grzelczak, Vermant, Furst and Liz-Marzán42] In situ microscopes take motion pictures of the nanoparticles as they are nucleating, aggregating, and morphing into different sizes and shapes. Another example is in cell biology. Microtubules are the main organizational system in cells, responsible for cell shape, intracellular transport, and cell division.[Reference Mikhailov and Gundersen43] One of the mysteries of cell biology is the basic set of properties involved in the seeding and growth of microtubules and the processes underpinning how the systems are initiated.[Reference Bergen and Borisy44] In situ microscopes make it possible for scientists to directly image the underlying dynamic processes for their fundamental science studies.
By their very nature, the in situ imaging techniques produce images at a high-frame rate, streaming out a tremendous amount of image frames. This is not surprising, as phenomena occurring at a very small length scale also tend to operate on a short time scale; for instance, the nanometer scale transient behavior typically occurs in the scale of microseconds (10−6 s) to milliseconds (10−3 s). A single output image from an EM may have 2000 × 2000 image pixels, which amounts to 16 MB with 4 bytes per pixel. If the imaging rate is microseconds, the amount of image data being generated would be 16 TB (=16 MB × million images) per second, or petabytes (1015 bytes) per hour.
Analysis of dynamic images is at the frontier of material image analysis because of the relatively recent availability of the in situ instruments. Unsurprisingly, much fewer research studies have been reported on this topic.[Reference Park45–Reference Qian, Huang and Ding49] It is an area for which data science and machine learning can make greater impacts, as the sheer amount of the data and the speed of its arrival make the manual analysis entirely out of the question.[Reference Zheng, Smith, Jun, Kisielowski, Dahmen and Alivisatos50] The existing literature can be grouped into two categories: distribution tracking versus object tracking, depending on whether the interest is to track individual material objects and/or whether the material objects are traceable.
In some applications, the material objects may not be easily traceable. For example, in liquid phase EM experiments with a flow-through setup, samples of materials are continuously pumped into a TEM using microfluidics to flow through the imaging area, so that material samples observed at different times are different materials. Tracking individual material objects is thus infeasible. In some other applications, material scientists may care more about the collective change of material samples rather than the changes in individual objects. Under these circumstances, the collective behavior, or the growth trajectory of the group, can be represented using a probability density distribution. The dynamics to be tracked is the temporal evolution of a time-varying probability density distribution. We refer to this approach as distribution tracking.[Reference Park45,Reference Park and Shrivastava46,Reference Qian, Huang, Park and Ding48,Reference Qian, Huang and Ding49]
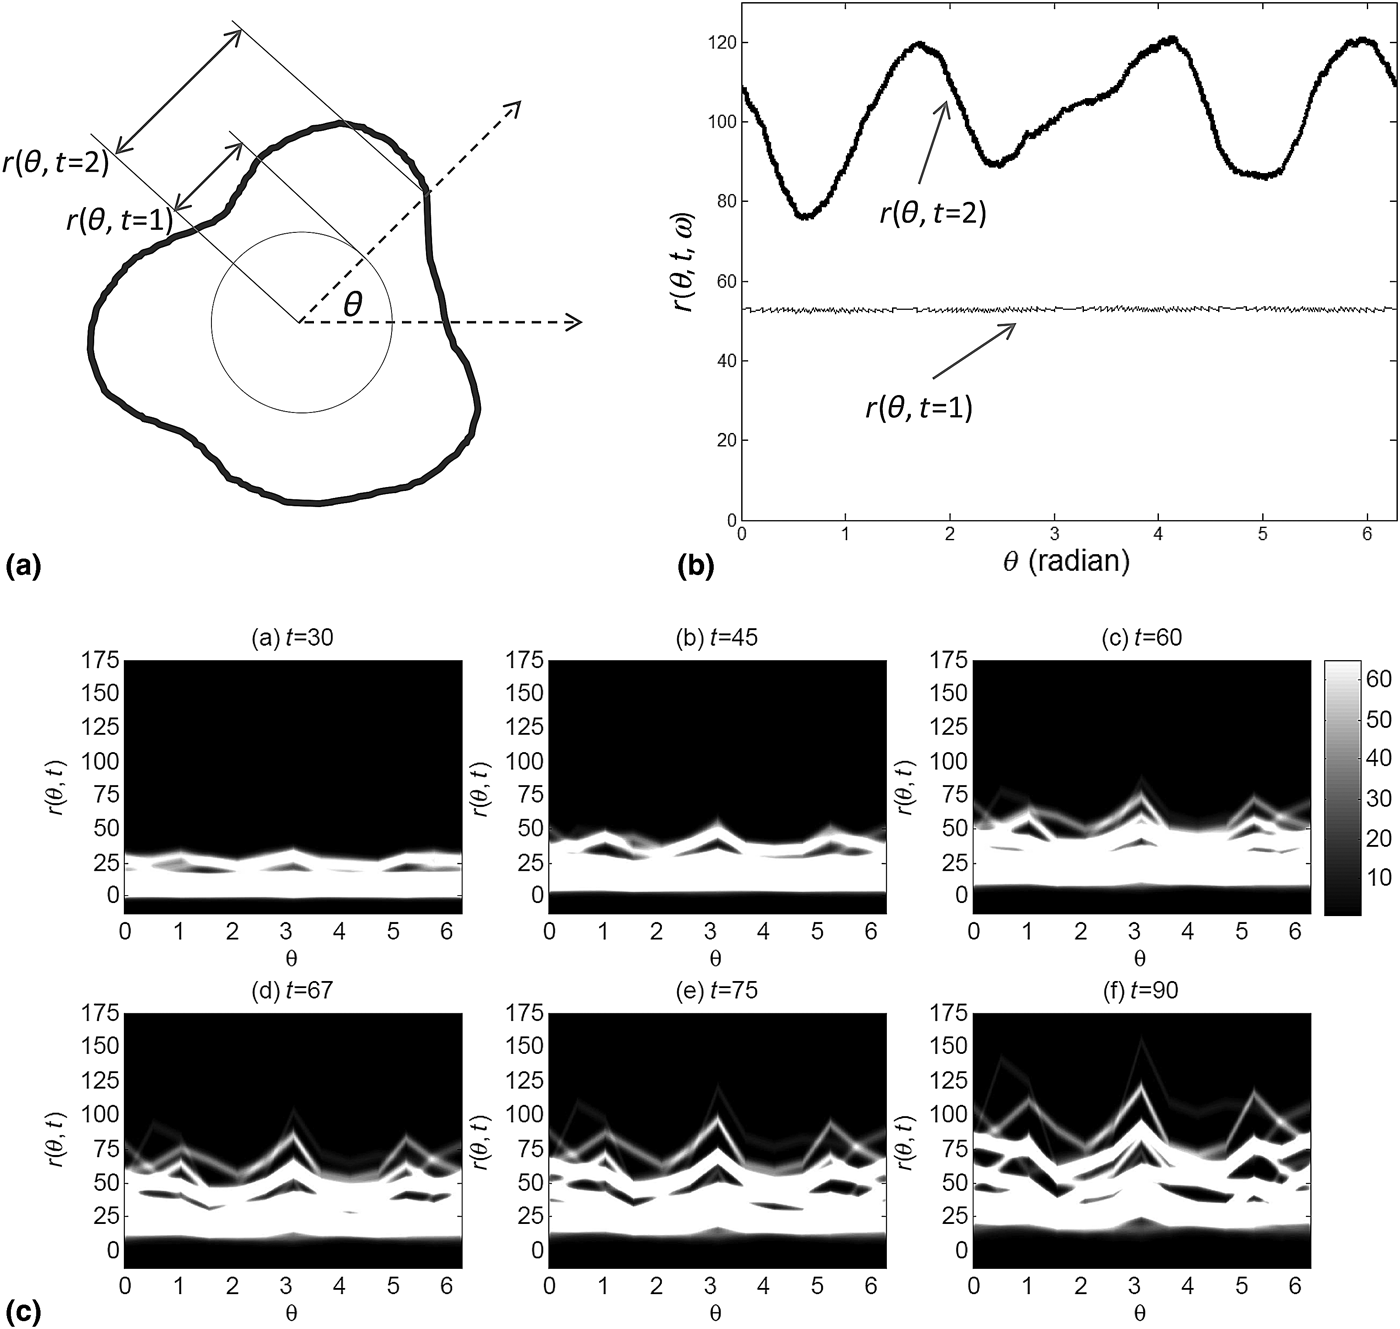
From the image analysis perspective, distribution tracking comes in two steps. The first step is to extract the outlines of material objects using the morphology analysis described in an earlier section of this paper, and the second step is to fit a probability distribution function or a probability density function to the characteristics of interest, e.g., size or shape. The major analytical challenge is in this second step, which is concerned with how the corresponding distribution function and its dynamics are modeled. One of the pioneering studies for modeling the evolution of structures was the introduction of the outline expansion model that explains the growth of material structures in time.[Reference Park45,Reference Park and Shrivastava46] As illustrated in Fig. 4, a material structure is described by its exterior outline [Fig. 4(a)] or a curve representation [Fig. 4(b)]. The distribution of material structures is modeled as the variation of curves [Fig. 4(c)], which is represented by a nonparametric distribution of curves. Accordingly, the distributional change due to the growth of material structures is modeled as the time-varying coefficients in a nonparametric probability distribution. Related statistical inference and hypothesis testing procedures on the new model are also developed.[Reference Park and Shrivastava46] Dynamic material imaging calls for sophisticated development in an important data science branch, i.e., the nonparametric modeling of time-varying probability density functions, which is relatively underdevelopment,[Reference Rodriguez and Ter Horst51,Reference Mena and Ruggiero52] due to both its challenging nature and the lack of real applications in the past.
Analysis for shape and size evolution of an ensemble of nanoparticles: (a) an outline of material structures in 2d, (b) a curve representation of the outlines, and (c) the variation of material structures represented in terms of the variations of curves and the variations evolve in time. *Reprinted with permission from Park.Reference Park45

The generality of the outline expansion model[Reference Park45] comes with computationally expensive statistical inference steps. These computational issues have been addressed by adopting a new distribution representation.[Reference Qian, Huang, Park and Ding48,Reference Qian, Huang and Ding49] In the new approach, the probability distribution is represented using a spline model, and the distributional changes were represented by the time-varying coefficients of the spline model. Estimating the spline model is much more computationally feasible, so that the resulting approach can be applied to larger datasets. The approach is employed to handle both retrospective and prospective analysis. The retrospective analysis[Reference Qian, Huang and Ding49] centers on off-line EM video data, to signal possible change points delineating the stages of growth; doing so produces strong clues about where to concentrate one's effort to understand the highly stochastic material evolving processes and enable discovery of the unexpected. The prospective analysis[Reference Qian, Huang, Park and Ding48] is the real-time tracking, i.e., developing a dynamic and forward-looking model that can track the growth trajectory of a material characteristic, anticipate an upcoming change, and allow the design of specific interventions, to steer the course of a material evolution toward the desired target through the “on the fly” changes of process variables. Both the nonparametric approach[Reference Park45,Reference Park and Shrivastava46] and spline approach[Reference Qian, Huang, Park and Ding48,Reference Qian, Huang and Ding49] have their respective limitations. The spline approach may not be extendable to a high-dimensional representation of material structures. The nonparametric approach is more general but only applicable when the material structures can be abstracted by their exterior outlines. Future research on modern shape modeling and topological analysis is needed to extend the applicability of the existing studies to more complex material structures.
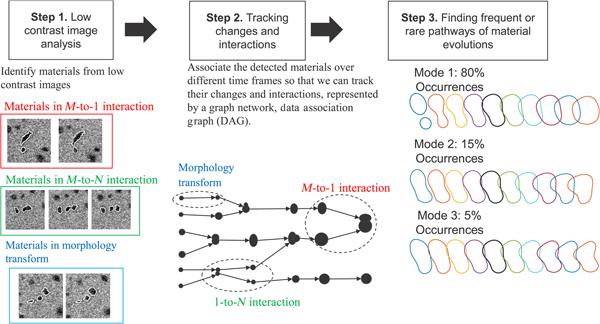
Unlike in distribution tracking, the approach of object tracking is to specifically track individual material objects or structures over different image frames. Object tracking can be further classified into single-target tracking analysis and multi-target tracking analysis, depending on the number of material structures being tracked. Single-target tracking analysis is interested in how a single material object or structure evolves through interactions with chemical or biologic environment,[Reference Zheng, Smith, Jun, Kisielowski, Dahmen and Alivisatos50] whereas multi-target tracking analysis is more interested in how material structures or objects evolve through mutual interactions among themselves as well as interactions with the external environment. Object tracking analysis requires one more step in addition to the morphology analysis of individual images. Once the morphology of materials is extracted from individual image frames (Fig. 5, step 1), it is associated with the same morphology over different image frames in order to form the trajectories of a material change (Fig. 5, step 2). For the single-target tracking analysis, the existing approaches in computer vision can be employed to extract the trajectory of a single material and its structure.[Reference Jiang, Fels and Little53–Reference Pirsiavash, Ramanan and Fowlkes55] The existing approaches, however, are ineffective for the purpose of multi-target tracking analysis, because most of them are based on the assumption that there is no interaction among the objects being tracked. To material scientists, tracking mutual interactions among materials is of crucial importance. Only a few papers address the problem of tracking object interactions and do so to a limited degree, e.g., split and merge of two objects.[Reference Jaqaman, Loerke, Mettlen, Kuwata, Grinstein, Schmid and Danuser56,Reference Henriques, Caseiro and Batista57]
Three steps in multi-target tracking analysis of material evolutions and interactions. Step 1 detects individual material objects or structures in noisy images. Step 2 associates the detections from different image frames with each other for estimating the trajectories of material evolutions and interactions. Step 3 finds frequent and rare patterns in the trajectories.
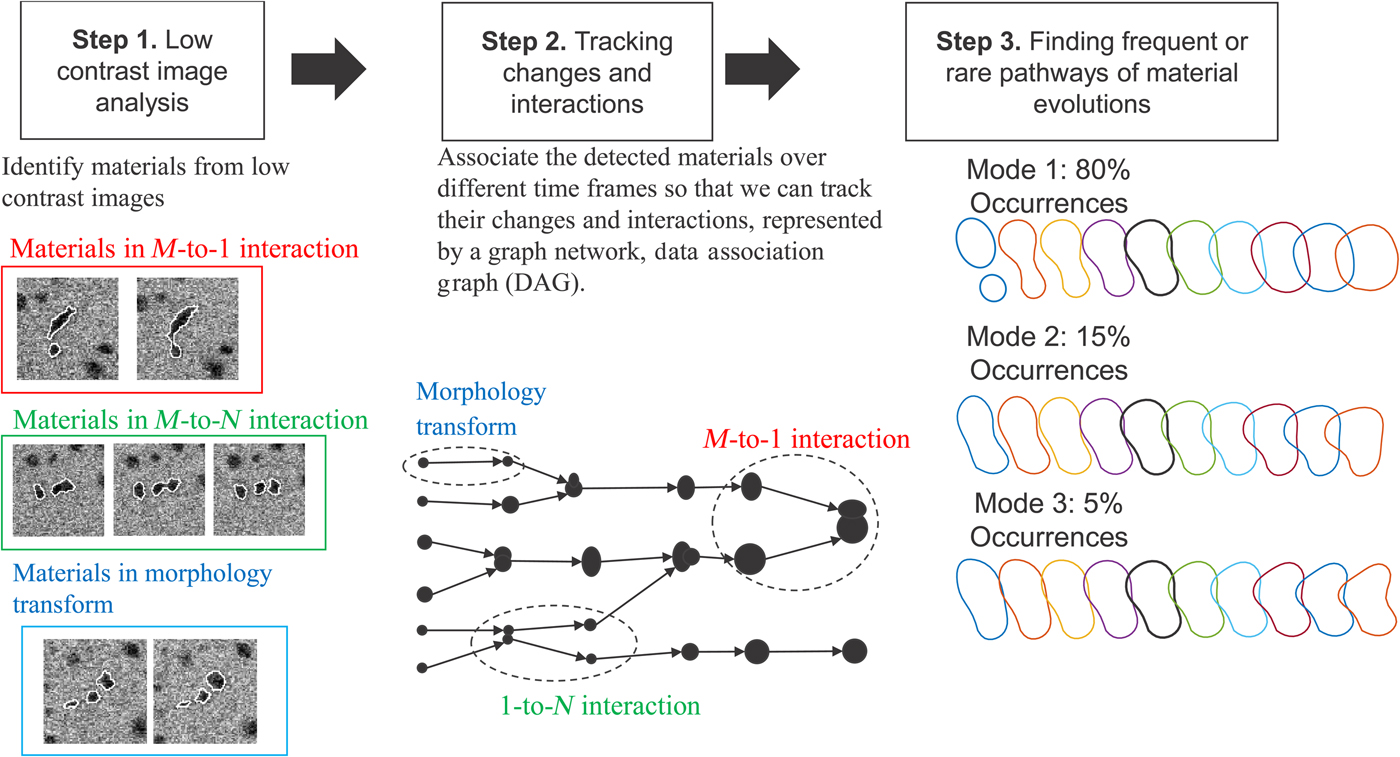
A novel recent research is proposed for tracking complex interactions,[Reference Park, Woehl, Evans and Browning47] which is to formulate a multi-way data association problem that combines individual morphology data into trajectories of materials and material interactions, and encodes the interactions as a graph topology. Through the association, many imagery artifacts in the morphology data are filtered out, and miss-detected morphology is recovered, which ensures a better accuracy in tracking outcomes. Tracking the dynamic evolution of materials and material interactions would produce many material evolution trajectories in terms of changes in shape or structure. The number would be too numerous for manual scanning to pinpoint important findings. Statistical methods that are capable of summarizing numerous shape trajectories into a few frequent or rare trajectories are needed. Such methods, if developed, could significantly expedite the analysis of raw data and hypothesizing of the frequent and rare patterns (Fig. 5, step 3). Combining the tracking analysis and the subsequent pattern discovery would provide the kinetic rates of different material interactions and relate them to the overall material changes. The new multi-target tracking analysis has been successfully applied to many materials science problems, including nanocrystal growth,[Reference Woehl, Park, Evans, Arslan, Ristenpart and Browning10,Reference Welch, Woehl, Park, Faller, Evans and Browning58,Reference Esmaieeli Sikaroudi, Welch, Woehl, Faller, Evans, Browning and Park59] operando analysis of the next generation battery system,[Reference Abellan, Mehdi, Parent, Gu, Park, Xu, Zhang, Arslan, Zhang and Wang4,Reference Mehdi, Qian, Nasybulin, Park, Welch, Faller, Mehta, Henderson, Xu and Wang60] formation of metal organic frameworks,[Reference Patterson, Abellan, Denny, Park, Browning, Cohen, Evans and Gianneschi11] and micelle evolutions.[Reference Touve, Figg, Wright, Park, Cantlon, Sumerlin and Gianneschi61]
Compressive sensing and adaptive imaging
Machine learning and data science play an important role in improving the spatial or temporal resolutions of material imaging instruments through either optimization for higher resolutions or fusion of complementary data sources of different resolutions or those from instruments working at different scales.
One case in point is that the temporal resolution of STEM imaging is improved based on the compressive and adaptive sensing techniques. Compressive imaging or image subsampling is a novel approach in image acquisition. Its goal is to minimize the number of measurements needed to reconstruct an image with a prescribed accuracy. Compressive imaging is based on the principle of “sparsity,” i.e., representing an image by using much fewer (i.e., sparser) bases in a proper basis set. In electron microscopy, compressive imaging has been applied to STEM imaging for reducing electron doses while imaging beam-sensitive materials such as organic and porous materials[Reference Stevens, Luzi, Yang, Kovarik, Mehdi, Liyu, Gehm and Browning62] and for accelerating the imaging speed when encountering a fast changing material process.[Reference Kovarik, Stevens, Liyu and Browning63,Reference Stevens, Kovarik, Abellan, Yuan, Carin and Browning64] All existing approaches are based on random selection of measurement locations followed by an image in-painting reconstruction of the random measurements. The approaches are rather successful in terms of reconstructing atomic resolution images, partially for the reason that atom locations are sparse and well aligned to regular lattice coordinates, so that the sparsity and repeated patterns of the signals form an ideal condition for which the sparse random sampling works out greatly. However, when such a random and sparse sampling mechanism was applied to other electron microscopic imaging, the resulting reconstruction could lose sharp details over the interfacial areas of different materials, creating intolerable image blurriness. In those cases, it would be better to adaptively select measurement locations to improve the resulting image reconstruction.
In machine learning, a general approach for measurement selection to improve the accuracy of learning is called active learning,[Reference Castro, Haupt and Nowak65] also known as adaptive sampling or sequential experimental designs in engineering.[Reference Edgeworth and Wilhelm66] The overall approach for active learning is a multi-stage approach that iterates measurement taking and image reconstruction over time, making use of the image reconstructed during the past steps to guide the measurement taking process for the next step.[Reference Park and Qiu67] A major challenge in applying the active learning strategy in electron microscopy is caused by the repeated image reconstruction steps across numerous stages. Each image reconstruction could be computationally intensive and slow. Unsurprisingly, the repeated reconstructions slow down substantially the whole imaging process, which may cancel out the main advantage of using compressive imaging. Fast image construction with sparse samples should be developed before analysts can make full use of compressive sensing.
Closing remark and discussions
Material imaging is one of the major experimental tools enabling new material designs and discoveries. Different from other forms of data obtained by their respective characterization instruments, material image data is large in volume, contains complex data patterns in 2d and 3d, and starts to arrive in an overwhelming speed. The sheer volume and intrinsic complexity associated with material image data make material imaging a perfect big data candidate, calling for sophisticated data science and machine learning methodology development, so that the technology innovation in imaging instruments can be fully taken advantage of.
As reviewed and summarized in the paper, the recent developments have made remarkable inroad toward making material imaging methods automated, efficient, and potentially compatible with scaled-up production, especially in the following aspects: material morphology analysis, finding spatial symmetries and boundaries of materials, tracking dynamic material evolutions and interactions for material discovery, and improving temporal and spatial resolutions of imaging. These capabilities have already shown proven impacts on materials research, providing material characterization and information from otherwise unanalyzable sizes of scientific image data.
We would like to stress that all these efforts are the starting point in addressing the continuing challenges and practical needs in material image analysis. We summarize several ongoing research issues, based on our experience and interactions with domain experts, in the following aspects:
• On-the-fly data reduction or compressive sensing. The current practice of analyzing scientific imaging data first stores the data at a local data storage site and then performs subsequent analysis. This standard technique is time consuming, mainly due to slow disk writing and data communication speed. For example, the state-of-the-art in disk I/O interface has a writing speed of several GBs per second. This means that it would take 4000 s, or about 1 h, to write into storage the 4 TB in situ electron microscopic data, which could have been generated for a single second of a nanometer scale process; or equivalently, it would take 3600 h (150 days) to write the whole data set generated for an hour of the same process. Due to the slow disk I/O speed, in relative to the much faster data generation rate, data reduction on-the-fly during imaging is highly desirable and necessary.
• Enhancement of computational efficiency. This is a fundamental problem applicable to almost every aspect of material image analysis. With the increasing number of material objects or structures and the increasing complexity associated with each of them, making the models/algorithms run fast is not a trivial undertaking. Yet, a fast algorithm is absolutely essential leading to practical adoption of both offline and online methods. The online need is self-evident, as the time pressure is dictated by the process dynamics. Even for offline analysis, analysts or scientists are unlikely to adopt an algorithm that takes too long to produce an outcome. The current state-of-the-art in image binarization and segmentation for morphology analysis takes a few seconds to minutes to analyze a typical SEM or TEM image, and the tracking analysis could take a longer time; all these are much slower than the image generation speed. Without cutting the analysis time close to the image generation speed, data storage could quickly explode with a large amount of unanalyzed images. To accelerate the analysis to the order of milliseconds or microseconds, at par with the image generation speed, a combination of new algorithmic developments and new hardware acceleration of the algorithms appears to be inevitable.
• From 2d to 3d. We anticipate that the main focus in material imaging would soon shift from 2d imaging toward 3d imaging and even from 3d imaging to 4d imaging (3d spatial dimensions plus a temporal dimension).[Reference Zewail and Thomas68] The machine learning and data science approaches reviewed earlier serve as a good starting point to automate the data analysis for 3d imaging, but future research must follow to handle the ever-increasing volume and complexity. One foundational problem is the effective shape and topology representations of material structures in 3d. Most of the current shape data analyses are focused on planar shapes in 2d, often modeled with various kinds of curve representations. This type of models cannot describe complex material structures and topology in 3d. Mesh-based approaches in computational geometry is a natural extension of the curve representation to 3d structures and could be potentially useful for constructing a new shape space in 3d, but developing the notions of invariances and similarity metrics as well as the corresponding statistical estimation in the new space is rather difficult. Moreover, the mesh approaches may not be efficient, because they require a large degree of freedom to represent a geometry in 3d, creating a high-dimensional feature space, hard to handle in modeling and solution steps. Proper dimension reduction and feature extraction are necessary.
• Super-resolution. Related to the discussion in the section of adaptive sampling, an image processing technique, known as super-resolution, is being introduced to material image processing.[Reference Sreehari, Venkatakrishnan, Bouman, Simmons, Drummy and Bouman69] The general concept of super-resolution refers to the class of methods that enhance the resolution of an imaging system, but here we refer more specifically to the enhancements resulting from the algorithmic or image processing aspect. For material imaging problems, with the presence of multi-resolution electron microscopic images, it saves a lot of time and efforts if one can boost the quality of images taken by a low-resolution microscope through the use of a small fraction of high-resolution data. This problem is apparently connected with a set of statistical learning problems, originated in the field of computer experiments, in which physical experiment data and computer simulation data, or data coming from multi-fidelity computer models, are combined for making better predictions or inference at settings or conditions where the high-fidelity or high-quality response data are not available.[Reference Xia, Ding and Mallick70–Reference Pourhabib, Huang, Wang, Zhang, Wang and Ding72] Making intelligent use of multi-resolution data sources for achieving the super-resolution objective may help address some of the efficiency and complexity issues raised above.
• Process and quality control. The availability of in situ electron microscopy gives the hopes to real-time process control. The goal of process control is to take process variable conditions as inputs, builds predictive models connecting the controllable settings in a material exploration process or in a manufacturing process to the intermediate, as well as the final, quality characteristics, and recommends appropriate process adjustments needed for achieving the quality control targets. The dynamic imaging models, especially the real-time tracking and updating capabilities as discussed in the paper, lay the critical corner stone for realizing the process control objective. But in order to fully materialize process control, there are still plenty of questions left unanswered, including the predictability and controllability of underlying material processes and the stability and robustness of the control.
Acknowledgments
We acknowledge support for this work from the AFOSR (FA9550-18-1-0144) and the Oak Ridge National Lab (4000152630).