Sweet potato (Ipomoea batatas L.) is one of the most productive and widely grown food crops around the world. According to FAOSTAT (2023), approximately 7.4 million hectares were harvested in 2021, yielding about 88.9 million tonnes of tubers. In Taiwan, sweet potato is the most important root crop, grown on 10,000 hectares annually over the past decade. It is consumed directly, processed into food products, or used for leafy greens. The tuber is rich in starch, fat, protein, vitamin C, β-carotene, dietary fibre, minerals and antioxidants (Teow et al., Reference Teow, Truong, McFeeters, Thompson, Pecota and Yencho2007). Its composition varies with flesh colour: orange-fleshed varieties are high in carotenoids purple-fleshed in anthocyanins, while the yellow-fleshed cultivar Tai-Nong No. 57 (TN57), which is commonly cultivated in Taiwan, is characterised by its sweetness, high carbohydrate and fibre content, and considerable levels of vitamins A and C. In recent years, increasing attention has been given to the diversification and value-added processing of sweet potato products in Taiwan.
Yoghurt is one of the most widely consumed fermented dairy products worldwide, appreciated for its distinctive flavour, smooth texture and recognised health-promoting effects (Hekmat et al., Reference Hekmat, Soltani and Reid2009; Li et al., Reference Li, Ye and Singh2021; Arab et al., Reference Arab, Yousefi, Khanniri, Azari, Ghasemzadeh–Mohammadi and Mollakhalili–Meybodi2023). It is characterised by the lactic acid fermentation of milk, during which lactose is converted into lactic acid by specific starter cultures, leading to protein coagulation and gel formation. Depending on processing and formulation, yoghurt may be categorised as set, stirred, frozen or drinkable types (Mckinley, Reference Mckinley2005; Lee and Lucey, Reference Lee and Lucey2010; Li et al., Reference Li, Ye and Singh2021). According to the (Codex Alimentarius Commission, 2024), yoghurt is defined as a fermented milk produced by the symbiotic action of Streptococcus thermophilus and Lactobacillus delbrueckii subsp. bulgaricus, with or without the addition of other suitable ingredients. Therefore, incorporating plant-based materials such as sweet potato powder (SPP) does not alter its classification as yoghurt, provided that the characteristic lactic acid bacteria carry out the fermentation.
There is a growing trend towards developing functional dairy products enriched with health-enhancing components (Elkot, Reference Elkot2022). Various fruits, plant-based ingredients and prebiotics have been added to yoghurt to improve nutritional and sensory properties (Illupapalayam and Gamlath, Reference Illupapalayam and Gamlath2014; Kaur et al., Reference Kaur, Kaur, Rima, Panwar, H and Brar2017; Ahmad et al., Reference Ahmad, Hao, Li, Zhang, Ding and Lyu2022). Examples include the incorporation of green tea, nuts and spices (Gunenc et al., Reference Gunenc, Khoury, Legault, Mirrashed and Rijke2016; Dönmez et al., Reference Dönmez, Mogol and Gökmen2017). Such ingredients not only improve product diversity but may also support probiotic viability and activity, contributing to the functional properties of yoghurt (Kumari et al., Reference Kumari, Ranadheera, Prasanna, Senevirathne and Vidanarachchi2015; Fazilah et al., Reference Fazilah, Ariff, Khayat, Rios–Solis and Halim2018).
Given the complementary nutritional and functional properties of sweet potato and yoghurt, their combination may offer a promising approach to developing a natural, value-added fermented dairy product. However, research on yoghurt enriched with yellow-fleshed sweet potato remains limited. Therefore, this study aimed to formulate a yoghurt incorporating yellow-fleshed SPP and to investigate its effects on physicochemical, microbiological, and textural properties during a 28-day storage period. Specifically, we hypothesised that: (a) sweet potato starch may function as a natural hydrocolloid, improving yoghurt structure; (b) its prebiotic components may support probiotic growth during fermentation and storage; and (c) the optimal concentration of SPP needs to be established. To verify these hypotheses, the study evaluated pH, titratable acidity (TA), syneresis, total viable counts, colour parameters and texture profile to assess product quality and stability.
Materials and methods
Sweet potato preparation
Fresh yellow-fleshed sweet potato tubers (TN57 variety) were supplied by the Chiayi Agricultural Experiment Branch, Taiwan Agricultural Research Institute. Tubers were thoroughly washed under running tap water to remove soil and surface contaminants, then cut into small pieces, freeze-dried for 72 h, ground (RT-N08, Taiwan) and sieved through a 120-mesh screen. The fresh, yellow-fleshed sweet potato had an initial dry matter content of 33.51%. After the drying and milling process, the resulting SPP reached a final dry matter content of 91.20%, ensuring its stability and suitability for fortification, starch content (dry weight basis) of 49.58%, and total sugar content of 6.51% (sucrose 4.56%, glucose 1.04%, fructose 0.79% and maltose 0.12%). Colour parameters were L* = 87.62, a* = 0.61 and b* = 24.36. At supplementation levels of 5%, 10%, 15% and 20% (w/v), the corresponding starch contributions were approximately 2.48%, 4.96%, 7.44% and 9.92%, respectively. The powder was stored at 4°C until use.
Sweet potato yoghurt preparation and fermentation
Fresh whole milk (Kuang Chuan Fresh Milk, Taiwan) was purchased from local supermarkets contained 3.2% protein, 3.5% fat and 4.7% lactose. SPP was incorporated into fresh milk at concentrations of 0% (control), 5%, 10%, 15% and 20% (w/v). In this study, the total solids and milk protein content were not standardised prior to fermentation. This method was carefully chosen to evaluate the effectiveness of SPP as a natural fortifying agent and a functional filler that enhances the dry matter of the yoghurt without the need for commercial stabilisers. The mixtures were thoroughly stirred to ensure uniform dispersion, but no high-pressure homogenisation was applied, as the powder was already finely ground (120-mesh). The mixtures were heated at 70°C for 60 min, cooled and inoculated with 1% (w/v) lactic acid culture (S. thermophilus and L. delbrueckii subsp. bulgaricus). The lactic acid bacteria used in this study were obtained from the culture stock of the Food Microbiology Laboratory, Department of Food Science, National Chiayi University. Before use, the culture was reactivated in sterile skim milk at 37°C for 12 h and inoculated into the milk mixture at 1% (w/v). Fermentation was conducted at 37°C for 10 h in an orbital shaker incubator (JSL-530, Jorfai, Taiwan) until acidic gelation occurred. Post-fermentation, samples underwent low-temperature ripening at 4°C for 12 h before being stored at 4°C for 28 days. The preparation of yoghurt samples followed the method described in the Supplementary File.
Analysis and storage evaluation
During fermentation (0–10 h), samples were analysed every 2 h for aerobic plate count, pH, TA and viscosity. After 12 h of ripening, fresh yoghurt samples were assessed for physicochemical and microbial properties. During the 28-day storage at 4°C, measurements were taken on Days 0, 1, 7, 14, 21 and 28, evaluating aerobic plate count, pH, TA, syneresis, viscosity, texture profile and colour attributes.
Total plate count
The total plate count was determined using the pour plate technique on de Man–Rogosa–Sharpe (MRS) agar according to Amirdivani and Baba (Reference Amirdivani and Baba2015) with minor modifications. In the pour plate technique, the appropriate serial dilution (10−5–10−8) of the sweet potato yoghurt samples was poured into an MRS agar medium. The plates were kept in an orbital shaker incubator (JSL-530, Jorfai, Taiwan) at 37°C for 2 days. The total plate count was expressed as the logarithm of the number of colony-forming units per millilitre (log CFU/ml).
pH measurement and TA
pH was measured using a pH meter (pH211, Hanna, Italy). TA was assessed by titrating samples to pH 8.2 using 0.1 N NaOH, with phenolphthalein (1%) as the indicator. Samples were stirred for 30 s during titration until a definite pink colour appeared. TA was calculated and expressed as a percentage of lactic acid using the following formula:
 \begin{equation*}{\text{TA}}\left( \% \right) = \frac{{{V_{{\text{NaOH}}}} \times {N_{{\text{NaOH}}}} \times 0.0090}}{{{W_{{\text{sample}}}}}} \times 100\% .\end{equation*}
This formula represents the conventional expression of lactic acid percentage used in milk and yoghurt analysis (Matela et al., Reference Matela, Pillai and Thamae2019).
Syneresis measurement
The yoghurt sample syneresis was determined by the centrifugation method (Keogh and O’Kennedy, Reference Keogh and O’Kennedy1998) using 3,200 rpm (Spectrafuge 16M, Labnet International, USA) for 10 min. The clear supernatant was collected and weighed. The syneresis (%) was calculated according to the following formula:
 \begin{equation*}Syneresis\left( \% \right) = \frac{{weight{\text{ }}of{\text{ }}supernatant{\text{ }}\left( g \right)}}{{weight{\text{ }}of{\text{ }}sample{\text{ }}\left( g \right)}} \times 100\% \end{equation*}
Apparent viscosity measurement
The apparent viscosity of the yoghurt samples was measured at 4°C using a Brookfield DV-II + viscometer (Middleboro, MA, USA) with a No. 3 spindle at 100 rpm.
Texture profile analysis
Texture measurements were performed using a Texture Analyser (TA-XT Plus, Stable Micro Systems, UK) with a P/0.5S cylindrical probe (12.7 mm diameter). Penetration speed was set at 5.0 mm/s, with a force of 10 g and a depth of 10 mm. Approximately 100 ml of yoghurt sample was tested per cup. Hardness (maximum deformation force, g) and adhesiveness (g · s) were recorded.
Determination of colour
The colour analysis was conducted using a colourimeter (NE2000, Nippon Denshoku, Japan). The CIE L*, a* and b* colour parameters obtained may vary from white (100) to black (0), from green (−) to red (+), and from blue (−) to yellow (+), respectively (Hirschler, Reference Hirschler, Caivano and de Pilar Buera2012). Moreover, the total colour difference (ΔE*), whiteness index and yellowness index were calculated using the following equations (Pathare et al., Reference Pathare, Opara and Al–Said2013; Balthazar et al., Reference Balthazar, Gaze, da Silva, Pereira, Franco, Conte–Júnior, Freitas and Silva2015):
 \begin{equation*}\Delta {E^*} = \sqrt {\Delta {L^*}^2 + \Delta {a^*}^2 + \Delta {b^*}^2} ,\end{equation*}
 \begin{equation*}Whiteness{\text{ }}index = 100 - \sqrt {{{(100 - {L^*})}^2} + {a^*}^2 + {b^*}^2} \end{equation*}
 \begin{equation*}\!\!\!\!\!\!\!\!\!\!\!\!\!\!\!\!\!\!\!\!\!\!\!Ylowness{\text{ }}index = \frac{{142.86 \times {b^*}}}{{{L^*}}}\qquad\qquad\end{equation*}
Statistical analysis
Data are presented as mean ± standard error of at least three independent experiments. All data were analysed with analysis of variance with R Project (R version 4.1.0). When the treatment factors were significantly different, the means of each treatment were further compared using the least significant difference (post hoc LSD) test. P < 0.05 was considered statistically significant.
Results
The profile of sweet potato yoghurt during fermentation
Yellow-fleshed SPP was incorporated into milk at concentrations of 0%, 5%, 10%, 15% and 20% (w/v) and fermented at 37°C for 10 h. pH decreased markedly after 6 h, stabilising between 6 and 10 h (Fig. 1A). Final pH values ranged from 4.58 (control) to 4.33 (20% treatment), with sweet potato accelerating acidification compared to the control. TA increased throughout fermentation, particularly within the first 2 h, with final values ranging from 0.57% (control) to 0.68% (20% treatment) (Fig. 1B). Total plate counts increased similarly across treatments, reaching 8.0–8.1 log CFU/ml by 10 h (Fig. 1C). Apparent viscosity rose significantly after 4 h of fermentation, proportional to sweet potato concentration, with final viscosities ranging from 11.5 (control) to 44.2 kcp (20% treatment) (Fig. 1D).
The profile of sweet potato yoghurt samples during fermentation. (A) pH, (B) titratable acidity, (C) total plate count and (D) apparent viscosity. Vertical bars indicate standard error (n = 3).

Figure 1 Long description
Line graph of pH versus Fermentation time (hours) in the image A. The horizontal axis label is Fermentation time (hours) with values from 0 to 10. The vertical axis label is pH with values from 4.0 to 8.0. Five series are shown for 0 percent, 5 percent, 10 percent, 15 percent and 20 percent, distinguished by different marker shapes and line styles. All series decrease from about 6.6 to 6.8 at 0 hours to about 6.0 to 6.2 at 2 hours, then to about 4.5 to 5.5 at 4 hours. By 6 hours, the series are around 4.4 to 4.8 and from 6 to 10 hours the series remain around 4.4 to 4.7. The 0 percent series is the highest at 10 hours at about 4.6 and the 20 percent series is the lowest at 10 hours at about 4.4. Line graph of Titratable acidity versus Fermentation time (hours) in the image B. The horizontal axis label is Fermentation time (hours) with values from 0 to 10. The vertical axis label is Titratable acidity with values from 0.0 to 0.8. Five series are shown for 0 percent, 5 percent, 10 percent, 15 percent and 20 percent, distinguished by different marker shapes and line styles. All series increase over time. At 0 hours, values are about 0.10 to 0.18. At 2 hours, values are about 0.20 to 0.35. At 4 hours, values are about 0.30 for 0 percent and about 0.50 to 0.55 for 5 percent to 20 percent. At 6 hours, values are about 0.48 for 0 percent and about 0.58 to 0.65 for 5 percent to 20 percent. At 10 hours, the 0 percent series is about 0.58 and the highest series are about 0.68 to 0.70. Line graph of Total plate count (log CFU/mL) versus Fermentation time (hours) in the image C. The horizontal axis label is Fermentation time (hours) with values from 0 to 10. The vertical axis label is Total plate count (log CFU/mL) with values from 5.0 to 9.0. Five series are shown for 0 percent, 5 percent, 10 percent, 15 percent and 20 percent, distinguished by different marker shapes and line styles. All series increase from about 5.5 to 5.8 at 0 hours to about 6.0 to 6.6 at 2 hours, then to about 6.8 to 7.1 at 4 hours. At 6 hours, values are about 7.5 to 7.7. From 8 to 10 hours, values are about 7.8 to 8.0, with the series close together. Line graph of Viscosity (cP) versus Fermentation time (hours) in the image D. The horizontal axis label is Fermentation time (hours) with values from 0 to 10. The vertical axis label is Viscosity (cP) with values from 0 to 60,000. Five series are shown for 0 percent, 5 percent, 10 percent, 15 percent and 20 percent, distinguished by different marker shapes and line styles. From 0 to 2 hours, all series are near 0. At 4 hours, the 0 percent series is about 10,000, the 5 percent series is about 18,000, the 10 percent series is about 30,000, the 15 percent series is about 38,000 and the 20 percent series is about 40,000. From 6 to 10 hours, the 0 percent series rises to about 12,000 at 10 hours, the 5 percent series rises to about 20,000 at 10 hours, the 10 percent series rises to about 32,000 at 10 hours, the 15 percent series rises to about 41,000 at 10 hours and the 20 percent series rises to about 44,000 at 10 hours. Across the four graphs, pH decreases while titratable acidity, total plate count and viscosity increase over fermentation time. The 20 percent series shows the lowest pH and the highest viscosity at 10 hours and the 0 percent series shows the highest pH and the lowest viscosity at 10 hours.
The physicochemical properties of the fresh-made sweet potato yoghurt
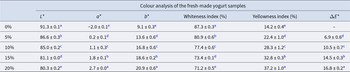
After fermentation and post-ripening, SPP significantly influenced yoghurt characteristics (Tables 1 and 2). pH decreased with increasing sweet potato concentration, while TA increased, reaching 0.87% in the 20% treatment. The highest bacterial count was recorded in the 5% sample (8.73 log CFU/ml); the 20% sample showed the lowest (8.47 log CFU/ml). Syneresis was lowest in the 5% and 10% samples (7.39% and 6.64%, respectively) and highest in the control and 20% treatments. Viscosity increased proportionally with sweet potato addition, with the 15% and 20% samples displaying the highest values. Texture analysis showed higher hardness in the control and 20% samples, while adhesiveness increased progressively with supplementation, peaking at 11.63 g · s in the 20% treatment. Colour analysis revealed a decrease in L* and whiteness indices and an increase in a*, b*, yellowness index and ΔE* values with sweet potato concentration (Fig. 3).
Effects of different sweet potato concentrations on the physical, chemical and microbial properties of the fresh-made yogurt samples

Table 1 Long description
Fresh-made yogurt samples with 0%, 5%, 10%, 15%, and 20% sweet potato were compared for pH, titratable acidity, total bacteria count, syneresis, apparent viscosity, hardness, and adhesiveness (means with standard errors). pH decreased as sweet potato increased, from 4.37 at 0% to 4.09 at 20%, while titratable acidity rose from 0.72% to 0.87%. Total bacteria count stayed within a narrow range, peaking at 8.73 log CFU per ml at 5% and dropping to 8.47 at 20%. Syneresis was highest at 0% (13.96%) and lowest at 10% (6.64%), then increased again at 15% (11.82%) and 20% (13.73%). Apparent viscosity increased strongly with added sweet potato, from 13,360 cp at 0% to about 38,853 cp at 20%, with 15% and 20% the highest. Hardness varied modestly, lowest at 5% (18.61 g) and highest at 20% (21.18 g). Adhesiveness increased with concentration, from 5.91 g·s at 0% to 11.63 g·s at 20%. Letter groupings indicate which values differ statistically within each column, so small numeric differences may not represent meaningful changes.
a–d Mean ± standard error (n = 3). Means within each column followed by the same letter(s) are not significantly different at 5% level by the LSD test.
Effects of different sweet potato concentrations on the colour, whiteness, yellowness and ΔE* of the fresh-made yogurt samples

Table 2 Long description
Colour measurements for fresh-made yogurt are reported across sweet potato concentrations from 0 to 20 percent, including lightness (L star), red to green (a star), yellow to blue (b star), whiteness index, yellowness index, and overall color difference (delta E star). Lightness decreases steadily from 91.3 at 0 percent to 80.3 at 20 percent, indicating darker samples with more sweet potato. The a star value shifts from negative at 0 percent (minus 2.0) to positive at 20 percent (2.7), showing a move away from greenish tones toward redder tones. The b star value increases from 9.1 at 0 percent to 20.9 at 20 percent, indicating stronger yellow coloration. Whiteness index declines from 87.3 at 0 percent to 71.2 at 20 percent, while yellowness index rises from 14.2 to 37.2 over the same range. Overall color difference is not reported for 0 percent, but increases with concentration from 6.9 at 5 percent to 16.8 at 20 percent, suggesting progressively larger visual change relative to the baseline. Values are means with standard errors, and letter groupings indicate which values are statistically similar within each column.
a–e Mean ± standard error (n = 3). Means within each column followed by the same letter(s) are not significantly different at 5% level by the LSD test.
The changes in sweet potato yoghurt properties during storage
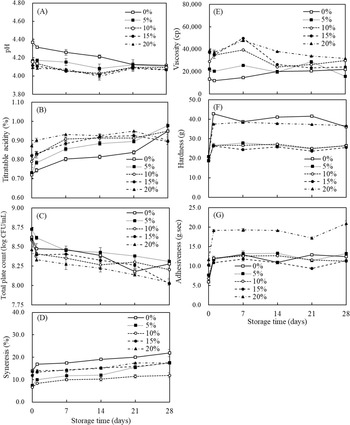
During the 28-day storage at 4°C, pH declined across all samples, with the control showing the greatest drop (from 4.37 to 4.12). TA increased notably in the 0%, 5% and 10% samples, reaching up to 0.98%. Total bacterial counts decreased over time, but the 5% treatment maintained the highest viability (8.31 log CFU/ml) at Day 28. Syneresis increased across treatments; however, the 10% sample maintained the lowest syneresis (11.9%), while the control had the highest (21.9%). Viscosity initially increased during the first week and declined thereafter, except in the control, where a steady increase was noted. Hardness and adhesiveness rose sharply after 1 day and stabilised. Final hardness was highest in the control (36.1) and 20% treatment (36.8), while adhesiveness was greatest in the 20% sample (21.0 g · s).
Colour attributes fluctuated slightly but showed overall declining trends. Final whiteness indices decreased from 85.8% (control) to 71.5% (20% treatment), while yellowness indices increased. ΔE* values rose significantly within the first 14 days and stabilised thereafter, with minimal colour changes observed in the 5% supplementation group.
Discussion
During fermentation, the addition of SPP enhanced bacterial growth, likely due to its prebiotic starch and fibre content (Wang et al., Reference Wang, Wu, Lv, Shao, Hungwe, Wang, Bai, Xie, Wang and Geng2021). This trend aligns with previous findings for other starch- and fibre-enriched yoghurts (Ahmad et al., Reference Ahmad, Hao, Li, Zhang, Ding and Lyu2022; Ladjevardi et al., Reference Ladjevardi, Yarmand, Emam–Djomeh and Niasari–Naslaji2016; He et al., Reference He, Han, Liu, Wang, Yang and Yang2019). Natural compounds such as amino acids and vitamins present in sweet potato may have further supported bacterial proliferation (Rashwan et al., Reference Rashwan, Osman and Chen2023). All samples achieved the recommended pH range (4.0–4.7) and viable counts (>10⁶ CFU/g), indicating successful fermentation (Aryana and Olson, Reference Aryana and Olson2017; Nguyen et al., Reference Nguyen, Kravchuk, Bhandari and Prakash2017). In this study, microbial enumeration was conducted as total viable counts using MRS agar. Although the individual growth kinetics of S. thermophilus and L. delbrueckii subsp. bulgaricus were not differentiated, the overall increase in viable counts suggests a synergistic stimulation of both strains. The prebiotic fibres and soluble sugars in the SPP likely enhanced the symbiotic relationship between the two starter cultures (Albuquerque et al., Reference Albuquerque, Borges, Cavalcanti, Lima, Magnani and de Souza2020), maintaining high viability throughout the 28-day storage period. Notably, sweet potato addition accelerated acidification, which was previously attributed to lactic acid production via starch hydrolysis (Wang et al., Reference Wang, Wu, Lv, Shao, Hungwe, Wang, Bai, Xie, Wang and Geng2021). Although yellow-fleshed sweet potatoes inherently contain minor organic acids, such as malic acid (Albuquerque et al., Reference Albuquerque, Borges, Cavalcanti, Lima, Magnani and de Souza2020), their concentrations are typically insufficient to significantly alter the initial pH of the mixture. Therefore, the enhanced acidification observed is primarily attributed to the stimulated metabolic activity of the starter culture (Albuquerque et al., Reference Albuquerque, Borges, Cavalcanti, Lima, Magnani and de Souza2020). However, as lactic acid bacteria generally lack the ability to hydrolyse starch, this phenomenon is more likely due to the availability of soluble sugars (6.51% total, mainly sucrose 4.56%) naturally present in the powder, as well as the possible heat activation of endogenous β-amylase during the 70°C heating step, which may have generated additional maltose as a fermentable substrate (Mensah et al., Reference Mensah, Ibok, Ellis and Carey2016; Banda et al., Reference Banda, Kyallo, Domelevo Entfellner, Moyo, Swanckaert, Mwanga, Onyango, Magiri, Gemenet, Yao, Pelle and Muzhingi2021; Amankwaah et al., Reference Amankwaah, Williamson, Olukolu, Truong, Carey, Ssali and Yencho2024). Although enhanced microbial activity supports fermentation at moderate supplementation levels, excessively rapid acidification can also be disadvantageous, as it may impose acid stress on lactic acid bacteria and compromise their survival. At 20% supplementation, bacterial viability decreased, likely due to the combined effects of accelerated acid production, increased osmotic pressure from high soluble-solid content, and reduced water activity caused by the high starch and fibre load. The dense matrix formed at this level may also have limited nutrient diffusion, creating a microenvironment that imposed acid and osmotic stress on lactic acid bacteria, ultimately reducing their survival (Papadimitriou et al., Reference Papadimitriou, Alegría, Bron, de Angelis, Gobbetti, Kleerebezem, Lemos, Linares, Ross, Stanton, Villarroel and Tsakalidou2016; He et al., Reference He, Li, Zhang, Chen, Wang and Xu2025).
Syneresis, a critical parameter for yoghurt quality (Lucey, Reference Lucey2001, Reference Lucey2004; Arab et al., Reference Arab, Yousefi, Khanniri, Azari, Ghasemzadeh–Mohammadi and Mollakhalili–Meybodi2023), was reduced with 5–10% sweet potato addition immediately after fermentation and during storage (Fig. 2D). This improvement was likely due to the hydrocolloid properties of sweet potato starch, which can increase water binding and fill voids within the casein matrix, thereby enhancing gel stability (Wong et al., Reference Wong, Wicklund, Bridges, Whaley and Koh2020; Arab et al., Reference Arab, Yousefi, Khanniri, Azari, Ghasemzadeh–Mohammadi and Mollakhalili–Meybodi2023). Although it is known that increasing total solids can physically reduce syneresis, the reduction found in this study at 5–10% SPP levels is primarily due to the functional characteristics of sweet potato starch. During the pre-heating process at 70°C, the starch granules gelatinise, causing them to expand and occupy the interstitial spaces within the casein network (Torres-Álvarez et al., Reference Torres-Álvarez, García-Alanís, Amaya-Guerra, Cabello-Ruiz, Chávez-Montes, Castillo-Hernández and Bautista-Villarreal2025). This results in a more robust matrix that physically entraps the serum phase (which contains whey proteins), preventing it from being expelled. Furthermore, the presence of dietary fibres in the SPP provides additional water-binding sites via hydrogen bonding, delivering a stabilising effect that surpasses basic dry matter fortification (Li et al., Reference Li, Zhou, Yang, Cen, Zhang, Hui, Chen, Dai and Zeng2024). However, at higher concentrations (15–20%), syneresis increased despite the simultaneous rise in apparent viscosity and adhesiveness. This behaviour suggests that large amounts of swollen starch granules and dietary fibre may disrupt the continuity of the casein network and compete for water, weakening gel structure. During cooling and partial starch retrogradation, internal structural stress may expel unbound water, resulting in higher syneresis even though the serum phase becomes more viscous (Considine et al., Reference Considine, Noisuwan, Hemar, Wilkinson, Bronlund and Kasapis2011; Scott and Awika, Reference Scott and Awika2023). These findings indicate that moderate supplementation levels (5–10%) best support overall gel integrity.
The storage test of sweet potato yoghurt samples for 28 days. (A) pH, (B) titratable acidity, (C) total plate count, (D) syneresis, (E) apparent viscosity, (F) hardness and (G) adhesiveness. Vertical bars indicate standard error (n = 3).

Figure 2 Long description
The storage test of sweet potato yoghurt samples for 28 days. (A) pH: X-axis is storage time (days) from 0 to 28. Y-axis is pH from 3.80 to 4.80. The 0 percent group starts at 4.20 and decreases slightly, while the 20 percent group starts lower and remains stable. (B) Titratable acidity: X-axis is storage time (days) from 0 to 28. Y-axis is titratable acidity (percent) from 0.60 to 1.10. The 20 percent group shows a gradual increase, peaking at 1.05. (C) Total plate count: X-axis is storage time (days) from 0 to 28. Y-axis is log colony forming unit per milliliter from 7.75 to 9.00. The 0 percent group decreases from 8.50 to 8.00, while the 20 percent group remains higher. (D) Syneresis: X-axis is storage time (days) from 0 to 28. Y-axis is syneresis (percent) from 0.0 to 40.0. The 0 percent group shows a slight increase, while the 20 percent group remains stable. (E) Viscosity: X-axis is storage time (days) from 0 to 28. Y-axis is viscosity (centipoise) from 0 to 80000. The 20 percent group starts high and decreases slightly. (F) Hardness: X-axis is storage time (days) from 0 to 28. Y-axis is hardness (gram) from 0.0 to 50.0. The 0 percent group remains stable, while the 20 percent group shows a slight increase. (G) Adhesiveness: X-axis is storage time (days) from 0 to 28. Y-axis is adhesiveness (gram second) from 0.0 to 25.0. The 20 percent group starts higher and remains stable. Overall, the graphs show how different sweet potato concentrations affect yoghurt properties over time, with higher concentrations generally maintaining stability or increasing in certain parameters.
The colour analysis of sweet potato yoghurt samples of 28-day storage. (A) L*, (B) a*, (C) b*, (D) whiteness index, (E) yellowness index and (F) ΔE* (compared with the 0 day). Vertical bars indicate standard error (n = 3).

Figure 3 Long description
Line graph of L asterisk versus Storage time (days). X-axis: Storage time (days), values 0, 7, 14, 21, 28. Y-axis: L asterisk, values 75.0 to 100.0. Legend series: 0 percent, 5 percent, 10 percent, 15 percent, 20 percent. Series are distinguished by different marker shapes and different line styles. All five series decrease from day 0 to day 14, then remain near the day 14 level through day 28. The 0 percent series is the highest across all days and the 20 percent series is the lowest across all days. Line graph of a asterisk versus Storage time (days). X-axis: Storage time (days), values 0, 7, 14, 21, 28. Y-axis: a asterisk, values negative 4.0 to 8.0. Legend series: 0 percent, 5 percent, 10 percent, 15 percent, 20 percent. Series are distinguished by different marker shapes and different line styles. The 0 percent series stays below 0.0 across all days and trends downward by day 28. The 5 percent, 10 percent, 15 percent and 20 percent series stay above 0.0 and show small changes over time, with values generally higher at higher percent levels. Line graph of b asterisk versus Storage time (days). X-axis: Storage time (days), values 0, 7, 14, 21, 28. Y-axis: b asterisk, values 0.0 to 40.0. Legend series: 0 percent, 5 percent, 10 percent, 15 percent, 20 percent. Series are distinguished by different marker shapes and different line styles. The 0 percent series is the lowest across all days and dips around day 14 before rising slightly by day 28. The 20 percent series is the highest across all days and shows a gradual decrease from day 0 to day 21, with a small rise by day 28. Line graph of Whiteness index (percent) versus Storage time (days). X-axis: Storage time (days), values 0, 7, 14, 21, 28. Y-axis: Whiteness index (percent), values 50.0 to 100.0. Legend series: 0 percent, 5 percent, 10 percent, 15 percent, 20 percent. Series are distinguished by different marker shapes and different line styles. The 0 percent series is the highest across all days and stays near the upper part of the scale with small changes. The 20 percent series is the lowest across all days and stays near the lower part of the plotted lines with small changes. Across all series, changes over time are small compared with the differences between percent levels. Line graph of Yellowness index (percent) versus Storage time (days). X-axis: Storage time (days), values 0, 7, 14, 21, 28. Y-axis: Yellowness index (percent), values 0.0 to 70.0. Legend series: 0 percent, 5 percent, 10 percent, 15 percent, 20 percent. Series are distinguished by different marker shapes and different line styles. The 0 percent series is the lowest across all days and dips around day 14, then rises slightly by day 28. The 20 percent series is the highest across all days and shows a gradual decrease from day 0 to day 21, then a small rise by day 28. Line graph of delta E asterisk (compared with the 0 day) versus Storage time (days). X-axis: Storage time (days), values 0, 7, 14, 21, 28. Y-axis: delta E asterisk (compared with the 0 day), values 0.0 to 8.0. Legend series: 0 percent, 5 percent, 10 percent, 15 percent, 20 percent. Series are distinguished by different marker shapes and different line styles. Vertical error bars are shown at multiple points. All series start near 0.0 at day 0, rise by day 7, reach their highest levels around day 14 and day 21, then decrease by day 28. The 20 percent series is higher than the other series at day 0 and day 7 and the 0 percent, 5 percent, 10 percent and 15 percent series cluster closely together around the peak period. Across the six graphs, the percent level separates the series consistently: higher percent levels align with lower L asterisk and lower whiteness index and higher b asterisk and higher yellowness index. Delta E asterisk increases during storage to a peak around day 14 to day 21 for all percent levels, then decreases by day 28.
Texture analysis revealed that SPP influenced hardness and adhesiveness. The present study observed decreased hardness with 5–15% whole SPP, likely due to the presence of proteins, fibres and lipids affecting gel structure (Mudgil et al., Reference Mudgil, Barak and Khatkar2017). This reduction may also be explained by interference of swollen starch granules and fibre components with casein–casein interactions, weakening the continuity of the protein gel network. However, at 20% supplementation, the considerably higher starch content may have contributed to the formation of a more dominant starch-based matrix, increasing total solids, water binding and partial starch retrogradation, thereby restoring firmness to a level comparable with the control (Fig.4). Similar non-linear trends have been reported in yoghurts fortified with starch or hydrocolloids (Considine et al., Reference Considine, Noisuwan, Hemar, Wilkinson, Bronlund and Kasapis2011; Nguyen et al., Reference Nguyen, Kravchuk, Bhandari and Prakash2017).
Mechanistic illustration of the interactions between SPP and the yoghurt matrix.

Figure 4 Long description
Mechanistic illustration of yoghurt fortification showing two circular diagrams. The left diagram is labeled ′Control Yoghurt′ and depicts whey molecules and whey separation (syneresis) with high syneresis and low viscosity. The right diagram is labeled ′Fortified Yoghurt′ and shows gelatinised starch granules, water binding and entrapment, dietary fibres and enhanced probiotic viability with low syneresis and high viscosity. The text highlights differences in structure and properties between the two types of yoghurt.
Adhesiveness and apparent viscosity increased with higher concentrations, consistent with other reports on plant-derived starches (Sameen et al., Reference Sameen, Khan, Sattar, Javid and Ayub2016; Wong et al., Reference Wong, Wicklund, Bridges, Whaley and Koh2020; Hussain et al., Reference Hussain, Mohamed, Alamri, Saleh, Ibraheem, Qasem, Shamlan and Abatain2022). The interaction between sweet potato components and casein micelles likely reinforced the protein matrix (Guven et al., Reference Guven, Yasar, Karaca and Hayaloglu2005), although further rheological studies are needed. In terms of sensory perception, the reduction in hardness and moderate increase in adhesiveness at 5–10% levels may be interpreted as an improvement in creaminess and body, with the SPP acting as a natural thickener. However, the marked rise in adhesiveness at 15–20% likely points towards a heavier, perhaps ‘pasty’ mouthfeel, which could be less desirable in traditional yoghurt but potentially suitable for thicker, pudding-style desserts.
Colour, a key sensory attribute, was significantly affected by sweet potato addition. L* values and whiteness index decreased, while a*, b*, yellowness index and ΔE* increased proportionally with concentration (Table 2). Even 5% addition caused perceptible colour changes (ΔE* > 3) (Hirschler, Reference Hirschler, Caivano and de Pilar Buera2012). Although yoghurt is traditionally expected to be white, this shift towards golden yellow hues is not necessarily a drawback. In the context of fortified dairy, colour serves as a visual cue for the presence of natural functional ingredients. For health-conscious consumers, these vibrant colours are directly linked to the β-carotene content of the sweet potato and can enhance product appeal by signalling a nutrient-enriched clean-label profile. Storage results showed that 5% supplementation maintained the best colour stability, with minimal ΔE* increase over 28 days, suggesting improved visual appeal throughout shelf life.
Storage stability was largely supported by acidification achieved during fermentation, which helped to inhibit the growth of spoilage micro-organisms (Sharma et al., Reference Sharma, Garg, Kumar, Bhatia and Kulshrestha2020). SPP, functioning as a natural hydrocolloid and prebiotic, enhanced viscosity, syneresis control and overall texture during storage (Saleh et al., Reference Saleh, Mohamed, Alamri, Hussain, Qasem and Ibraheem2020; Wong et al., Reference Wong, Wicklund, Bridges, Whaley and Koh2020). In addition to these technological advantages, the use of whole SPP provides nutritional benefits compared with isolated starches, offering dietary fibres, β-carotene, and essential minerals (Teow et al., Reference Teow, Truong, McFeeters, Thompson, Pecota and Yencho2007; Agili et al., 2012). Furthermore, incorporating SPP aligns with the clean-label movement in the dairy industry, reflecting growing consumer preferences for transparency and short, recognisable ingredient lists (Asioli et al., Reference Asioli, Aschemann-Witzel, Caputo, Vecchio, Annunziata, Næs and Varela2017). Although SPP is a processed ingredient, it functions as a natural source of starch, fibre, and colour pigments, thereby reducing reliance on synthetic stabilisers and colourants in yoghurt formulations. Nevertheless, optimising the concentration is essential. While 5–10% addition improved yoghurt texture, microbial viability and colour stability, higher supplementation levels weakened the gel structure and decreased bacterial counts. In this study, the term functional benefits denotes the combined physiological advantages of live lactic acid bacteria and bioactive compounds from SPP, including improved probiotic viability, antioxidant potential and dietary fibre contribution (Granato et al., Reference Granato, Barba, Bursać Kovačević, Lorenzo, Cruz and Putnik2020).
Aside from these benefits, the use of SPP is likely to impact the flavour character of the yoghurt. The natural sugars in the powder, particularly sucrose, could help to reduce the perceived sourness of the lactic acid, resulting in a more balanced acid-sweet ratio, which is important for palatability. While higher amounts of supplementation may contribute vegetal or starchy overtones, these are expected to be less noticeable in the 5–10% range, where fermentation-derived aromatic chemicals can effectively mask any earthy undertones. Looking towards commercial applications that might include fruit, the interaction between organic acids from fruits and the sweet potato components is an interesting factor. While fruit acids can sometimes destabilise a yoghurt gel, the gelatinised starch and fibre from the SPP may actually act as a physical buffer. This could help maintain gel integrity and prevent water from leaking out even when the pH drops further. There is also the potential for a positive synergy between sweet potato fibres and fruit pectins, which might further improve the thickness and stability of the final product. These results underline the importance of balancing technological performance with functional value to ensure that plant-based enrichment enhances, rather than compromises, dairy product quality.
Conclusions
This study demonstrated that the incorporation of yellow-fleshed SPP into yoghurt formulations significantly enhanced fermentation kinetics, microbial viability, textural stability, syneresis control and colour retention. The addition of SPP impacted yoghurt characteristics differently depending on the concentration but overall proved advantageous for both the fermentation process and the final product quality. Yoghurt samples supplemented with SPP exhibited higher total plate counts, TA, viscosity and adhesiveness, alongside lower syneresis, compared to the control. The positive effects were particularly evident during the 28-d storage period, where SPP contributed to improved texture and colour stability. However, while additions of 5–10% (w/v) SPP effectively enhanced yoghurt properties, higher concentrations (15–20%) negatively affected gel structure and bacterial viability. These findings highlight the potential of SPP as a natural stabiliser and functional ingredient in dairy applications. Optimising the concentration at 5–10% is strongly recommended to achieve technological, sensory and nutritional benefits, offering a promising approach to the development of value-added, health-oriented yoghurt products that meet current consumer demand for natural and nutritious foods.
Supplementary material
The supplementary material for this article can be found at https://doi.org/10.1017/S0022029926102283.
Acknowledgements
The authors used AI tools for language editing only. All scientific content, analysis and interpretations were produced and verified by the authors.