Introduction
In a wide range of applications, the state of a system may be described by a random vector in  ${\mathbb R}^d$. The underlying probability distribution may be unknown. In this paper, we assume that the random vector is unbounded and that the random samples, appropriately scaled, converge onto a deterministic limit set. The prime example is a multivariate Gaussian distribution, where random samples may be scaled to converge onto the covariance ellipsoid [Reference Geffroy19], [Reference Geffroy20]. We are interested in the tail behaviour of random variables which can be expressed as continuous positive-homogeneous functionals of the underlying random vector.
We indicate some applications. Let  ${\mathbf X}=(X_1,\ldots, X_d)$ denote a random vector describing the state of the system. A linear combination of the components
 $U=u({\mathbf X})=u_1X_1+\cdots u_dX_d$ can be used to represent the loss on a financial portfolio of d assets, with
 $X_i$ denoting the loss on the ith asset and
 $u_i$ its investment weight, for
 $i=1,\ldots,d$. Alternatively, one might be interested in the maximal losses over certain subsets of assets in the portfolio. These maximal losses also are continuous positive-homogeneous functionals of the components of the underlying vector
 ${\mathbf X}$. One might speak of severe risk if the minimum of two linear functionals on the vector of these maxima exceeds a certain value. This minimum also is a positive-homogeneous functional of the underlying vector
 ${\mathbf X}$. If the
 $X_i$’s denote rainfall over a given period of time at d sites in some region, a linear combination can be used to approximate the volume of water running into a dam, the variable whose extremal behaviour is of importance in the design of reservoirs. In this case, the weight
 $u_i$ for the site i is determined by the inter-site differences and regional topography; see [Reference Coles and Tawn8]. Another example is
 $U=u({\mathbf X})=\max_{i=1,\ldots,d} X_i$, where
 $X_i$ could be the adjusted sea or river level at location i, with the interpretation that the coastal or river-bank network fails if over-topping or flooding occurs at any of the locations. In quality control, one performs d measurements on a bridge or some other engineering construction and is concerned that the resulting vector may lie outside a pre-assigned safety set.
In all these examples, the interest is in situations where a certain continuous functional of the underlying random vector exceeds a critical level:  $u({\mathbf X})>c_0$. Alternatively, one may consider the event that a sample point from the underlying distribution falls in the risk region
 $R=\{{\mathbf x}\in{\mathbb R}^d\ :\ u({\mathbf x})>c_0\}$. We will show that the tail behaviour of the variable
 $U=u({\mathbf X})$ is determined by the limit set, the sequence of scaling constants, and the maximal value of the functional u on the limit set. This may sound rather technical. The underlying idea is simple. Our only assumption is that there is an increasing sequence of positive constants
 $a_n$ such that the random samples from the distribution of
 ${\mathbf X}$ scaled by
 $a_n$ converge onto a compact set S, the limit set. A simple deterministic computational problem, that of maximizing the positive-homogeneous function u over the compact set S, yields information about the asymptotic value of the upper quantiles of the random variable
 $u({\mathbf X})$, and hence about the risk associated with, say, the financial portfolio determined by the functional u as in the example above.
When studying extremes in a multivariate setting, the limit behaviour of scaled random samples plays an important role. The scaled sample is a finite random set,  $N_n=\{{\mathbf X}_1/a_n,\ldots,{\mathbf X}_n/a_n\}$. What happens for
 $n\to\infty$? Most attention has gone to the case where there is a limit point process:
 $N_n\Rightarrow N$. If the tail of the underlying probability distribution is multivariate regularly varying, the limit N is a Poisson point process on
 ${\mathbb R}^d$; see, for instance, [Reference De Haan and Ferreira10, Theorem 6.2]. In this paper, we consider the situation in which the limit of the scaled random samples is a deterministic bounded set
 $S\subset{\mathbb R}^d$. This is the case when the underlying distribution has light tails. To avoid trivialities, we assume that the underlying vector
 ${\mathbf X}$ is unbounded and that the limit set S contains at least two points.
The authors of [Reference Kinoshita and Resnick24] study almost sure convergence of random samples onto a limit set. They show that the limit set S then is compact and star-shaped. (A set  $S\subset{\mathbb R}^d$ is star-shaped if
 ${\mathbf x}\in S$ implies
 $t{\mathbf x}\in S$ for all
 $0\le t\le1$.) They give necessary and sufficient conditions on a probability distribution to ensure almost sure convergence. Our assumption is weaker: we only assume convergence in probability. This leads to a simpler theory. One can draw an analogy here to the asymptotic behaviour of averages and maxima. For averages, there exist a strong law of large numbers and a weak law. For maxima of nonnegative random variables, the weak law is simple: the sample maxima scaled by the
 $(1-1/n)$-quantile converge in probability to one if and only if the tail of the distribution function (df) varies rapidly [Reference Gnedenko21]. For almost sure convergence, the condition on the tail of the df is more complicated [Reference Barndorff-Nielsen5]:
 \begin{equation*}\int_1^\infty(1-F(x/q))^{-1} dF(x)<\infty,\qquad \forall q>1.\end{equation*}
Convergence of the maxima to one implies convergence of the random samples (with the same scaling) onto the closed interval [0, 1]. The univariate theory for nonnegative random variables is well-established. In the multivariate theory, an important role is played by geometrical considerations, in particular by the shape of the limit set and also the shape of the level sets of the positive-homogeneous functionals, which determine the risk associated with the underlying multivariate distribution.
The aim of this paper is to explore implications of the assumption that the scaled random samples from a multivariate distribution converge onto a bounded deterministic set S. For this we consider the extremal behaviour of certain random variables  $U=u({\mathbf X})$ associated with the random vector
 ${\mathbf X}$. We restrict attention to functions u which are continuous on
 ${\mathbb R}^d$, nonnegative, and positive-homogeneous:
 \begin{equation}u(r{\mathbf x})=ru({\mathbf x}),\qquad r>0.\end{equation}
The variable  $U=u({\mathbf X})$ will be called a risk variable for short. We are interested in the tails of risk variables and in understanding how large values of risk variables are linked.
Panel (a): Illustration of the limit set  $S=\{(x,y)\ :\ Q(x,y)\le1\}$ with
 $Q(x,y)=(4/3)(x^2+xy+y^2)$, the risk region
 $R=\{(x,y)\,:\,\xi+3y>14\}$, and an expanded set rS with
 $r=\sqrt{28}$ abutting R. Panel (b): A random sample of size
 $n=e^{14}$ from the bivariate Gaussian distribution with standard normal marginals and correlation
 $-0.5$ along with an expanded set
 $a_nS$ with
 $a_n=\sqrt{2\log n}=\sqrt{28}$; limit set S and risk region R are the same as in Panel (a).

To give the flavour of the main results of the paper, let us illustrate some of the ideas by a simple example. Suppose  ${\mathbf Z}=(X,Y)$ has a bivariate centered Gaussian distribution, where X and Y are standard normal with correlation
 $\rho=-1/2$. The density is proportional to
 $e^{-Q(x,y)/2}$ with
 $Q(x,y)=(4/3)(x^2+xy+y^2)$. It can be shown that samples of n independent copies of
 ${\mathbf Z}$, scaled by
 $a_n=\sqrt{2\log n}$, converge onto a limit set, the covariance ellipse
 $S=\{(x,y): Q(x,y)\le1\}$. Let our risk region R be the open half-plane
 $x+3y>14$; see Figure 1a for illustration. We are interested in the probability of a sample point falling in the region R.
There is a positive geometric constant which is crucial in analyzing this situation. Define r to be the factor by which one has to expand the limit set to hit the risk region. That is, we say that a compact set  $A\subset{\mathbb R}^d$abuts an open set B if A is disjoint from B but intersects the closure of B; then the constant r is defined so that, for an open risk region R, rS abuts R. If R is the level set of a nonnegative continuous positive-homogeneous function,
 $R=\{u>1\}$, and R is far off, then
 \begin{equation}u^*=\max u(S)=1/r\end{equation}
is small. For intricate star-shaped limit sets in high-dimensional spaces and complicated functionals u, one may approximate  $u^*$ numerically by maximizing
 $u({\mathbf x})$ over a large number of points in S. In our Gaussian example there is a simple analytic method. The minimum of the quadratic function Q on the boundary of the half-plane,
 $x+3y=14$, is 28. Hence
 $r=\sqrt{28}$. A sample of n points may be approximated by the ellipse
 $a_nS$; see Figure 1b. We need to find the index n for which
 $a_n=\sqrt{28}$. The asymptotic formula
 $a_n\sim\sqrt{2\log n}$ suggests
 $n=e^{14}=1.2\times 10^6$. A rough approximation of the probability then is
 ${\mathbb P}\{(X,Y)\in R\}\approx 1/n=8/10^7$.
One can compute the exact probability here since  $U=X+3Y$ has a centred Gaussian distribution with variance
 $\sigma^2=7$. We have
 ${\mathbb P}\{U>14\}={\mathbb P}\{U/\sigma>\sqrt{28}\}=6.07/10^8$. This is smaller by a factor of more than ten! However, if the underlying density is not the Gaussian density above but the density proportional to
 $Qe^{-Q/2}$, the limit set is the same and so are the scaling constants. The rough approximation remains
 $8/10^7$, but the exact probability of the half-plane now is
 $1.25/10^5$. Our geometric approximation will also work if one wants to approximate the probability of more complicated risk regions, such as the intersection of two half-planes or the region where some norm exceeds a given value. In these cases, a precise evaluation of the probability may be cumbersome even for a bivariate Gaussian distribution.
Now consider the general case. Let  ${\mathbf X}$ be a random vector in
 ${\mathbb R}^d$ and S the limit set of the random samples from the distribution of
 ${\mathbf X}$ scaled by
 $a_n$. Let
 $u_n$ denote the
 $(1-1/n)$-quantile of the risk variable
 $U=u({\mathbf X})$, and set
 $R=\{u>1\}$. The set
 $u^*R$ abuts S for
 $u^*=\max u(S)$; see (0.2). The set
 $a_nS$ has the same shape as the limit set S and roughly fits a random sample of size n from the distribution of
 ${\mathbf X}$. It abuts
 $a_nu^*R$. It follows that the product
 $a_nu^*$ is asymptotically equal to the
 $(1-1/n)$-quantile
 $u_n$ of the risk variable U. (A formal proof is given in Section 2; see (2.1).) Thus,
 \begin{equation}a_nu^*\sim u_n,\qquad n\to\infty.\end{equation}
In the Gaussian case,  $a_n\sim\sqrt{2\log n}$. Hence,
 ${\mathbb P}\{U>u_n\}=1/n$ implies
 \begin{equation*}-\log{\mathbb P}\{U>u_n\}\sim a_n^2/2\sim (u_n/u^*)^2/2,\end{equation*}
and
 \begin{equation}-\log{\mathbb P}\{U>t\}\sim (t/u^*)^2/2,\qquad t\to\infty.\end{equation}
An asymptotic expression for the logarithm of the probability rather than for the probability itself is weak. Cees de Valk in recent papers (see [Reference De Valk13] and [Reference De Valk12]) has shown how regular variation of log-probabilities for distributions with Weibull-like tails, both univariate and multivariate, may be used to obtain good estimates for high quantiles associated with very small probabilities.
Samples from the vector  ${\mathbf Z}=(X,Y)$ for the Gaussian density with the covariance ellipse
 $S=\{Q\le1\}$ above scaled by
 $a_n=\sqrt{2\log n}$ have the limit set S. But so have the samples from the density
 $cQe^{-Q/2}$, or from the vector with integer-valued components
 $\text{round}(X)$ and
 $\text{round}(Y)$, or from
 $(X+1,Y-2)$. This paper focuses on results which are so crude that they hold for all of these random vectors.
The paper is organized as follows. Section 1 contains the definitions of the basic concepts, including convergence of scaled samples onto a limit set, risk variable and risk region, homothetic density, and Weibull-like tails; we also establish a number of simple results. In Section 2 it is shown how a classic result of Gnedenko on positive random variables with rapidly varying tails implies tail coherence of risk variables  $U=u({\mathbf X})$ in the sense that standardized risk variables all have the same quantiles asymptotically. More refined results are obtained under the further assumption of Weibull-like tails. Section 3 discusses coefficients of tail dependence and extends Theorem 2.1 in [Reference Nolde27] on the relationship between the coefficient of intermediate tail dependence and the geometry of the limit set S. Section 4 describes the asymptotic behaviour of the number of sample points in risk regions. The Concentration Lemma (Lemma 4.2) allows us to construct distributions with unexpected second-order expansions. Section 5 introduces the intersection index which links the margins by their order statistics and relates this index to a coefficient of geometric tail dependence. Section 6 characterizes the domains of attraction for limit sets. Conclusions are formulated in Section 7. The appendix contains supporting material of a more technical nature.
1. Preliminaries
This section contains the basic definitions: convergence of sample clouds onto a deterministic set, risk variable and risk region, Weibull-like tails, and homothetic density. Risk variables and risk regions are shown to be closely related. We review the literature and derive a number of simple results.
The following basic definitions will be used in the sequel. A measurable function  $h\,:\, (0,\infty)\to(0,\infty)$ is rapidly varying if
 \begin{equation*}h(tx)/h(t)\to \begin{cases} \infty, & 0<x<1,\\[5pt] 0, & x>1,\end{cases}\qquad t\to\infty; \end{equation*}
it is regularly varying at infinity (resp. at zero) with index  $\alpha\in{\mathbb R}$ if
 \begin{equation*}h(tx)/h(t) \to x^\alpha,\qquad x>0,\qquad t\to\infty\quad (\text{resp.\ } t\to0); \end{equation*}
if  $\alpha=0$, h is said to be slowly varying. For details, refer to [Reference Bingham, Goldie and Teugels6].
1.1. Limit sets
Consider a sample  ${\mathbf X}_1,\ldots,{\mathbf X}_n$ of independent and identically distributed (i.i.d.) random vectors on
 ${\mathbb R}^d$. The scaled sample
 \begin{equation}N_n=\{{\mathbf X}_1/a_n,\ldots,{\mathbf X}_n/a_n\}\end{equation}
is called an n-point sample cloud. We write  $N_n(A)$ for the number of points (counted with multiplicity) of
 $N_n$ in a Borel set
 $A\subset{\mathbb R}^d$.
Definition 1.1. Let S be a bounded set in  ${\mathbb R}^d$ and let
 $N_n$ be finite point processes. Then
 $N_n$ converges onto S if
• any open set O containing the closure of S tends to contain all points of
 $N_n$:
(1.2)
\begin{equation} {\mathbb P}\{N_n(O^c)>0\}\to0,\qquad n\to\infty; \end{equation}
• for any point
${\mathbf p}\in S$, the number of points in the open $\epsilon$-ball centered at ${\mathbf p}$ tends to be large:
(1.3)
\begin{equation} {\mathbb P}\{N_n({\mathbf p}+\epsilon B)>m\}\to1,\qquad n\to\infty,\qquad m=1,2,\ldots, \qquad{\mathbf p}\in S,\ \epsilon>0. \end{equation}


The set S is called the limit set of the sequence  $N_n$.
Convergence onto a bounded set S implies convergence onto the closure of S. Hence we may and shall assume that the limit set S is compact. Our definition then agrees with convergence in probability of compact sets in random set theory; see [Reference Matheron26].
If  ${\mathbf X}$ is bounded, the samples without scaling converge onto the support of the distribution. One can force any sequence of samples to converge onto
 $S=\{{\bf0}\}$ by making the scaling constants
 $a_n$ very large. Hence we shall always impose the following regularity conditions:
 \begin{equation}(a_n)\ ({\text{or}\ } {\mathbf X})\ {\text{is}\ \text{unbounded}};\qquad S\ {\text{is}\ \text{bounded};}\qquad S\not=\{{\bf0}\}.\end{equation}
On replacing the scaling constants  $a_n$ by
 $a^{\prime}_n=a_n/2$, the limit set becomes 2S. It is not the size but the shape of S which is of interest. We say two sets
 $A,B\subset{\mathbb R}^d$ have the same shape if
 $A=rB$ for some
 $r>0$. Replacing
 $a_n$ by
 $a^{\prime}_n\sim a_n$ has no effect on the shape of the limit set. For random samples, the numbers
 $N_n(A)$ are binomially distributed, and one may describe convergence onto S in terms of probabilities as in Proposition 2.3 in [Reference Balkema, Embrechts and Nolde2]. This yields simple criteria for convergence of sample clouds onto S.
Proposition 1.1. The random samples from a probability distribution  $\pi$on
 ${\mathbb R}^d$scaled by
 $a_n$converge onto the compact set S if and only if
(1)
$n\pi(a_nO^c)\to0$for any open set O which contains S;(2)
$n\pi(a_n({\mathbf p}+\epsilon B))\to\infty$for each ${\mathbf p}\in S$and every $\epsilon>0$,


where B is the open Euclidean unit ball in  ${\mathbb R}^d$.
Gnedenko considered the univariate case. In [Reference Gnedenko21, Theorem 2] he proves that for a nonnegative unbounded random variable X with a df F, the partial maxima may be scaled to converge to one in probability if and only if  $1-F$ varies rapidly at infinity. The argument runs as follows. For any
 $q>1$, the scaling constants
 $a_n$ satisfy
 $n(1-F(qa_n))\to0$ and
 $n(1-F(a_n/q))\to\infty$ for
 $n\to\infty$. Let
 $1-F$ vary rapidly at
 $\infty$ and let
 $a_n$ satisfy
 $1-F(a_n)\le1/n\le1-F(a_n-0)$. Then the sample clouds in (1.1) converge onto [0, 1]. That in turn implies that the maxima converge to one in probability. Observe that
 $a_n\sim L(1/n)$ for a continuous strictly decreasing function
 $L\,:\,(0,1]\to[0,\infty)$, which is asymptotically equal to
 $(1-F)^\leftarrow$ at zero. Rapid variation of
 $1-F$ at infinity implies that L varies slowly at zero.
For an unbounded continuous strictly decreasing function  $L\,:\,(0,1)\to(0,\infty)$, let
 ${\mathcal F}_+(L)$ denote the set of dfs F on
 $[0,\infty)$ for which the sample clouds converge onto [0, 1] with the scaling
 $a_n=L(1/n)$. Gnedenko’s theorem gives the following.
Proposition 1.2.  ${\mathcal F}_+(L)$is non-empty if and only if L varies slowly at zero.
Proposition 1.3. Let  $L,M\,:\,(0,1)\to(0,\infty)$be two unbounded continuous strictly decreasing functions. If
 ${\mathcal F}_+(L)$and
 ${\mathcal F}_+(M)$intersect, then they coincide, and M and L are asymptotically equal at zero.
The multivariate theory developed gradually. Fisher [Reference Fisher17] extended Gnedenko’s result to vectors  ${\mathbf X}$ on
 ${\mathbb R}^d$ with independent components. For nonnegative components
 $X_i$ with a common distribution, the limit set has the form
 $S=cS_\tau$ for some
 $c>0$ and
 $\tau\in[0,\infty]$, where
 \begin{equation*}S_\tau=\{{\mathbf x}\in[0,1]^d\mid x_1^\tau+\cdots+x_d^\tau\le1\},\qquad \tau\in(0,\infty).\end{equation*}
 $S_0=[0,1]^d$, and
 $S_\infty$ is the union of the line segments
 $[{\bf0},{\mathbf e}_i]$ linking the origin to each of the d base vectors. Note that
 $S_\tau$ for
 $\tau\in[0,1]$ is the restriction of the closed
 $\ell^{1/\tau}$ ball to
 $[0,\infty)^d$.
Theorem 1.1. (Fisher.) Let  ${\mathbf X}=(X_1,\ldots,X_d)'$have independent components with common df F on
 $[0,\infty)$such that
 $1-F=e^{-T}$for some increasing function
 $T\,:\,[0,\infty)\to{\mathbb R}$. If the associated sample clouds converge onto S almost surely and (1.4) holds, then
 $S=cS_\tau$for some
 $c>0$and
 $\tau\in[0,\infty]$. This holds if and only if T varies regularly with exponent
 $\tau$if
 $\tau\in[0,\infty)$and rapidly if
 $\tau=\infty$.
Definition 1.2. A df F on  $[0,\infty)$ has a Weibull-like tail with exponent
 $\tau$ if
 $\tau\in(0,\infty)$ and if
 \begin{equation}1-F=e^{-T},\qquad \text{where } T\ {\text{varies}\ \text{regularly}\ \text{at}\ }\infty{\text{with}\ \text{exponent}\ }\tau.\end{equation}
Not every rapidly varying tail is Weibull-like. The assumption that a tail is Weibull-like with exponent  $\tau$ allows one to make more precise statements on the tails of risk variables, as we shall see below.
Fisher’s result was extended in [Reference Davis, Mulrow and Resnick9] to arbitrary dfs F on  $[0,\infty)^d$ by imposing a multivariate regular variation condition on the log-probability of certain risk regions, here the intersections of positive coordinate half-spaces. Similar results were obtained for densities. The authors focus on Weibull-like tails. Their condition (6.4) restricts the class of possible limit sets S.
Recall that convergence of sample clouds onto S consists of two conditions: (1) the sample clouds  $N_n$ should not extend too far beyond S, and (2) they should fill out S. These conditions are formulated in terms of convergence in probability.
The authors of [Reference Kinoshita and Resnick24] give a profound analysis of the theory of limit sets for almost sure convergence. This centres on two basic problems. First, what compact sets are limit sets? Second, given such a limit set S, describe the domain of attraction, the set of all dfs for which the sample clouds converge onto S. Both questions receive a complete answer. The analysis of the domains of attraction is based on a polar-coordinate description of compact star-shaped sets in terms of hypographs of upper semicontinuous functions on compact metric spaces and Vervaat’s theory of extremes for upper semicontinuous functions. The following are simple corollaries of the existence result, Theorem 4.4 in [Reference Kinoshita and Resnick24].
Theorem 1.2. (Kinoshita and Resnick.) For every compact star-shaped set S in  ${\mathbb R}^d$which contains at least two points, there exists a probability distribution on
 ${\mathbb R}^d$such that the sample clouds from this distribution converge onto S almost surely.
Theorem 1.3. (Kinoshita and Resnick.) If the sample clouds converge almost surely onto a compact set S and (1.4) holds, then S is star-shaped, and one may choose  $a_n=L(1/n)$for an unbounded strictly decreasing continuous function
 $L\,:\,(0,1)\to(0,\infty)$which varies slowly at zero.
These results also hold for convergence in probability. Here we sketch the arguments for the second result; for the first see Theorem 1.4 below. Since S contains a point outside the origin, we may assume that this point has a positive vertical coordinate. The projection  $S_d$ of S onto the vertical coordinate is the limit set for samples of the vertical coordinate under the scaling sequence
 $a_n$. So one may apply the univariate theory and choose
 $a_n=L(1/n)$ for a continuous strictly increasing unbounded function L which varies slowly at
 $0^+$. Let
 $\theta\in(0,1)$ and set
 $b_n=L(1/m_n)$ for
 $m_n\in{\mathbb N}$, where
 $L(1/m_n)/L(1/n)\to1/\theta$. Then
 $\{{\mathbf X}_1/b_n,\ldots,{\mathbf X}_n/b_n\}$ converges onto
 $\theta S$, and hence the limit set of the sample clouds
 $N_{m_n}$ contains
 $\theta S$. Since the sample clouds converge, S is star-shaped.
We are interested in unbounded distributions on  ${\mathbb R}^d$ for which the sample clouds converge onto a compact set
 $S\subset{\mathbb R}^d$ containing more than one point. We saw above that the limit set S is star-shaped and the scaling constants
 $a_n$ may be taken to be increasing, unbounded, and slowly varying. We shall give a simple proof of Theorem 1.2 for convergence in probability which works for any increasing sequence of scaling constants for which
 $a_{2n}/a_n\to1$. We begin by formulating a lemma which allows us to determine convergence onto S by considering only the extremal points of S.
Lemma 1.1. Let  ${\mathbf a}\in{\mathbb R}^d$and
 $p\in(0,1)$. If the scaled samples from
 ${\mathbf X}$satisfy
 \begin{equation*}{\mathbb P}\{N_n({\mathbf a}+\epsilon B)<m\}\to0\end{equation*}
for all  $\epsilon>0$and all integers
 $m>1$, then this also holds for
 $p{\mathbf a}$.
Proof. Choose indices  $m=m_n$ such that
 $a_m/a_n\to p$. Observe that
 $N_n((a_m/a_n)({\mathbf a}+\epsilon B))$ counts the number of points with index
 $i\le n$ which fall in
 $a_m({\mathbf a}+\epsilon B)$ and
 $N_m({\mathbf a}+\epsilon B)$ only the points with index
 $i\le m$. Since
 $|a_m/a_n-p|<\epsilon$ for
 $n>n_0$ we conclude
 \begin{equation*}N_m({\mathbf a}+\epsilon B)\le N_n((a_m/a_n)({\mathbf a}+\epsilon B)\le N_n(p{\mathbf a}+2\epsilon B),\qquad n>n_0.\end{equation*}
The left side tends to  $\infty$ in probability. Hence so does the right side.□
Definition 1.3. Let S be a star-shaped set. A point  ${\mathbf e}\in S$ is extremal if
 $t{\mathbf e}\in S^c$ for all
 $t>1$.
Example 1.1. (The porcupine.) Let  $S\subset{\mathbb C}$ be the union of the segments
 $[0,z_n]$, where
 $z_n=e^{i\varphi_n}/n$ for a sequence of angles
 $\varphi_n$ dense in
 $[0,2\pi)$. The
 $z_n$ are extremal. Let N denote a random positive integer for which
 ${\mathbb P}\{N=n\}$ is positive for all
 $n\ge1$, and let V be standard exponential and independent of N. The sequence of independent observations
 $Z_n=V_nz_{N_n}$ is dense in the complex plane; the sample clouds
 $N_n=\{Z_1,\ldots,Z_n\}/a_n$ with scaling
 $a_n=\log n$ converge onto S.
Theorem 1.4. (Existence Theorem.) Let  $a_n$be positive constants increasing to infinity such that
 $a_{2n}/a_n\to1$. Let S be a compact star-shaped set in
 ${\mathbb R}^d$containing at least two points. There exists a probability distribution on
 ${\mathbb R}^d$such that the sample clouds from this distribution with the scaling
 $a_n$converge onto S.
Proof. Let  $L\,:\,(0,1]\to(0,\infty)$ be a continuous strictly decreasing function such that
 $L(1/n)\sim a_n$. The set E of extreme points of S is a subset of the separable metric space
 ${\mathbb R}^d$. Hence there is a sequence
 ${\mathbf e}_1,{\mathbf e}_2,\ldots$ which is dense in E. Define
 ${\mathbf X}=L(U){\mathbf e}_N$, where
 ${\mathbb P}\{N=n\}=1/2^n$ for
 $n\ge1$, and U is uniformly distributed on (0,1) and independent of N.
Samples from L(U) scaled by  $a_n$ converge onto [0, 1] by Gnedenko’s univariate theory, and hence samples from
 $L(U){\mathbf e}$ converge onto the line segment
 $[{\bf0},{\mathbf e}]$ for every extreme point
 ${\mathbf e}$ of S. The union of the line segments
 $[{\bf0}, {\mathbf e}_n]$ is dense in S. By construction
 ${\mathbb P}\{N_n({\mathbf e}_n+\epsilon B)<m\}\to0$ for all n, m, and
 $\epsilon>0$. Hence this holds not only for the points
 ${\mathbf e}_n$ but for all
 ${\mathbf p}\in S$ (by the lemma above, since any ball
 ${\mathbf p}+\epsilon B$ will contain a ball
 $p{\mathbf e}_n+\epsilon B/2$ with
 $p\in(0,1)$).
Let O be an open neighbourhood of S. Since S is compact there exists  $\epsilon>0$ such that
 $S+\epsilon B\subset O$. Let
 $r=\sup_{n=1,2,\ldots}\|{\mathbf e}_n\|$. Any point in
 $N_n\setminus O$ has the form
 $a_n(1+c){\mathbf e}_n$ with
 $c\ge\epsilon/r$ and derives from a value
 $T_i=L(U_i)\ge a_n(1+\epsilon r)$ where
 $i\le n$. By the univariate theory the probability of such a value vanishes for
 $n\to\infty$.□
Finally, we note that convergence onto a set is a geometric concept. For any linear transformation A, the samples from  $A({\mathbf X})$ scaled by
 $a_n$ converge onto A(S) if the samples from
 ${\mathbf X}$ converge onto S with this scaling. In particular, if one deletes the last coordinate of
 ${\mathbf X}$, the sample clouds from the reduced vector converge onto the projection of S onto the horizontal hyperplane. The proof applies more generally.
Theorem 1.5. (Mapping Theorem.) Let the samples from the vector  ${\mathbf X}$ scaled by
 $a_n$ converge onto S. Let
 $H\,:\,{\mathbb R}^d\to{\mathbb R}^m$ be a continuous positive-homogeneous function:
 $H(r{\mathbf x})=rH({\mathbf x})$ for
 $r>0$ and
 ${\mathbf x}\in{\mathbb R}^d$. Then the samples from the vector
 ${\mathbf Y}=H({\mathbf X})$ scaled by
 $a_n$ converge onto
 $T=H(S)$.
Proof. Let  ${\mathbf y}\in T$. There exists a point
 ${\mathbf x}\in S$ such that
 ${\mathbf y}=H({\mathbf x})$. The inverse image of the
 $\epsilon$-ball
 ${\mathbf y}+\epsilon B$ under H is an open neighbourhood of
 ${\mathbf x}$, and
 $H({\mathbf X})/a_n$ lies in
 ${\mathbf y}+\epsilon B$ if and only if
 ${\mathbf X}/a_n$ lies in the inverse image of this ball. Since this inverse image is an open neighbourhood of
 ${\mathbf x}$, the number of such sample points tends to infinity in probability. Similarly the inverse image of an open neighbourhood O of T is an open neighbourhood of S. Homogeneity of H ensures that this open neighbourhood contains all points of the scaled sample
 $\{{\mathbf X}_1,\ldots,{\mathbf X}_n\}/a_n$ if and only if O contains the scaled sample
 $\{{\mathbf Y}_1,\ldots,{\mathbf Y}_n\}/a_n$.□
Knowledge of the scaling sequence  $a_n$ and of the limit set S gives some information about the tails of the underlying distribution, but quite hefty perturbations of the probability distribution can be made without affecting the limit set.
Proposition 1.4. Let  $\pi_0$ and
 $\pi_1$ be probability distributions on
 ${\mathbb R}^d$. Suppose
 $d\pi_1=fd\pi_0$ outside a bounded set, where f is a positive measurable function and
 $\log f$ is bounded. Let
 $a_n$,
 $n\ge1$, be an unbounded sequence of positive constants. If the samples from
 $\pi_0$ scaled by
 $a_n$ converge onto a compact set S, then the samples from
 $\pi_1$ scaled by
 $a_n$ converge onto S.
Strictly convex combinations of probability measures whose samples converge onto limit sets with the same scaling yield probability measures whose samples converge onto the union of these limit sets.
Proposition 1.5. Let  $a_n$,
 $n\ge1$, be an unbounded sequence of positive constants. Let
 $\pi_1,\ldots,\pi_m$ be probability measures on
 ${\mathbb R}^d$ and
 $S_1,\ldots,S_m$ compact sets in
 ${\mathbb R}^d$. Suppose for
 $i=1,\ldots,m$ the samples from
 $\pi_i$ scaled by
 $a_n$ converge onto
 $S_i$. Let
 $c_1,\ldots,c_m$ be positive constants with
 $\sum_{i=1}^m c_i=1$. If the probability measure
 $\pi$ agrees with
 $c_1\pi_1+\cdots+c_m\pi_m$ outside a compact set, then the samples from
 $\pi$ scaled by
 $a_n$ converge onto
 $S=S_1\cup\cdots\cup S_m$.
1.2. Risk variables and risk regions
We now turn to the random variables whose tail behaviour will be studied below. These are continuous positive-homogeneous functions of the vector  ${\mathbf X}$; see (0.1). Continuous positive-homogeneous functions on
 ${\mathbb R}^d$ form an infinite-dimensional linear space, an extension of the d-dimensional space of linear functionals. We are interested in the upper tail and shall restrict attention to variables
 $U=u({\mathbf X})$ where u is nonnegative.
Definition 1.4. A risk variable is a continuous nonnegative positive-homogeneous function of the underlying random vector.
Examples of risk variables include the absolute value of a coordinate,  $U=|X_i|$ (
 $i=1,\ldots,d$); the positive part of a linear combination,
 $U=\xi {\mathbf X} \vee 0$, where
 $\xi$ is a linear functional; the
 $\ell^p$ norm,
 $U=(|X_1|^p+\cdots+|X_d|^p)^{1/p}$, for
 $p\ge1$ as well as for
 $p\in(0,1)$; the
 $\ell^\infty$ norm
 $U=\|{\mathbf X}\|_\infty=\max_{1\le i\le d}|X_i|$; the geometric mean
 $U=(X_1\cdots X_d)^{1/d}$ of the coordinates on the positive orthant; the variable
 $U=\sqrt{{\mathbf X}^T\Sigma{\mathbf X}}$ for a positive definite matrix
 $\Sigma$; and the maximum
 $U=U_1\lor U_2$ of two of the variables above, or the minimum
 $U=U_1\land U_2$.
We collect some basic properties of continuous nonnegative positive-homogeneous functions in the proposition below.
Proposition 1.6. The space  ${\mathcal H}_+={\mathcal H}_+({\mathbb R}^d)$ of all continuous nonnegative positive-homogeneous functions u on
 ${\mathbb R}^d$ has the following properties:
(i)
${\mathcal H}_+$ is a cone: $u,v\in{\mathcal H}_+$ implies $ru+sv\in{\mathcal H}_+$ for $r,s\ge0$.(ii)
${\mathcal H}_+$ is closed for finite maxima: $u,v\in{\mathcal H}_+$ implies $u\lor v\in{\mathcal H}_+$.(iii)
${\mathcal H}_+$ is closed for finite minima: $u,v\in{\mathcal H}_+$ implies $u\land v\in{\mathcal H}_+$.(iv)
$u_1,\ldots,u_m\in{\mathcal H}_+({\mathbb R}^d)$ and $v\in{\mathcal H}_+({\mathbb R}^m)$ implies $z=v(u_1,\ldots,u_m)\in{\mathcal H}_+({\mathbb R}^d)$.(v) If
$u_n\in{\mathcal H}_+$ converge uniformly on an open $\epsilon$-ball $\epsilon B$ to a function u on $\epsilon B$, there exists $u_0\in{\mathcal H}_+$ such that $u_n\to u_0$ holds uniformly on every open ball rB, $r>1$.


Risk variables may be used to specify loss functions. In particular, for a given risk variable  $U=u({\mathbf X})$, one may define occurrence of a catastrophic loss as
 ${\mathbf{1}}_{\{U>r\}}$ for some large r. The loss occurs if the sample point
 ${\mathbf X}$ falls in the risk region
 $R=\{u>r\}$.
Recall that  ${\mathbb R}^d$ is the state space and that
 ${\mathbf X}_n$ is the state of the system at time index n. A reasonable assumption is that the sequence
 $\{{\mathbf X}_n\}_{n\in{\mathbb Z}}$ is stationary. The present paper investigates the situation for i.i.d. sequences. There is a central region where the states are safe, viable, healthy, robust, secure. There may be regions far out where the states are risky, imperilled, exposed, lethal, vulnerable. If a point
 ${\mathbf X}_n$ falls in such a risk region, action should be taken. If a given state lies in a risk region, then so do states farther out. Thus a risk region R is an open set in the state space which has the property that
 ${\mathbf x}\in R$ implies
 $t{\mathbf x}\in R$ for
 $t>1$. This may be written concisely as
 $tR\subset R$ for all
 $t>1$. We shall tighten this condition slightly in the definition below. Note that
 ${\bf0}\in R$ implies that R is the whole state space. We exclude this case and assume that there exist safe states: the complement of R is non-empty.
Definition 1.5. A risk region is an open set R in  ${\mathbb R}^d$ which does not contain the origin and which satisfies
 \begin{equation}cl(tR)\subset R\qquad\forall t>1.\end{equation}
Let C be a proper open convex cone. This is not a risk region, but  ${\mathbf p}+C$ is for any point
 ${\mathbf p}\in C$. The union of two risk regions is a risk region, and so is the intersection.
There is an alternative criterion for a set to be a risk region, which is simpler to verify since one need only check it on rays.
Proposition 1.7. The open set R is a risk region if and only if cl(R) does not contain the origin and if
 \begin{equation} {\mathbf p}\in\partial R\quad\Rightarrow\quad t{\mathbf p}\in R,\quad t>1. \end{equation}
Proof. The definition implies that the origin does not lie in the closure of R, since it would then lie in the risk region  $R/2$ by (1.6). Now assume (1.6) and let
 ${\mathbf p}\in\partial R$,
 ${\mathbf p}\not={\bf0}$, and
 $t>1$. Then
 ${\mathbf p}\in \text{cl}(R)$; hence
 $t{\mathbf p}$ lies in
 $\text{cl}(tR)$, hence in R by (1.6). This proves (1.7). Conversely, if
 $t{\mathbf p}\in \text{cl}(tR)$ for
 $t>1$ then
 ${\mathbf p}\in \text{cl} R$. If
 $t{\mathbf p}\in tR$ then
 ${\mathbf p}\in R$, but also if
 $t \mathbf{p} \in \partial (tR)$ by (1.7). This proves (1.6).□
With a risk variable  $U=u({\mathbf X})$ one may associate a risk region, the open set
 $R=R_u= \{u>1\}$. This map from
 $u({\mathbf X})$ to
 $R_u$ is monotone: smaller risk variables have smaller risk regions. In particular, the risk region associated with the minimal risk variable,
 $U\equiv0$, is the empty set.
Risk regions have a geometric description; risk variables are defined analytically. There is a one-to-one correspondence between risk regions and risk variables. This allows us to switch from one to the other using geometric arguments for risk regions and analytic arguments for risk variables. Observe, in particular, that continuity of the function u corresponds to the simple geometric condition (1.6) for the risk region  $R=\{u>1\}$.
Theorem 1.6. If u is a nonnegative continuous positive-homogeneous function, then  ${R=\{u>1\}}$ is a risk region. Conversely, a risk region R determines a unique continuous nonnegative positive-homogeneous function u on
 ${\mathbb R}^d$ such that
 $R=\{u>1\}$.
Proof. It is clear that  $\{u>1\}$ is a risk region if u is a nonnegative continuous positive-homogeneous function on
 ${\mathbb R}^d$. Now let R be a non-empty risk region and define u by the level sets
 $\{u>r\}=rR$. The function u does not vanish identically; it is continuous since it is continuous on the unit sphere. This is shown as follows. Let
 ${\mathbf e}_n\in\partial B$ converge to
 ${\mathbf e}_0$. Set
 $u_n=u({\mathbf e}_n)$. Then
 ${\mathbf e}_n/u_n\in\partial R$ if
 $u_n\not=0$. The sequence
 $u_n$ is bounded since the closure of R does not contain the origin. We may assume that
 $u_n\to u_*\in[0,\infty)$, taking a subsequence if necessary. If
 $u_*$ is positive then
 ${\mathbf x}_n={\mathbf e}_n/u_n$ are boundary points of R. Since this sequence is bounded, the limit
 ${\mathbf e}_0/u_*$ also is a boundary point. But so is
 $\mathbf{e}_0/u_0$. Then (1.7) ensures that
 $u_*=u_0$. If
 $u_0$ is positive then
 $2{\mathbf e}_0/u_0$ is an interior point of R, and
 $1/u({\mathbf p})<2/u_0$ for
 ${\mathbf p}\in\partial B\cap u_0R/2$ implies
 $u_*\ge u_0/2$. Hence
 $u_*=u_0$ as above, and moreover
 $u_*=0$ implies
 $u_0=0$.□
Define a metric on  ${\mathcal H}_+$ by setting
 \begin{equation*}d(u,v)=\max_{\|{\mathbf x}\|\le 1}\ |u({\mathbf x})-v({\mathbf x})|.\end{equation*}
This metric is the restriction to  ${\mathcal H}_+$ of a norm on the linear space of all continuous positive-homogeneous functions on
 ${\mathbb R}^d$. By homogeneity
 $u_n\to u_0$ if and only if
 $u_n$ converges to
 $u_0$ uniformly on all compact sets in
 ${\mathbb R}^d$. The space
 ${\mathcal H}_+$ with this metric is complete; see Proposition 1.6(v).
We can now formulate a basic result on the asymptotic behaviour of partial maxima of risk variables.
Theorem 1.7. (Convergence Theorem.) Let  ${\mathbf X}$ be a random vector and
 $a_n$ an unbounded sequence of positive constants. Suppose the samples from
 ${\mathbf X}$ scaled by
 $a_n$ converge onto the compact set S. Let
 $u_n\in{\mathcal H}_+$ for
 $n=0,1,2,\ldots$. If
 $u_n\to u_0$ then the maximum of n independent observations of
 $u_n({\mathbf X})$ scaled by
 $a_n$ converges in probability to
 $u_0^*=\max u_0(S)$.
Proof. We first prove convergence for a fixed  $u\in{\mathcal H}_+$. Let
 $N_n$ denote the random sample of size n from
 ${\mathbf X}$ scaled by
 $a_n$. The maximum of n independent observations of U scaled by
 $a_n$ is
 $\max u(N_n)$. Let
 $R=\{u>u^*\}$. If
 $u^*$ is positive then R is a risk region which abuts S, and the events ‘the scaled sample
 $N_n$ intersects qR’ and ‘
 $\max u(N_n)>qu^*$’ agree. The probability of the first goes to zero for
 $q>1$ and to one for
 $q\in(0,1)$. If
 $u^*=0$, then u vanishes on S, and for any
 $\epsilon>0$ the set
 $\{u<\epsilon\}$ is an open neighbourhood of S; the probability that
 $N_n$ lies in this open set goes to one. Hence, so does the probability that the scaled maximum of the samples from U lies in the interval
 $[0,\epsilon)$. Now consider a sequence
 $u_n\to u_0$. Let
 $r_0$ be so large that
 $S\subset r_0B$, and let
 $N^{\prime}_n$ be the restriction of the scaled sample
 $N_n$ to
 $r_0B$. The uniform convergence
 $u_n\to u_0$ on
 $r_0B$ implies that
 $\max u_n(N^{\prime}_n)\to u_0^*$ if this holds for
 $\max u_0(N^{\prime}_n)$. Since
 ${\mathbb P}\{N^{\prime}_n\not= N_n\}\to0$, the second limit relation holds for
 $N^{\prime}_n$, and thus the first holds for
 $N_n$.□
Definition 1.6. A continuous unimodal positive function f on  ${\mathbb R}^d$ is homothetic if all level sets
 $\{f>c\}$,
 $0<c<f({\bf0})$, have the same shape.
Suppose S is a compact star-shaped set in  ${\mathbb R}^d$ and the complement is a risk region. The function
 $u=r_S\in{\mathcal H}_+$ associated with this risk region satisfies
 $\{u\le1\}=S$. It is called the gauge function of S since
 $u({\mathbf x})=\inf\{r>0\mid {\mathbf x}\in rS\}$. If S is convex and invariant under the reflection
 ${\mathbf x}\mapsto-{\mathbf x}$, then u is a norm and S the closed unit ball of this norm. Let
 $f_0$ be a positive strictly decreasing continuous function on
 $[0,\infty)$ and set
 $f({\mathbf x})=f_0(r_S({\mathbf x}))$. There is a simple formula for the integral:
 \begin{equation}J=\int f({\mathbf x})d{\mathbf x}=|S|\int r^d|df_0(r)|=|S|\int_0^\infty f_0(r)dr^{d-1}dr.\end{equation}
If the generator  $f_0$ varies rapidly then f is integrable. Let
 ${\mathbf X}_1, {\mathbf X}_2, \ldots$ denote independent observations from the associated probability density
 $f/J$.
Proposition 1.8. There exist  $a_n>0$ such that the intensity
 $f_n(u)=a_n^df_0(r_S(a_n{\mathbf u}))/C$ of the sample clouds
 $N_n=\{{\mathbf X}_1,\ldots,{\mathbf X}_n\}/a_n$ satisfies
 $f_n\equiv1$ on
 $\partial S$. The sample clouds
 $N_n$ converge onto S.
Proof. The function  $g_0(r)=r^df_0(r)/J>0$ varies rapidly and is continuous. Let
 $g_0(a)=\delta>0$. For any integer
 $n>1/\delta$ there exists
 $a_n>a$ such that
 $g_0(a_n)=1/n$. Let
 $\delta_0=\max g_0$. The sample cloud
 $N_n$ has intensity
 \begin{equation*}f_n({\mathbf u})=na_n^df(a_n{\mathbf u})/C=ng_0(r_S(a_n{\mathbf u})),\end{equation*}
and  $f_n({\mathbf u})=ng_0(a_n)=1$ for
 ${\mathbf u}\in\partial S$ and
 $n>1/\delta_0$. By rapid variation of
 $g_0$, for any interior point
 ${\mathbf u}$ of S the sequence
 $f_n({\mathbf u})$ tends to infinity, and
 $f_n({\mathbf u})\to0$ for any
 ${\mathbf u}\in S^c$. Rapid variation of
 $g_0$ ensures that the integral
 $J_r$ of f over the rim
 $2rS\setminus rS$ varies rapidly for
 $r\to\infty$. Since for any
 $q\in(1,2)$ the integral of
 $f_n$ over the rim
 $2qS\setminus qS$ vanishes for
 $n\to\infty$, so does the integral over
 $qS^c$.□
2. Tail coherence
Traditional multivariate extreme value theory of componentwise maxima uses componentwise normalizations. Tails of the margins are unrelated. Margins may lie in different domains of attraction. The more geometric theory treated in the present paper is based on scalar transformations. As a result the decrease in the tails of the different components is governed by the same sequence of scaling constants. Not only the tails of the components but also the tails of risk variables are related. This tail coherence will be investigated in the present section. It is well expressed in the main result: standardized risk variables have the same upper quantiles up to asymptotic equality.
Theorem 2.1. (Tail coherence.) Suppose the random samples of  ${\mathbf X}$ scaled by the unbounded sequence
 $a_n$ converge onto S for a compact set S containing more than one point. For any risk variable
 $U=u({\mathbf X})$, the upper quantiles
 $u_n$ by definition satisfy
 ${\mathbb P}\{U>u_n\}\le 1/n\le{\mathbb P}\{U\ge u_n\}$. In addition,
 \begin{equation}u_n/a_n\to u^*=\max u(S).\end{equation}
Proof. We may assume that U is a standardized risk variable,  $u^*=1$. If
 $u^*$ is positive, apply scaling; if
 $u^*$ vanishes, a monotonicity argument yields the desired result. So let F denote the df of the standardized risk variable
 $U=u({\mathbf X})$. We have to show that
 $M_n$, the partial maxima of a sequence of independent observations from F scaled by
 $a_n$, converge to the constant 1 in probability. This implies that the
 $(1-1/n)$-quantiles
 $u_n$ of F are asymptotically equal to
 $a_n$. For a standardized risk variable, the risk region
 $R=\{u>1\}$ abuts S. Let
 $q>1$. The closure of qR is disjoint from S, and hence
 \begin{equation*}{\mathbb P}\{M_n>q\}={\mathbb P}\{N_n(qR)>0\}\to0.\end{equation*}
Similarly,
 \begin{equation*}{\mathbb P}\{M_n>1/q\}={\mathbb P}\{N_n(R/q)>0\}\to1\end{equation*}
since  $R/q$ contains a boundary point of S.□
For heavy tails—more precisely, tails which vary regularly with positive exponent—asymptotic equality of the quantiles is equivalent to asymptotic equality of the tails. For light tails, asymptotic equality of the tails is a more stringent condition. Asymptotic equality of the upper quantiles may be expressed in terms of the tails as quantile equivalence.
Definition 2.1. The dfs  $F_1$ and
 $F_2$ have quantile equivalent tails if for all
 $q>1$ eventually
 \begin{equation}(1-F_1)(qx)<(1-F_2)(x)<(1-F_1)(x/q).\end{equation}
Example 2.1. The gamma distributions with density  $x^{\gamma-1}e^{-x}/\Gamma(\gamma)$,
 $\gamma>0$, are quantile equivalent to the standard exponential distribution, and so are the discrete distributions on
 $\{0,1,4,9,\ldots\}$ with mass
 $p_n\sim e^{-n^2}$ in
 $n^2$ for
 $n\to\infty$. Note that the gamma distributions lie in the domain of attraction of the Gumbel distribution for maxima, but the discrete distributions do not, since
 $p_{n+1}/p_n\to0$.
Remark 2.1. For any df F whose tail varies rapidly at  $\infty$, there exists a continuous strictly increasing df
 $F_0$ on
 $[0,\infty)$ which vanishes at zero and whose tail is quantile equivalent to
 $1-F$.
Remark 2.2. For any df F on  $[0,\infty)$ whose tail varies rapidly at
 $\infty$, there exists a df
 $F_0$ with quantile equivalent tail whose tail decays exponentially. See Appendix B in [Reference Dekkers and de Haan14].
We write  $f\ll g$ for functions f and g if
 $f(r)/g(r)\to 0$ as
 $r\to\infty$.
Proposition 2.1. Let the risk regions  $R_1$ and
 $R_2$ abut S. Let
 $q>1$. Then
 \begin{equation}{\mathbb P}\{{\mathbf X}\in qrR_1\}\ll {\mathbb P}\{{\mathbf X}\in rR_2\},\qquad r\to\infty.\end{equation}
Proof. The dfs  $F_i$,
 $i=1,2$, of the risk variables
 $U_i=u_i({\mathbf X})$ with level set
 $\{u_i>1\}=R_i$ have quantile equivalent tails which vary rapidly by tail coherence. Hence
 ${(1-F_1)(qr)<(1-F_2)(\sqrt qr)}$ eventually. Rapid variation gives
 \begin{equation*}(1-F_2)(\sqrt qr)/(1-F_2)(r)\to0.\end{equation*}
This result shows that the probability of rR far out for risk regions R which abut S depends on r rather than R. For Weibull-like tails, the log-probabilities of rR for different risk regions R which abut S are asymptotically equal. How much variation is there in the probability of rR for fixed large r when R varies over risk regions which abut the limit set S? In the example below the limit set is the closed unit disk in the plane and  $a_n=\sqrt{2\log n}$. The tails are Weibull-like,
 $1-F=e^{-T}$ with
 $T(r)\sim r^2/2$.□
Example 2.2. If S is the closed unit disk, the complement is a risk region and abuts S. The same holds for the half-plane  $\{y>1\}$, the sector
 $\{y>1+|x|\}$, and the cusp
 $\{y>1+\sqrt{|x|}\}$. Call these risk regions
 $R_1, R_2, R_3, R_4$. The number of points from the scaled sample
 $N_n$ which fall in
 $R_i$ is determined by the underlying probability distribution
 $\pi$. Suppose
 $a_n=\sqrt{2\log n}$. This scaling sequence implies a Weibull-like tail with
 $T(r)\sim r^2/2$. Since the four regions
 $R_i$ all abut the limit set S, the log-probabilities of
 $rR_i$ are asymptotically equal to
 $-r^2/2$. If
 $\pi$ is standard Gaussian then
 \begin{equation*}p_4(r)\ll p_3(r)\ll p_2(r)\ll p_1(r)\end{equation*}
for  $r\to\infty$. Convergence onto the unit disk does not imply that the underlying distribution is circle-symmetric. Take a fair mixture of the Gaussian distribution and a probability distribution concentrated on the positive vertical axis with density
 $2y^2e^{-y^2/2}/\sqrt{2\pi}$. The limit set is not affected but the probability of the cusp now is asymptotically equal to the probability of
 $rS^c$.
Set  $r_n=a_{2^n}$. If the sequence
 $N_n=\{{\mathbf X}_1,\ldots,{\mathbf X}_n\}/a_n$ converges onto the deterministic set S, then both
 $\{{\mathbf X}_1,\ldots,{\mathbf X}_{2^n}\}/r_n$ and
 $\{{\mathbf X}_{2^n+1},\ldots,{\mathbf X}_{2^{n+1}}\}/r_n$ are close to S, and hence so is their union. This implies that
 $r_{n+1}/r_n\to1$. Asymptotic equality,
 $r_{n+1}/r_n\to1$, is equivalent to the condition that
 $a_n$ is asymptotically equal to
 $L_0(1/n)$ for a function
 $L_0$ which varies slowly at zero.
Let  $r_n\sim r(n)$ for a continuous strictly increasing function r which maps
 $(0,\infty)$ onto itself. There exists a unique df
 $F_0$ such that r(t) is the
 $(1-1/2^t)$-quantile:
 $1-F_0(r(t))=1/2^t$. Write
 $1-F_0=e^{-T}$. Then
 $T(r(t))=t\log 2$. Thus r is the inverse function of
 $T/\log2$. The df
 $F_0$ has a Weibull-like tail with exponent
 $\tau\in(0,\infty)$ if and only if r varies regularly with exponent
 $1/\tau\in(0,\infty)$. For Weibull-like tails with
 $1-F=e^{-T}$ there is a simple description of tail coherence in terms of log-probabilities.
Proposition 2.2. Let the standardized risk variable  $U=u({\mathbf X})$ have Weibull-like tail
 ${\mathbb P}\{U>u\}=e^{-T(u)}$, where T varies regularly with exponent
 $\tau\in(0,\infty)$. For any risk region R which abuts the limit set S,
 \begin{equation}-\log{\mathbb P}\{{\mathbf X}\in rR\}\sim T(r),\qquad r\to\infty.\end{equation}
There is a simple characterization of Weibull-like tails in terms of the sequence  $r_n=a_{2^n}$.
Proposition 2.3. Suppose the sample clouds  $\{{\mathbf X}_1,\ldots,{\mathbf X}_n\}/a_n$ converge onto a compact set S which contains more than one point. Let
 $r_n\sim a_{2^n}\to\infty$. If
 $r_{2n}/r_n\to c_2$ and
 $r_{3n}/r_n\to c_3>1$, then the standardized risk variables have Weibull-like tails.
Proof. There exists a strictly increasing continuous function r mapping  $(0,\infty)$ onto itself such that
 $r(n)\sim r_n$. This function satisfies
 $r(2t)/r(t)\to c_2$ and
 $r(3t)/r(t)\to c_3$. This implies regular variation with exponent
 $\lambda\in[0,\infty)$, since r is increasing and
 $\log2/\log3$ is irrational. Moreover
 $c_3=3^\lambda$. Thus
 $c_3>1$ implies
 $\lambda=1/\tau>0$.□
Tail coherence also exists in the case of multivariate regular variation. There the sample clouds converge in distribution to a Poisson point process N weakly on the complement of the ball  $\epsilon B$ for every
 $\epsilon>0$. The mean measure
 $\nu$ of the Poisson point process satisfies the symmetry conditions
 \begin{equation*}\nu(rA)=\nu(A)/r^\lambda,\qquad r>0, \quad A\ {\text{a}\ \text{Borel}\ \text{set}\ \text{in}\ }{\mathbb R}^d,\end{equation*}
where  $-\lambda<0$ is the exponent of regular variation. Define a risk variable
 $U=u({\mathbf X})$ to be standardized if
 $\nu\{u>1\}=1$. For any standardized risk variables
 $U=u({\mathbf X})$ and
 $V=v({\mathbf X})$,
 \begin{equation*}{\mathbb P}\{U>r\}\sim{\mathbb P}\{V>r\},\qquad r\to\infty.\end{equation*}
See Theorem 17.4 in [Reference Balkema and Embrechts1].
For Weibull-like tails the log-probabilities of risk regions are comparable.
Theorem 2.2. Let the sample clouds from  ${\mathbf X}$ converge onto S, and let
 $ R_1$ and
 $R_2$ be two risk regions. Define
 \begin{equation*}r_i = \sup\{r>0\mid rS\cap R_i=\emptyset\}>0,\qquad i=1,2.\end{equation*}
Suppose  $r_1$ or
 $r_2$ is finite and
 ${\mathbf X}$ has Weibull-like tails with exponent
 $\tau>0$. Then
 \begin{equation}\log{\mathbb P}\{{\mathbf X}\in rR_1\}/\log{\mathbb P}\{{\mathbf X}\in rR_2\}\to (r_2/r_1)^\tau,\qquad r\to\infty.\end{equation}
Proof. The constants  $r_1$ and
 $r_2$ are positive. First assume both are finite. Let
 $U_i$ be the standardized risk variable associated with
 $Q_i=R_i/r_i$, and let T be a continuous strictly increasing function which varies regularly with exponent
 $\tau>0$, such that
 $-\log{\mathbb P}\{V>t\}\sim T(t)$ holds for all standardized risk variables V. Then
 \begin{equation*}-\log{\mathbb P}\{{\mathbf X}\in rR_i\}=-\log{\mathbb P}\{U_i>r/r_i\}\sim T(r/r_i)\sim T(r)/(r_i)^\tau,\qquad r\to\infty\qquad i=1,2.\end{equation*}
If one of the constants is infinite, say  $r_1=\infty$, the limit in (2.5) is less than
 ${(r_2/n)^\tau}$ for all n.□
3. Intermediate tail dependence
This section investigates the dependence between extreme values of two risk variables. What is the role of the shape of the limit set in the dependence?
Definition 3.1. Suppose the margins of (X, Y) are continuous at their upper endpoints. Let  $x_\alpha$ and
 $y_\alpha$ denote upper
 $(1-\alpha)$-quantiles of X and Y. If
 \begin{equation}\gamma(\alpha)={\mathbb P}\{X>x_\alpha, Y>y_\alpha\}/\alpha\to\gamma,\qquad \alpha\to0^+,\end{equation}
then  $\gamma$ is the coefficient of tail dependence for (X, Y). If
 $\gamma$ vanishes, X and Y are tail independent.
Sibuya [Reference Sibuya28] used the notion of a copula to define ‘asymptotic dependence’. Geffroy [Reference Geffroy19], [Reference Geffroy20] observes that the condition
 \begin{equation*}{\mathbb P}\{X>x, Y>y\}/({\mathbb P}\{X>x\}+{\mathbb P}\{Y>y\})\to0,\qquad x,y\to\infty,\end{equation*}
implies tail independence. He distinguishes several forms of asymptotic dependence for sequences of partial maxima. Like Sibuya, he proves that X and Y are tail independent if (X, Y) has a bivariate Gaussian density, whatever the correlation. The term ‘tail independent’ in the sense of the definition above was used in [Reference Cline7, Example 1]. In [Reference Joe23, Property 6], the term ‘upper tail dependence’ is used for copulas.
Copulas play a crucial role in the theory of multivariate extremes. The assumption of continuous margins is innocuous if one assumes that the margins lie in the domain of attraction of an extreme value limit law. For limit sets, copulas may not be of much use, as the example below shows.
Example 3.1. Suppose (X, Y) has standard exponential margins and the samples scaled by  $a_n=\log n$ converge onto a compact set S. Define discrete variables
 $\tilde X$ and
 $\tilde Y$ by setting
 $\tilde X=n^2$ for
 $n^2\le X<(n+1)^2$ and
 $\tilde Y=n^3$ for
 $n^3\le Y<(n+1)^3$, for
 $n\ge0$. Since
 $\tilde X$ is asymptotic to X and
 $\tilde Y$ to Y, the random samples from
 $(\tilde X, \tilde Y)$ scaled by
 $\log n$ converge onto S. The copula of
 $(\tilde X, \tilde Y)$ lives on the lattice created by intersection of the horizontal lines
 $y=1-\eta_n$ and the vertical lines
 $x=1-\xi_n$, where
 $\xi_n$ is asymptotically equal to
 $e^{-n^2}$ and
 $\eta_n$ to
 $e^{-n^3}$. It is not clear how one should describe the asymptotic behaviour of this copula at the upper right corner of the unit square.
If the partial coordinate-wise sample maxima from (X, Y) have a nondegenerate limit distribution, then independence of the coordinates of the limit vector is equivalent to tail independence of (X, Y). If the limit distribution has standard Gumbel margins, the exponent measure  $\nu$ has standard exponential margins and the coefficient of tail dependence is
 $\gamma=\nu((0,\infty)^2)$.
Tail independence is related to the shape of the limit set. Let  ${\mathbf s}=\max S$ denote the coordinate-wise maximum of the points in the limit set S of the scaled random samples of vector (X, Y). By Theorem 4.1 in [Reference Balkema and Nolde3],
 \begin{equation}X{\ \text{and}\ }Y{\text{are}\ \text{tail}\ \text{dependent}\ }\quad\Rightarrow\quad{\mathbf s}=\max(S)\in S.\end{equation}
The converse need not hold. See [Reference Balkema and Nolde4] and [Reference Balkema and Nolde3].
British statisticians, including Tawn, Ledford, Heffernan, and others, were interested in applications and realized in the early 1990s that there exist gradations of tail independence. A coefficient which would help to distinguish different rates of tail independence was sorely needed. In the case of independent margins, the probability  ${\mathbb P}\{U>1-r, V>1-r\}$, where U and V have standard uniform margins, equals
 $r^2$. If instead this joint exceedance probability varies regularly with exponent
 $\lambda\ge1$, the exponent
 $\lambda$ may be regarded as a coefficient for distinguishing different rates of tail independence. (See (5.3) in [Reference Ledford and Tawn25].) The inverse of this exponent has been called the residual tail dependence in a preprint of [Reference Hashorva22] cited in [Reference Frick18] and ‘extreme residual dependence’ in [Reference De Haan and Zhou11]. Residual tail dependence was introduced (with a different meaning) in the thesis [Reference Frick18], where the author observes in the introduction: ‘Because in important cases tail independence is attained at a very slow rate, the residual dependence structure plays a significant role.’ Recall that regular variation with exponent
 $\lambda\in[0,\infty]$ at zero of a positive function
 $\varphi$ implies that the function
 $t\to\log\varphi(e^t)$ is equal to the sum of a
 $C^1$ function whose derivative tends to
 $\lambda$ and a function which tends to zero; see [Reference Bingham, Goldie and Teugels6, Theorem 1.8.2]. It follows that
 $\log(\varphi(r))/\log(r)\to\lambda$.
Definition 3.2. Suppose the margins of (X, Y) are continuous at their upper endpoints. Let  $x_\alpha$ and
 $y_\alpha$ denote the upper
 $(1-\alpha)$-quantiles of X and Y. If
 \begin{equation}\frac{-\log{\mathbb P}\{X>x_\alpha, Y>y_\alpha\}}{-\log\alpha}\to\lambda\in[1,\infty],\qquad \alpha\to0^+,\end{equation}
then  $\lambda$ is the coefficient of intermediate tail dependence for (X, Y).
For bivariate Gaussian densities, there is a simple link between the coefficient of intermediate tail dependence of the components and the correlation:  $\rho=1-2/\lambda$ (see [Reference Ledford and Tawn25]). We find it convenient to define the coefficient of intermediate tail dependence to lie in
 $[1,\infty]$ to distinguish it from the coefficient
 $\gamma\in[0,1]$ of (extreme) tail dependence. The significance of the term ‘intermediate’ as opposed to ‘extreme’ will become clear in the next section. A finite value of
 $\lambda$ in (3.3) does not imply regular variation of
 $\gamma(\alpha)$ in (3.1).
3.1. Intermediate tail dependence and the shape of the limit set
The paper [Reference Nolde27] gives a simple geometric recipe for the coefficient  $\lambda$ of intermediate tail dependence for bivariate random vectors with Weibull-like tails when the limit set is the complement of a risk region. In the theorem below this recipe is used to determine the coefficient of intermediate tail dependence for pairs of standardized risk variables. No conditions are imposed on the limit set. The risk variables have tails
 $e^{-T}$ with
 $T\sim T_0$ for a function
 $T_0$ which varies regularly with exponent
 $\tau\in[0,\infty]$.
Theorem 3.1. Let the sample clouds from  ${\mathbf X}$ converge onto S, and let (1.4) hold. Let
 $U=u({\mathbf X})$,
 $V=v({\mathbf X})$, and
 $W=w({\mathbf X})$ be risk variables, and assume
 $u^*=\max u(S)$,
 $v^*=\max v(S)$ are positive and
 $\max w(S)=1$. Let
 ${\mathbb P}\{W>t\}=e^{-T(t)}$ for
 $t>0$. Let R denote the risk region
 $\{u>u^*, v>v^*\}$, and let
 $r_*=\sup\{r\mid rS\cap R=\emptyset\}$. Let
 $u_\alpha$ and
 $v_\alpha$ for
 $\alpha\in(0,1)$ denote upper
 $(1-\alpha)$-quantiles of U and V.
(1) If the closure of R is disjoint from S, then U and V are tail independent:
\begin{equation*}{\mathbb P}\{U>u_\alpha, V>v_\alpha\}/\alpha\to0,\qquad \alpha\to0^+.\end{equation*}(2) If T varies regularly with exponent
$\tau\in(0,\infty)$, the limit $\lambda$ in (3.3) exists and $\lambda=r_*^\tau$:
(3.4)
\begin{equation}\log{\mathbb P}\{U>u_\alpha, V>v_\alpha\}/\log\alpha\to r_*^\tau,\qquad\alpha\to0^+.\end{equation}(3) If T varies slowly and
$r^*\in[1,\infty)$, then
for
\begin{equation*}\log{\mathbb P}\{U>u_\alpha, V>v_\alpha\}/\log\alpha\to1\end{equation*}$\alpha\to0^+$.(4) If T varies rapidly and
$r_*\in(1,\infty]$, then
for
\begin{equation*}\log{\mathbb P}\{U>u_\alpha, V>v_\alpha\}/\log\alpha\to\infty\end{equation*}$\alpha\to0^+$.


Proof. First observe that  $u^{\prime}_\alpha=u_\alpha/c$ is a
 $(1-\alpha)$-quantile of
 $U'=U/c$ if
 $u_\alpha$ is a
 $(1-\alpha)$-quantile of U. Hence, we may assume that U and V are standardized. Let
 $Z=z({\mathbf X})$ denote the risk variable associated with risk region R. Then
 $R=\{z>1\}=\{u\land v>1\}$ and hence
 $z=u\land v$.
(1) The sets
$\{u>1\}$ and $\{v>1\}$ are disjoint from S. Hence so is their intersection. If S and the closure of R are disjoint, then $r_*>1$. The risk variables U, V, and $r_*Z$ are standardized, and hence, by Theorem 1.4, their $(1-\alpha)$-quantiles $u_\alpha$, $v_\alpha$, and $r_*z_\alpha$ are asymptotically equal for $\alpha\to0^+$. Let $1<q<r_*$. Then $qz_\alpha<u_\alpha$ and $qz_\alpha<v_\alpha$ eventually, and hence, for $\alpha$ close to zero,
by rapid variation of the tail of the risk variable Z.
\begin{equation*}{\mathbb P}\{U>u_\alpha, V>v_\alpha\}\le{\mathbb P}\{U>qz_\alpha, V>qz_\alpha\}={\mathbb P}\{Z>qz_\alpha\}\ll {\mathbb P}\{Z>z_\alpha\}=\alpha\end{equation*}(2) Let
$q_1<r_*<q_2$. The event $\{U>u_\alpha, V>v_\alpha\}$ is enclosed between $\{Z>q_iz_\alpha\}$, $i=1,2$, eventually, as in (1). Apply (2.5) to obtain the convergence
This holds for all
\begin{equation*}\log{\mathbb P}\{Z>q_iz_\alpha\}/\log\alpha=\log{\mathbb P}\{Z>q_iz_\alpha\}/\log{\mathbb P}\{Z>z_\alpha\}\to q_i^\tau,\quad\alpha\to0^+,\quad i=1,2.\end{equation*}$q_1<r_*<q_2$ and implies convergence of
to
\begin{equation*}\log{\mathbb P}\{U>u_\alpha, V>v_\alpha\}/\log\alpha\end{equation*}$r_*^\tau$. For $r_*=\infty$, it suffices to use the inequality $q_1<r_*$.(3) The proof here proceeds in the same way as the proof of (2) for finite
$r_*$.(4) Let
$1<q<r_*$. Then $r_*z_\alpha\sim u_\alpha\sim v_\alpha$ implies, as in (1),
eventually. Rapid variation of the function T gives the limit above.□
\begin{equation*}{\mathbb P}\{U>u_\alpha, V> v_\alpha\}\le{\mathbb P}\{Z>q z_\alpha\}=e^{-T(q z_\alpha)}\end{equation*}


Similar results hold for any finite set of risk variables. The risk region R is the intersection of the risk regions  $R_i=\{u_i>\max u_i(S)\}$, and
 \begin{equation*}\log{\mathbb P}\{U_1>u_{1\alpha},\ldots, U_m>u_{m\alpha}\}/\log\alpha\to r_*^\tau,\qquad\alpha\to0^+.\end{equation*}
3.2. The contribution of shape
The remainder of this section is devoted to an example which shows that it is advisable to take a geometric point of view and use the limit set rather than the coefficient of intermediate tail dependence in evaluating the probability of risk regions.
We change our point of view and consider a fixed region, the half-plane  $H=\{y+3x>14\}$ from the introduction, and four bivariate distributions. In each case the components X and Y have tails asymptotically equal to those of the standard Gaussian df. The distributions are symmetric: (X, Y) has the same distribution as
 $({-}X,-Y)$ and as (Y, X). The sample clouds with the scaling
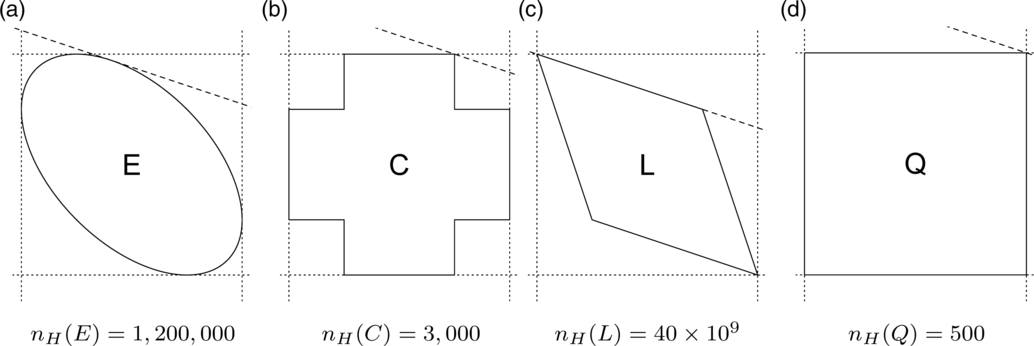
 $a_n=\sqrt{2\log n}$ converge onto a compact set. The shapes of the four limit sets are an ellipse E, a cross C, a lozenge L, and a square Q; see Figure 2. The first three limit sets yield the same coefficient of intermediate tail dependence. We are interested in the following question: how much extra information does the shape give us about the risk of a sample point falling in a half-plane H far off? In the example,
 $H=\{y+3x>14\}$. We shall determine
 $n_H$ for the four distributions. Here
 $n_H$ is the smallest integer for which
 $a_nS$ intersects H. One may think of
 $n_H$ as an indication of the sample size for which there is a reasonable chance of a point falling in H. The difference in the values of
 $n_H$ in the four examples in the figure below shows that shape matters.
Limit sets  $S=E,C,L,Q$ and the numbers
 $n_H(S)$. The first three have the same coefficient of intermediate dependence,
 $\lambda=4$. The dotted lines are the coordinate lines
 $x=\pm1$ and
 $y=\pm1$. The dashed line is the tangent to S parallel to the boundary of the risk region
 $H=\{x+3y>14\}$.

Tail coherence implies that all standardized risk variables have Weibull-like tails with exponent  $T(t)\sim t^2/2$. This also holds for the margins. By Theorem 3.1, the coefficient of intermediate tail dependence for (X, Y) is
 $\lambda=1/r_*^2=4$ for the limit sets
 $S=E,C,L$, since the risk region
 $R=\{x>1,y>1\}$ abuts
 $r^*S$ for
 $r^*=2$. For the square,
 $\lambda=1$. The lower value of
 $\lambda$ for Q is reflected in the higher risk:
 $n_H(Q)=500$.
The half-plane  $\{x+3y>c_S\}$ abuts S, where
 $c_E=\sqrt7$ for the ellipse,
 $c_C=3.5$ for the cross, and
 $c_L=2$ for the lozenge. The equality
 $a_nc_S=14$ for
 $a_n=\sqrt{2\log n}$ gives
 \begin{equation*}\log n=98/c_S^2=14, 8, 24.5\end{equation*}
for  $S=E, C, L$, respectively, yielding the values of the sample size
 $n_H$ in Figure 2.
The coefficient of intermediate tail dependence gives information on the risk for the specific regions  $rR_0$, where
 $R_0=(1,\infty)^2$ if
 $\max S=(1,1)$. The probability of such regions can be read off from the bivariate df and its margins. For other regions, even simple regions like the half-plane H above, knowledge of the shape of the limit set is essential to evaluate the risk of a sample point falling in the region. Basically the question here is, if one knows the risk for one region,
 $R=R_0$, what does this tell us about the risk for another region, say
 $R=H$?
In the Appendix, it is shown that the limit shapes above can occur in combination with the prescribed margins: there exist homothetic densities with level sets shaped like E, C, L, Q such that the margins of the df have tails asymptotically equal to  $e^{-t^2/2}/\sqrt{2\pi}$. For these particular densities, one may compute the asymptotic value of
 ${\mathbb P}\{(X,Y)\in rH\}$ rather than that of
 $-\log{\mathbb P}\{(X,Y)\in rH\}$ for
 $r\to\infty$, but our aim is to show that the orders of magnitude of the probabilities diverge:
 \begin{equation*}\frac{-\log{\mathbb P}\{(X,Y)\in rH\}}{-\log{\mathbb P}\{X>r\}}\to\frac{98}{c_S^2},\qquad r\to\infty.\end{equation*}
Here X is standard normal and the coefficient  $c_S$ introduced above is determined by the shape of S. The result holds for any vector (X, Y) whose samples scaled by
 $a_n=\sqrt{2\log n}$ converge onto one of the sets
 $S=E, C, L, Q$.
4. The distribution of the scaled sample points
The limit set S has no structure apart from its shape. The sample clouds  $N_n$, which converge onto S, have more structure. The density of the sample points may vary over S.
The descending order statistics of a sample from a continuous distribution on  ${\mathbb R}$ are the sample points arranged in decreasing order,
 $U_{1:n}>\cdots>U_{n:n}$. In the asymptotic theory, there is a distinction between central order statistics
 $U_{k:n}$ for
 $k=k_n$, where
 $k/n$ tends to a limit
 $p\in(0,1)$, intermediate upper order statistics, where
 $k_n\to\infty$ but
 $k/n\to0$, and extreme upper order statistics, where
 $k_n$ is constant eventually.
If the sample clouds converge to a Poisson point process N, the points of N accumulate at the origin of  ${\mathbb R}^d$. Arrange the points of the scaled samples
 $N_n$ and of the point process N in decreasing order of the norm. It is convenient to use Skorohod’s representation theorem and consider almost sure convergence
 $N_n\to N$ (weakly on the complement of any
 $\epsilon$-ball
 $\epsilon B$). We then see that the limit N contains infinitely many points, but only the extreme upper order statistics. Let
 ${\mathbf Z}_{k:n}$ denote the point in
 $N_n$ with the kth largest norm, with
 $k\in\{1,\ldots,n\}$. Then
 $k_n\to\infty$ implies
 ${\mathbf Z}_{k_n:n}\to{\bf0}$. The intermediate upper order statistics, the central order statistics, and the intermediate lower and extreme lower order statistics disappear into the black hole at the origin. If the sample clouds converge onto a set S, the situation is different. Now the central order statistics disappear at the origin, and so do the intermediate and extreme lower order statistics, since for any
 $\epsilon>0$ the number of points of
 $N_n$ outside the ball
 $\epsilon B$ is binomial
 $(n,p_n)$ with
 $p_n={\mathbb P}\{\|{\mathbf X}\|\ge\epsilon a_n\}\to0$, which implies
 $\smash{N_n(\epsilon B^c)/n\buildrel{\mathbb P}\over\rightarrow0}$. Thus
 $S\setminus\{{\bf0}\}$ only shows the intermediate and extreme upper order statistics.
A basic question is the following: for an open set O intersecting S, how many points of the sample cloud lie in O?
Proposition 4.1. Suppose the random samples of  ${\mathbf X}$ scaled by
 $a_n$ converge onto the compact set S. Suppose S contains more than one point and
 ${\mathbf X}$ is unbounded. Assume Weibull-like tails with exponent
 $\tau$. Let
 $U=u({\mathbf X})$ be a risk variable such that
 $R=\{u>1\}$ abuts S. Then
 ${\mathbb P}\{U>u\}=e^{-T(u)}$ for a function T which varies regularly with exponent
 $\tau$, and
 \begin{equation}\frac{-\log{\mathbb P}\{U>\theta a_n\}}{\log n}\to\theta^\tau,\qquad \theta>0,\qquad n\to\infty.\end{equation}
Proof. The fraction is asymptotically equal to  $T(\theta a_n)/T(a_n)$. Regular variation yields the limit.□
Corollary 4.1. Consider the setting of Proposition 4.1. Let  $N_n$ be a scaled random sample of size n from the distribution of
 ${\mathbf X}$. Then
 \begin{equation}\log N_n(\theta R)/\log n\buildrel{\mathbb P}\over\rightarrow1-\theta^\tau,\qquad \theta\in(0,1),\qquad n\to\infty.\end{equation}
Proof. Add a factor n to the probability in the numerator in (4.1) to obtain the limit  $1-\theta^\tau$, and observe that
 $N_n(\theta R)$ is binomial
 $(n, {\mathbb P}(\theta a_nR))$; hence
 \begin{equation*}N_n(\theta R)/n{\mathbb P}(\theta a_nR)\buildrel{\mathbb P}\over\rightarrow1\end{equation*}
for  $\theta\in(0,1)$.□
Corollary 4.1 implies that, for  $\theta\in(0,1)$, one may write
 $N_n(\theta R)\approx n^{1-\theta^\tau}$ in the sense that for any
 $\theta_1<\theta$ and
 $\theta_2>\theta$,
 \begin{equation}{\mathbb P}\{n^{1-\theta_2^\tau}\le N_n(\theta R)\le n^{1-\theta_1^\tau}\}\to1,\qquad n\to\infty.\end{equation}
If the complement of the limit set is a risk region, the limit in (4.2) tells us for any  $\theta\in(0,1)$ how many scaled sample points lie outside
 $\theta S$. With the same arguments one can show that if T varies slowly, then the tail of U is relatively heavy, and
 $N_n(\theta S^c)\approx n$ for all
 $\theta\in(0,1)$ in the sense that
 ${\mathbb P}\{N_n(\theta S^c)<n^{1-\delta}\}\to0$ for any
 $\delta>0$. If T varies rapidly, then for any
 $\theta\in(0,1)$ the probability
 ${\mathbb P}\{N_n(\theta S^c)>n^\delta\}$ vanishes for
 $\delta>0$ and
 $n\to\infty$. Since
 $\smash{N_n((1-\epsilon)R)\buildrel{\mathbb P}\over\rightarrow\infty}$ for
 $\epsilon>0$ holds without any assumptions apart from convergence onto S, we see that on arranging the sample in decreasing order of the gauge function
 $n_S$, the limit points of the extreme upper order statistics lie on the boundary of S.
Proposition 4.2. Let the sample clouds for  ${\mathbf X}$ with scaling
 $a_n\to\infty$ converge onto a compact set S containing more than one point. Let the open set O abut S, and suppose there exists a risk region R which contains O and abuts S. Then
 \begin{equation}N_n(\theta O)/N_n(\theta_1R)\to\infty\quad {\text{in}\ \text{probability}},\text{in probability,}\qquad0<\theta<\theta_1<1.\end{equation}
Proof. Let  $\theta_0\in(\theta,\theta_1)$. Choose indices
 $m=m_n$ such that
 $a_m/a_n\to\theta_0$. Then
 $m_n/n\to0$. The m-point sets
 $N_n^{(m)}=\{{\mathbf X}_1/a_n,\ldots,{\mathbf X}_m/a_n\}$ are rescaled m-point sample clouds and converge onto
 $S_0=\theta_0S$. The open set
 $\theta O$ is a neighbourhood of a point
 ${\mathbf p}\in S_0$, and the closure of
 $\theta_1R$ is disjoint from
 $S_0$. By definition of convergence onto,
 \begin{equation*}N_n^{(m)}(\theta O)\buildrel{\mathbb P}\over\rightarrow\infty\qquad {\text{and}}\qquad N_n^{(m)}(\theta_1R)\buildrel{\mathbb P}\over\rightarrow0.\end{equation*}
This also holds for the m-point sets  $\{{\mathbf X}_{km+1}/a_n,\ldots,{\mathbf X}_{km+m}/a_n\}$ for all
 $k\ge1$ for which
 $km+m\le n$. The final set
 $N_f=\{{\mathbf X}_{mk+1}/a_n,\ldots,{\mathbf X}_n/a_n\}$ contains m points or fewer. For this set,
 $N_f(\theta_1R)\to0$ in probability and
 $N_f(\theta O)\ge0$.□
Corollary 4.2. In the case of Weibull-like tails with exponent  $\tau$,
 \begin{equation}\log(N_n(\theta O))/\log n\to1-\theta^\tau\quad\textit{in probability,} \qquad\theta\in(0,1).\end{equation}
The result also holds for  $\tau=0$ and
 $\tau=\infty$.
Proof. Use Proposition 4.1. The inequality  $N_n(\theta O)\le N_n(\theta R)$ gives an upper bound
 $1-\theta^\tau$.□
Example 4.1. The number of points in an open set may be larger than one might expect. The technical condition in Proposition 4.2 that there should exist a risk region shielding O from S cannot be ignored. Let (X, Y) have density
 \begin{equation*}f(x,y)=\begin{cases} e^{-|2x|}e^{-y^2/2}/\sqrt{2\pi},&y>0,\\[4pt]
e^{-|x|}e^{-|y|}/4,&y<0.\end{cases}\end{equation*}
Scale the samples by  $a_n=\log n$. The limit set S is the triangle with vertices
 $(\pm1,0)$ and
 $(0,-1)$. The open sets
 $R=(1/2,\infty)\times({-}\infty,-1/2)$ and
 $O_\theta=(\theta,\infty)\times(0,\infty)$,
 $\theta\in[0,1]$, abut S. The mean measure of R is
 $\mu_n(R)=1/4$; that of
 $O_\theta$ is o(1) for
 $\theta>1/2$ and
 $n^{1-2\theta}$ for
 $\theta\in[0,1/2]$ (since
 ${\mathbb P}\{X>\theta a_n\}=1/n^{2\theta}$).
4.1. Concentration
Suppose the risk region R abuts S in the point  ${\mathbf p}$ and only in this point. One would expect the scaled sample points in R to lie close to
 ${\mathbf p}$. We will show that this is the case.
Lemma 4.1. Let S be a compact star-shaped set in  ${\mathbb R}^d$. Define
 $f({\mathbf x})$ for
 ${\mathbf x}\in{\mathbb R}^d$ as the distance from
 ${\mathbf x}$ to S:
 $f({\mathbf x})=\min_{{\mathbf y}\in S}\|{\mathbf x}-{\mathbf y}\|$. The function f satisfies
 $|f({\mathbf x})-f({\mathbf y})|\le\|{\mathbf x}-{\mathbf y}\|$. The sets
 $\{f\le \epsilon\}$ are star-shaped for
 $\epsilon>0$, their complement is a risk region, and
 $\{f=0\}=S$.
Proof. Let D denote the closed unit ball. The set  $S_\epsilon=S+\epsilon D$ is compact. We claim that the complement is a risk region. Let
 ${\mathbf p}$ be a boundary point of
 $S+\epsilon D$. Then
 ${\mathbf p}+\epsilon B$ is disjoint from S. (Otherwise S contains a point
 ${\mathbf z}$ such that
 $\|{\mathbf z}-{\mathbf p}\|<\epsilon$, and so
 ${\mathbf p}\in{\mathbf z}+\epsilon B$ is an interior point of
 $S+\epsilon D$.) There is a point
 ${\mathbf z}\in S$ such that
 $\|{\mathbf z}-{\mathbf p}\|=\epsilon$. Now suppose
 $t{\mathbf p}$ also is a boundary point for some
 $t\in(0,1)$. Then
 $t{\mathbf p}+\epsilon B$ is disjoint from S by the argument above, but
 $t{\mathbf z}\in S$ and
 $\|t{\mathbf z}-t{\mathbf p}\|=\epsilon t<\epsilon$. This is a contradiction.□
Lemma 4.2. (Concentration Lemma.) Let the scaled random samples  $N_n=\{{\mathbf X}_1,\ldots,{\mathbf X}_n\}/a_n$ converge onto a compact set S which contains more than one point. Assume that
 $a_n>0$ is unbounded. Let the risk region R abut S and let O be an open neighbourhood of
 $S\cap cl(R)$. Let
 $\nu_n$ denote the mean measure of
 $N_n$. Then
 \begin{equation}\nu_n(O\cap R)/\nu_n(R)\to1,\qquad r\to\infty.\end{equation}
Proof. The closed set  $cl(R)\setminus O$ is disjoint from S. Intersect it with the closure of a large open ball
 $r_0B$ which contains S to obtain a compact set K disjoint from S. One of the risk regions
 $R_n$ in the corollary above contains K. Its closure is disjoint from S. Hence there exists
 $q>1$ such that
 $R_n/q$ abuts S. Then
 \begin{equation*}{\mathbb P}\{{\mathbf X}\in q(rR_n/q)\}/{\mathbb P}\{{\mathbf X}\in rR\}\to0\end{equation*}
for  $r\to\infty$ by Proposition 2.1.
The asymptotic equality (4.6) need not hold if we replace R by an open set Q which abuts S.□
Example 4.2. Let the probability measure  $\pi$ give mass
 $1/2$ to the lower half-plane with density
 $e^{-r}/2\pi$, and mass
 $1/2$ to the upper diagonal L with density
 $ce^{-r^2}$, where
 $r=\sqrt{x^2+y^2}$. The samples scaled by
 $a_n=\log n$ converge onto the intersection S of the closed unit disk and the closed lower half-plane. The open set
 $Q=(1/2,\infty)\times(0,\infty)$ abuts S in the interval
 $E=[1/2,1]\times\{0\}$ and intersects L. Let
 $O=(1/3,4/3)\times({-}1/3,1/3)$. Then
 $O\cap L=\emptyset$. Hence
 $\nu_n(Q\cap O)=0$ and
 $\nu_n(Q)>0$ for all
 $n\ge1$.
Let  ${\mathbf Z}^{tR}$ denote a random vector
 ${\mathbf Z}$ conditioned to lie in a risk region tR. In [Reference Balkema and Embrechts1],
 ${\mathbf Z}^{tR}$ for t large is referred to as a high-risk scenario, since
 ${\mathbf Z}$ is conditioned to lie in an extremal region associated with high risk.
Proposition 4.3. Let  $a_n$ be an unbounded increasing sequence of scaling constants. Let
 $\pi_i$,
 $i=0,1$, be probability measures on
 ${\mathbb R}^d$ for which the samples scaled by
 $a_n$ converge onto a compact set
 $S_i$ containing more than one point. Let the open half-space
 $H=\{\xi>1\}$ abut
 $S_0$ and
 $S_1$ in the point
 ${\mathbf p}$ and only in
 ${\mathbf p}$. Suppose there exist an open cone C which contains
 ${\mathbf p}$, and a compact set K such that
 $d\pi_0=d\pi_1$ on
 $C\setminus K$. Suppose there exist linear transformations
 $A_t$ mapping the upper half-space
 $J_0=\{x_d>0\}$ onto
 $\{\xi>0\}$, such that the normalized high-risk scenarios for the probability measure
 $\pi_0$ converge:
 \begin{equation*}{\mathbf W}_t=A_t^{-1}({\mathbf Z}^{tH}-t{\mathbf p})\Rightarrow{\mathbf W},\qquad t\to\infty.\end{equation*}
Then this also holds with the same normalization for the high-risk scenarios under  $\pi_1$, and the two limit scenarios have the same distribution.
Proof. Choose  $\epsilon>0$ so small that the open ball
 ${\mathbf p}+\epsilon B$ is contained in the cone C. Let
 $\pi_{i,t}$ be the distribution of
 ${\mathbf W}_t$ when
 ${\mathbf Z}$ has distribution
 $\pi_i$, and let
 $\mu_{i,t}$ denote the restriction of
 $\pi_{i,t}$ to
 $A_t^{-1}(t\epsilon B)$. By the Concentration Lemma, the total mass of the measures
 $\delta_{i,t}=\pi_{i,t}-\mu_{i,t}$ vanishes for
 $t\to\infty$. By assumption
 $\pi_{0,t}\to\pi$ weakly for a probability measure
 $\pi$ on
 $J_0$. Let
 $\varphi$ be a bounded continuous function on
 ${\mathbb R}^d$. Then
 $\int\varphi d\pi_{0,t}\to\int\varphi d\pi$ and
 $\int\varphi d\delta_{0,t}\to0$. Hence
 $\int\varphi d\mu_{1,t}=\int\varphi d\mu_{0,t}\to\int\varphi d\pi$, and
 $\int\varphi d\pi_{1,t}\to\int\varphi d\pi$ since
 $\int\varphi d\delta_{1,t}\to0$.□
Samples from the standard Gaussian distribution on  ${\mathbb R}^3$ scaled by
 $\sqrt{2\log n}$ converge onto the closed unit ball S. Let
 ${\mathbf p}=(0,0,1)$. Then
 ${\mathbb P}\{{\mathbf Z}\in {\mathbb R}^2\times(t_n,\infty)\}\sim1/n$, where
 \begin{equation}t_n=\sqrt{2\log n}-\sqrt2(\log\log n+\log(4\pi))/\sqrt{\log n}+o(1/\log n);\end{equation}
see, e.g., [Reference Embrechts, Klüppelberg and Mikosch16]. Samples shifted over  $-t_n{\mathbf p}$ and expanded by
 $a_n$ in the vertical direction converge in distribution to the Gauss-exponential Poisson point process with intensity
 $e^{-v}e^{-(u_1^2+u_2^2)/2}/2\pi$ weakly on all half-spaces
 $v>t$,
 $t\in{\mathbb R}$. (See [Reference Eddy15].) By symmetry, this Gauss-exponential point process describes the distribution of the scaled sample around any boundary point of S.
Let  ${\mathbf p}_1,\ldots,{\mathbf p}_m$ be distinct unit vectors and
 $F_1,\ldots, F_m$ dfs on
 ${\mathbb R}^2$. One can construct a probability distribution
 $\pi$ on
 ${\mathbb R}^3$ such that the samples scaled by
 $a_n=\sqrt{2\log n}$ converge onto the closed unit ball S, and the renormalized scaled samples around
 ${\mathbf p}$ converge to a Gauss-exponential point process for every point
 ${\mathbf p}\in\partial S$, except for the points
 ${\mathbf p}_i$,
 $i=1,\ldots,m$, where they converge to a Poisson point process with mean measure
 $dF_i(u_1,u_2)e^{-v}dv$.
The example below gives the basic idea of the construction. Here  $m=1$,
 $d=2$,
 ${\mathbf p}_1=(0,1)$, and
 $F_1$ is the Cauchy distribution with density
 $1/(\pi(1+x^2))$.
Example 4.3. It is possible to alter the standard Gaussian distribution  $\pi_0$ on the plane so that the high-risk scenarios
 ${\mathbf Z}^{tH}$ for the half-plane
 $H=\{y>1\}$, suitably normalized, converge to a limit scenario (U, V), where U is Cauchy and independent of V, which is standard exponential.
Let  $\pi_1$ be a probability distribution on the parabola
 $P=\{y>x^2/2\}$ whose density agrees with
 $y^2e^{-y^2/2}/(\pi(1+x^2))$ outside a bounded set. The random samples from
 $\pi_1$ scaled by
 $a_n=\sqrt{2\log n}$ converge onto the line segment with endpoints (0,0) and (0,1). Observe that
 \begin{equation*}p_0(t)=\pi_0\{y>t\}\sim e^{t^2/2}/(t\sqrt{2\pi})\ll p_1(t)=\pi_1\{y>t\}\sim te^{t^2/2}.\end{equation*}
Set  $\alpha_t(u,v)=(u,t+v/t)$. Let
 $g_{i,t}$ be the density of
 $\alpha_t^{-1}(\pi_i)$ and
 $h_{i,t}=g_{i,t}/g_{i,t}(0,0)$. Then
 $h_{0,t}(u,v)\to e^{-v}e^{-u^2/2}$ uniformly on bounded sets and in
 ${\bf L}^1$ on
 $\{v>0\}$, and
 $h_{1,v}(u,v)\to e^{-v}/(1+u^2)$ uniformly on bounded sets and in
 ${\bf L}^1$ on
 $\{v>0\}$, by monotone convergence. Let
 $\pi$ be a probability measure whose density agrees with that of
 $\pi_0+\pi_1$ outside a bounded set. Then
 $p(t)=\pi\{y>t\}\sim p_1(t)$ for
 $t\to\infty$. Hence the normalized high-risk scenarios
 $\alpha_t^{-1}({\mathbf Z}^{tH})$ for the half-planes
 $tH=\{y>t\}$ and the probability measure
 $\pi$ converge to the Cauchy-exponential limit scenario (U, V) above.
Proposition 4.3 ensures that for any half-plane R which abuts S in a point  ${\mathbf p}\not=(0,1)$, the high-risk scenarios have a Gauss-exponential limit.
The reader might prefer an example where the df  $F_{\mathbf p}$ of the horizontal part of the distribution of the limit scenario varies continuously with the boundary point
 ${\mathbf p}\in\partial S$, and is not Gaussian. It is not known whether such an example exists.
5. The intersection index
Given a finite set of risk variables, one may ask whether there exist sample points for which two or more of these risk variables are large. The answer tells us something about the way large values of these risk variables are linked. To be specific, one may ask, given the risk variables  $U=u({\mathbf X})$ and
 $V=v({\mathbf X})$, whether there is a sample point
 ${\mathbf X}_0$ for which
 $u({\mathbf X}_0)$ and
 $v({\mathbf X}_0)$ both belong to, say, the twenty highest values. Given a sample of n points and an index
 $i\le n$, let u[i] denote the set of the i sample points with the largest u-values and v[i] the set of i sample points with the largest v values. The intersection index
 $I_n(U,V)$ is the least value of i for which u[i] and v[i] intersect. To accommodate dfs with discontinuities we make the following definition.
Definition 5.1. For a finite sequence of points  $(u_k,v_k)$,
 $k=1,\ldots,n$, the intersection index
 $I_n$ is the smallest integer
 $i\ge1$ for which there is a point
 $(u_k,v_k)$ such that
 \begin{equation}\#\{j\mid u_j>u_k\}<i\quad{\text{and}}\quad\#\{j\mid v_j>v_k\}<i.\end{equation}
With each point one may associate two ranks, the rank  $k_v$ in the decreasing order statistics for the vertical coordinate v and the rank
 $k_u$ for the horizontal coordinate u. If the marginal dfs are continuous, the intersection index for almost every sample is the minimal value of
 $k=k_u\lor k_v$ over the sample points. What can one say about the value of
 $I_n=I_n(U,V)$ for large n?
Proposition 5.1. Let (U, V) have continuous margins. The following are equivalent:
•
${\mathbb P}\{I_n=1\}\to0$;• U and V are tail independent;
•
$I_n\to\infty$ in probability.


Proof. We may assume that U and V are uniformly distributed on (0,1). Let  $\mu$ be the distribution of (U, V) on
 $(0,1)^2$,
 $\mu_n=n\mu$ the mean measure of the random sample of size n, and
 $Q_n$ the square
 $(1-1/n,1)^2$. Let
 $\mu_nQ_n=\epsilon>0$. The Poisson point process approximation to the sample on the complement C of
 $(0,1-1/n)^2$ gives a probability of
 $\epsilon e^{-\epsilon}e^{-2(1-\epsilon)}$ of one point in C and that point in
 $Q_n$. This implies a record,
 $I_n=1$. Hence,
 ${\mathbb P}\{I_n=1\}\to0$ implies
 $\mu_n(Q_n)\to0$, which implies tail independence.
Let  $U_{1:n}>\cdots>U_{n:n}$ denote the order statistics for U and
 $V_{1:n}>\cdots>V_{n:n}$ those for V. Let
 $m\ge1$. Then
 \begin{equation*}\{I_n<m, U_{m:n}>1-2m/n, V_{m:n}>1-2m/n\}\subset\{N(Q)>0\}\end{equation*}
for  $Q=Q_n(m)=(1-2m/n,1)^2$. Tail independence gives
 \begin{equation*}p_n={\mathbb P}\{(U,V)\in Q\}=o(2m/n)=o(1/n).\end{equation*}
The event on the right has probability o(1). Since  ${\mathbb P}\{U_{m:n}<1-2m/n\}$ and
 ${\mathbb P}\{V_{m:n}<1-2m/n\}$ are bounded by
 $1/m$ for
 $m\ge m_0$ and
 $n\ge n_m$,
 \begin{equation*}{\mathbb P}\{I_n<m\}\le3/m,\qquad n\to\infty,\qquad m\ge m_0.\end{equation*}
So tail independence implies  $I_n\to\infty$ in probability and hence
 ${\mathbb P}\{I_n=1\}\to0$.□
The rate at which  $I_n$ diverges depends on the limit shape. For Weibull-like tails, there is a simple formula for the asymptotic behaviour.
We may and shall assume that U and V are standardized. Let  $z=u\land v$ and
 $R=\{z>1\}$. Define
 $z^*=\max z(S)$. Then
 $z^*R$ abuts S if
 $z^*$ is positive. For
 $\theta>z^*$, the closure of
 $\theta R$ is disjoint from S, and the probability that
 $N_n(\theta R)=0$ tends to 1 by definition of convergence onto. If
 $\theta\in(0,z^*)$, then
 \begin{equation*}\log(N_n((\theta/z^*)z^*R)/\log n\to1-(\theta/z^*)^\tau\end{equation*}
in probability by (4.2), and  $N_n(\theta R)\to\infty$. The quotients
 $\log(N_n\{u>\theta\})/\log n$ and
 $\log(N_n\{v>\theta\})/\log n$, for
 $\theta\in(0,1)$, converge to
 $1-\theta^\tau$ in probability by the same relation. Hence, we conclude that loosely speaking (see (4.3)),
 \begin{equation*}I_n(U,V)\approx n/n^{(z^*)^\tau}.\end{equation*}
By Theorem 3.1,  $(z^*)^\tau=1/\lambda$, where
 $\lambda$ is the coefficient of intermediate dependence for U and V as defined in (3.3). We have the following result.
Proposition 5.2. Suppose  ${\mathbf X}$ has Weibull-like tails. Let
 $U=u({\mathbf X})$ and
 $V=v({\mathbf X})$ be risk variables for which
 $\max u(S)$ and
 $\max v(S)$ are positive. If the coefficient
 $\lambda\in[1,\infty]$ of intermediate dependence between U and V exists, the intersection index
 $I_n(U,V)$ in (5.1) satisfies
 \begin{equation}\log(I_n(U,V))/\log n\to1-1/\lambda\quad {in\ probability}.\end{equation}
5.1. Heavy light tails and light light tails
Not every light-tailed distribution has Weibull-like tails. The class of dfs with tails which vary rapidly is vast. It contains dfs with heavy light tails like  $1-F(t)=1/t^{\log t}$ and dfs with light light tails like the double exponential tail
 $1-F(t)=\exp({-}e^t)$. To see how large this class is, observe that for any two dfs
 $F_1$ and
 $F_2$ with tails which vary rapidly at
 $\infty$ there exists an increasing sequence
 $t_n\to\infty$ and a df F with tail which varies rapidly at
 $\infty$ such that F agrees with
 $F_1$ on the intervals
 $I_n=(t_n,t_n+n)$ with odd index and with
 $F_2$ on the intervals with even index.
For any df F whose tail varies rapidly at infinity, there exists a continuous strictly decreasing function  $L_0$ which maps (0,1] onto
 $[0,\infty)$ and which is asymptotically equal to
 $(1-F)^\leftarrow$ at zero [Reference Bingham, Goldie and Teugels6, Theorem 2.4.7]. Let S be a compact star-shaped set in
 $[0,\infty)^2$ such that
 $\max(S)=(1,1)$. By the Existence Theorem, Theorem 1.4, there exists a nonnegative vector (U, V) with marginal tails
 $1-F_U$ and
 $1-F_V$ whose inverses are asymptotic to
 $L_0$, such that the samples from (U, V) scaled by
 $L_0(1/n)$ converge onto S. Set
 $R=(1,\infty)^2$ and let
 $\theta R$ abut S for some
 $\theta\in(0,1)$.
To determine a value  $k_n\in{\mathbb R}$ which approximates the intersection index
 $I_n$ for (U, V), we set
 $L_0^\leftarrow=1-F=e^{-T}$ and solve the equations
 \begin{equation*}T(a_n)=\log n,\qquad T(\theta a_n)=\log(n/k),\qquad k=k_n\to\infty, \quad k/n\to0.\end{equation*}
We give four examples.
1.
$T(u)=u$: then $a_n=\log n$, and $\theta a_n=\theta\log n=\log n -\log k$. Hence $\log k=\log n-\theta\log n$ and $k=n^{1-\theta}$.2. T varies regularly with exponent
$\tau>0$: $T(a_n)=\log n$, and
Hence
\begin{equation*}\log n-\log k=T(\theta a_n)\sim\theta_n^\tau T(a_n)=\theta_n^\tau\log n.\end{equation*}$\log k=\log n-\theta_n^\tau\log n$ with $\theta_n\to\theta$ and $k=n^{1-\theta_n^\tau}$.3.
$T(u)=e^u$: then $e^{\theta a_n}=(\log n)^\theta=\log n -\log k$. Hence $\log k=\log n-(\log n)^\theta$ and $k=n/e^{(\log n)^\theta}$.4.
$T(u)=(\log u)^2$: then $\log a_n=\sqrt{\log n}$, and
Hence
\begin{equation*}\log n-\log k=(\log\theta a_n)^2=(\sqrt{\log n}+\log\theta)^2=\log n+2\log\theta\sqrt{\log n}+(\log\theta)^2.\end{equation*}$k=1/\theta^{2\sqrt{\log n}+\log\theta}$.


For Weibull-like tails,  $k_n$ is a power of n; more precisely,
 $k_n=n^{\varphi_n}$ with
 $\varphi_n\to\varphi\in(0,1)$. For the light light double exponential tail
 $\exp({-}e^u)$, the sequence
 $k_n/n$ vanishes, but
 $k_n$ diverges faster than any power
 $n^{1-\delta}$; for the heavy light tail
 $1/u^{\log u}$, the sequence
 $k_n$ diverges slower than any power
 $n^\delta$ with
 $\delta>0$. In each case,
 $k_n=K(n,\theta)$ for some function K. Let
 $k^{(i)}_n=K(n,\theta^{(i)})$ for
 $\theta^{(1)}<\theta<\theta^{(2)}$. Then
 \begin{equation*}{\mathbb P}\{k_n^{(1)}<I_n<k_n^{(2)}\}\to1.\end{equation*}
5.2. The coefficient of geometric tail dependence
In this subsection  ${\mathcal F}_\infty$ is the set of all strictly increasing continuous dfs
 $F_0$ on
 $[0,\infty)$ which vanish at zero and have a rapidly varying tail. The inverse of
 $1-F_0$,
 $L_0$, is continuous and strictly decreasing, varies slowly at zero, and maps (0,1] onto
 $[0,\infty)$.
Let (U, V) be a pair of standardized risk variables with margins whose tails are quantile equivalent to  $1-F_0$ with
 $F_0\in{\mathcal F}_\infty$. Motivated by the examples of order statistics above, we construct a coefficient of geometric tail dependence for (U, V) as follows. Let
 $p_2(t)$ for
 $t>0$ denote the probability that
 $U>t$ and
 $V>t$, and let
 $s=s(t)$ satisfy
 $1-F_0(s)=p_2$. Then
 $s\ge t$. If
 $s/t\to\lambda\in[1,\infty]$ for
 $t\to\infty$, we call the limit the coefficient of geometric tail dependence for the pair (U, V).
Definition 5.2. Let the marginal quantile functions of the pair (U, V) be asymptotically equal at zero to a strictly decreasing continuous function  $L_0$ which maps (0,1] onto
 $[0,\infty)$ and which varies slowly at zero. If
 \begin{equation}L_0({\mathbb P}\{U>t, V>t\})/t\to\lambda\in[1,\infty],\qquad t\to\infty,\end{equation}
then  $\lambda$ is the coefficient of geometric tail dependence of (U, V).
Remark 5.1. If the tails of the dfs of U and V are quantile equivalent to the tail of the standard exponential distribution, one may take  $L_0(t)=-\log t$, and (5.3) becomes
 \begin{equation*}-\log{\mathbb P}\{U>t, V>t\}/t\to\lambda,\qquad t\to\infty,\end{equation*}
the definition of the coefficient of intermediate tail dependence in (3.3). If the tails of the dfs of U and V are quantile equivalent to the tail  $1/t$ of the standard Pareto(1) df, then
 $L_0(t)=1/t$, and (5.3) becomes
 \begin{equation*}(1/{\mathbb P}\{U>t, V>t\})/t\to\lambda,\qquad t\to\infty.\end{equation*}
Here  $\lambda$ is the inverse of the coefficient
 $\gamma$ of extreme tail dependence in (3.1). The limit
 $\lambda$ is of interest even when
 $L_0$ does not vary slowly at zero.
Theorem 5.1. Let the random samples from  ${\mathbf X}$ scaled by
 $a_n$ converge onto a compact set S containing more than one point. Assume
 $a_n$ is unbounded. There exists a strictly decreasing continuous function
 $L_0$ mapping (0, 1) onto
 $(0,\infty)$ such that
 $a_n\sim L_0(1/n)$. Let
 $U=u({\mathbf X})$ and
 $V=v({\mathbf X})$ be standardized risk variables. The intersection index
 $I_n$ for the random samples from (U, V) satisfies
 \begin{equation}L_0(I_n/n)/a_n\buildrel{\mathbb P}\over\rightarrow\theta=\max((u\land v)(S)).\end{equation}
Proof. The result follows from the two lemmas below.□
Define the df  $F_0$ by
 $1-F_0=L_0^\leftarrow$. Let
 $R=\{u\land v>1\}$ and let
 $N_n$ be the random sample of size n from (U, V) scaled by
 $a_n$. Let
 $W_{k:n}$ denote the increasing order statistics from the uniform distribution on (0,1). Set
 $\theta=\max((u\land v)(S))$ as in (5.4).
Lemma 5.1. Suppose  $\theta''<\theta$ and
 $k_n>n(1-F_0)(\theta''a_n)$. Then
 ${\mathbb P}\{I_n\le k_n\}\to1$.
Proof. Let  $\theta'=(\theta''+\theta)/2$. For the order statistics from the uniform distribution,
 $W_{k_n:n}\sim k_n/n$ in probability if
 $k_n\to\infty$ and
 $k_n/n\to0$, since
 $(W_{k_n:n}-k_n/n)/\sqrt{k_n}$ is asymptotically standard normal. Slow variation then implies
 $L_0(W_{k_n:n})\sim L_0(k_n/n)$. By tail coherence both
 $U_{k_n:n}$ and
 $V_{k_n:n}$ are asymptotic to
 $L_0(k_n/n)$ in probability. Since
 $L_0(k_n/n)<\theta'' a_n$ by assumption and
 $\theta''<\theta'$, both
 ${\mathbb P}\{U_{k_n:n}/a_n<\theta'\}\to1$ and
 ${\mathbb P}\{V_{k_n:n}/a_n<\theta'\}\to 1$. If
 $U_{k_n:n}/a_n<\theta'$,
 $V_{k_n:n}/a_n<\theta'$, and
 $N_n(\theta'R)>0$, then
 $I_n\ge k_n$.□
Lemma 5.2. Suppose  $\theta<\theta''$ and
 $k_n<n(1-F_0)(\theta''a_n)$. Then
 ${\mathbb P}\{I_n\ge k_n\}\to1$.
Proof. As above.□
There is an analogue of Theorem 3.1 for the coefficient of geometric tail dependence. If  $a_n\sim\log n$ then one may choose
 $L_0(u)=-\log u$ to obtain a special case of Theorem 3.1.
Theorem 5.2. Suppose the random samples from  ${\mathbf X}$ scaled by
 $a_n$ converge onto S. Assume S contains more than one point and
 $a_n\to\infty$. Let
 $L_0\,:\,(0,1]\to[0,\infty)$ be continuous and strictly decreasing and satisfy
 $L_0(1/n)\sim a_n$. Then
 $L_0$ varies slowly at zero. Let
 $U=u({\mathbf X})$ and
 $V=v({\mathbf X})$ be standardized risk variables. The quantile functions of U and V are asymptotically equal to
 $L_0$ at zero. The coefficient of geometric tail dependence of (U, V) is
 \begin{equation*}\lambda=\lim_{t\to\infty}\frac{L_0({\mathbb P}\{U>t, V>t\})}t=\sup\{r>0\mid rS\cap\{u>1\}\cap\{v>1\}=\emptyset\}.\end{equation*}
6. Domains of attraction for limit sets
A description of all possible limit sets is of theoretical interest. In applications one is more interested in the domains of attraction. Does there exist a simple characterization of the domain of attraction which enables one to estimate the limit set?
We begin with some notation:  ${\mathcal S}$ is the set of all compact star-shaped sets
 $S\subset{\mathbb R}^d$ which contain more than one point, and
 ${\mathcal L}$ is the set of all unbounded strictly decreasing continuous positive functions L on (0,1] which vary slowly at zero:
 $L(1/2n)/L(1/n)\to1$ for
 $n\to\infty$.
Definition 6.1. For  $S\in{\mathcal S}$ and
 $L\in{\mathcal L}$, define the domain of limit-set attraction
 ${\mathcal D}_{{ls}}(S,L)$ as the set of all random vectors (or their dfs) for which the random samples scaled by
 $L(1/n)$ converge onto S.
By Theorem 1.4, all domains of attraction are non-empty.
Proposition 6.1. If the domains  ${\mathcal D}_{{ls}}(S_1,L_1)$ and
 ${\mathcal D}_{{ls}}(S_2,L_2)$ intersect, they coincide and there exists a constant
 $c>0$ such that
 $S_2=cS_1$ and
 $L_1=cL_2$.
Theorem 6.1. The random vector  ${\mathbf X}$ lies in the domain
 ${\mathcal D}_{{ls}}(S,L)$ if and only if for every risk variable
 $U=u({\mathbf X})$ its df
 $F_u$ satisfies
 \begin{equation*}(1-F_u)^\leftarrow(r)/L(r)\to u^*=\max u(S),\qquad r\to\infty.\end{equation*}
Proof. Necessity of the condition follows from tail coherence, Theorem 2.1. Sufficiency will be proven below in Proposition 6.2.□
We now introduce a  $(d+1)$-dimensional class of risk regions, probes, which are able to approach boundary points of S without intersecting S. Certain boundary points may be hard to hit. Think of the boundary point (0,1) when S is the union of three unit disks centered in (0,0) and
 $(\pm1,1)$.
Definition 6.2. For  ${\mathbf p}\not={\bf0}$ and
 $\varphi\in(0,\pi/2)$, let
 $C({\mathbf p},\varphi)$ denote the open cylinder symmetric cone around the ray through
 ${\mathbf p}$ consisting of all points
 ${\mathbf x}\not={\bf0}$ for which the angle between the ray through
 ${\mathbf x}$ and the ray through
 ${\mathbf p}$ is less than
 $\varphi$. Define the corresponding probe as the translate:
 \begin{equation}P({\mathbf p},\varphi)={\mathbf p}+C({\mathbf p},\varphi).\end{equation}
Lemma 6.1. Let S be a compact star-shaped set containing more than one point and  $O\supset S$ open. There is a finite set of probes which cover
 $O^c$ and whose closures are disjoint from S.
Proof. We may assume that O is bounded and contained in the closed ball rD. The set  $rD\setminus O$ is compact, and hence it may be covered by a finite subset of the set of all probes
 $P=P({\mathbf p},\varphi)$ with
 ${\mathbf p}\in O\setminus S$ and cl(P) disjoint from S.□
In terms of risk regions, the limit set S is determined by the risk regions R which are disjoint from S. In fact, S is already determined by the set of probes P disjoint from S. Recall that  ${\mathbf e}\in S$ is extremal if
 $t{\mathbf e}\in S^c$ for
 $t>1$.
Proposition 6.2. Let  $S\in{\mathcal S}$ and
 $L\in{\mathcal L}$. Let
 $\pi$ be a probability distribution on
 ${\mathbb R}^d$. The samples from
 $\pi$ scaled by
 $a_n=L(1/n)$ converge onto S if the following two conditions hold:
(1)
$n\pi(a_nP)\to0$ for every probe P whose closure is disjoint from S;(2)
$n\pi(a_nP(r{\mathbf e},\varphi))\to\infty$ for every extremal point ${\mathbf e}\in S$, every $r\in(0,1)$, and every $\varphi\in(0,\pi/2)$.


Proof. The two conditions imply the two conditions in the alternative definition of convergence onto S in Proposition 1.1.
(1) Every open set whose closure is disjoint from S may be covered by a finite number of probes whose closures are disjoint from S by Lemma 6.1.
(2) By Lemma 1.1 it suffices to show that
$N_n({\mathbf p}+\epsilon B)\buildrel{\mathbb P}\over\rightarrow\infty$ for every extremal point ${\mathbf p}\in S$ and every $\epsilon>0$. Let ${\mathbf e}$ be an extremal point in S and $\epsilon>0$. Set ${\mathbf p}=r{\mathbf e}$ for $r=1-\epsilon$. We claim that one may choose $\varphi>0$ so small that the probe $P({\mathbf p},\varphi)$ is contained in the union of the ball ${\mathbf e}+\epsilon B$ and the complement of S, and that this holds even for the closure of the probe if we delete the point ${\mathbf p}$. (Otherwise there exist points ${\mathbf a}_n\in S\setminus({\mathbf e}+\epsilon B)$ which are arbitrarily close to the ray through ${\mathbf e}$. Since $S\setminus({\mathbf e}+\epsilon B)$ is compact, it contains a point ${\mathbf a}$ on the ray. This point has the form ${\mathbf a}=t{\mathbf e}$ with $t\ge1+\epsilon$, contradicting the extremality of ${\mathbf e}$.) The closure T of $P({\mathbf p},\varphi)\setminus({\mathbf e}+\epsilon B)$ is disjoint from S. Since S is compact the distance between S and T is positive, say $\delta$. The $\delta$-neighbourhood of S, $S+\delta B$, is disjoint from $P({\mathbf p},\varphi)\setminus({\mathbf e}+\epsilon B)$. Hence,
The limit relations
\begin{equation*}\pi(a_n({\mathbf e}+\epsilon B))+\pi(a_n(S+\delta B)^c)\ge\pi(a_nP({\mathbf p},\varphi)).\end{equation*}$n\pi(a_nP({\mathbf p},\varphi))\to\infty$ and $n\pi(a_n(S+\delta B)^c)\to0$ imply $n\pi(a_n({\mathbf e}+\epsilon B))\to\infty$.□


As a result one has a simple description of the domains of attraction.
Theorem 6.2. A probability distribution  $\pi$ belongs to
 ${\mathcal D}_{{ls}}(S,L)$ if and only if two conditions are satisfied:
(1) For the d quantile functions
$q_i$ of the coordinates $X_i$, the 2d limits $Q(i,-)$ of $q_i(\alpha))/L(\alpha)$ and $Q(i,+)$ of $q_i(1-\alpha)$ for $\alpha\to0^+$ exist, and their sum is positive.(2) All probes
$R=P({\mathbf p},\varphi)$ with ${\mathbf p}\not={\bf0}$ satisfy
(6.2)
\begin{equation}n\pi(L(1/n)tR)\to\begin{cases}0,&cl(tR)\cap S=\emptyset,\\[6pt] \infty,&tR\cap S\not=\emptyset.\end{cases}\end{equation}


One may define the domain of S for  $S\in{\mathcal S}$ as the union
 ${\mathcal D}_{{ls}}(S)$ of the domains
 ${\mathcal D}_{{ls}}(S,L)$ over
 $L\in{\mathcal L}$. It contains all vectors
 ${\mathbf X}$ for which there exist scaling sequences
 $a_n$ such that the sample clouds with this scaling converge onto S. The domains
 ${\mathcal D}(S)$ and
 ${\mathcal D}(cS)$ coincide for any
 $c>0$. In order to decide whether a vector
 ${\mathbf X}$ lies in
 ${\mathcal D}_{{ls}}(S)$, it suffices to take a continuous positive-homogeneous function u on
 ${\mathbb R}^d$ which does not vanish identically on S, scale it so that
 $\max u(S)=1$, and check that
 ${\mathbf X}\in{\mathcal D}_{{ls}}(S,L_u)$, where
 $L_u\in{\mathcal L}$ is asymptotic to the decreasing quantile function of U.
There is a certain similarity with the domain of attraction for coordinate-wise maxima of random vectors with positive components and identical heavy-tailed margins. Instead of probes one works with generalized quadrants, intersections of coordinate half-spaces.
7. Conclusions
In the pages above we have investigated the implications of the assumption that the samples from an unbounded random vector  ${\mathbf X}$ have a limit shape. The assumption is geometric, and so are the implications.
In a multivariate setting, risk varies with the direction. One can capture the dependence on the direction by using linear functionals u or half-spaces  $H=\{u>1\}$. These half-spaces H do not contain the origin, and H contains the closure of rH for all
 $r>1$. Open sets which satisfy these two conditions are called risk regions. Any risk region R determines a unique nonnegative continuous positive-homogeneous functional u such that
 $R=\{u>1\}$. The variable
 $U=u({\mathbf X})$ is called the risk variable associated with the risk region R. The paper shows that risk regions and risk variables are the proper instruments to monitor asymptotic risks when scaled random samples converge. Tail coherence holds: standardized risk variables all have the same upper quantiles asymptotically. The Mapping Theorem and the Convergence Theorem in Section 1 are two more simple results for risk variables. In the section on the asymptotic distribution of the points in the sample cloud, risk regions rather than arbitrary open sets give the nicest results. Risk regions are crucial in the description of domains of convergence.
Our results are crude. But so is our assumption. The limit shape does not change even under quite severe perturbations of the underlying distribution, as in Example 3.1. For distributions with Weibull-like tails, we derive asymptotic expressions for the logarithms of the probabilities of risk regions rR for  $r\to\infty$, rather than for the probabilities themselves. Weibull-like tails play an important role in our analysis of the asymptotic distribution of the points in the scaled samples. For such tails there is a simple recipe due to Nolde for calculating the coefficient of intermediate tail dependence between two standardized risk variables U and V. For Weibull-like tails, the asymptotics of the intersection index for the pair (U, V) have a simple form. The intersection index tells us how many upper order statistics from U and from V are needed in order to have a common sample point. Many well-known dfs with light tails have Weibull-like tails, but the class of dfs on
 $[0,\infty)$ with rapidly varying tails is much larger. We introduce a coefficient of geometric tail dependence to investigate the asymptotics of pairs of standardized risk variables with rapidly varying tails. Coefficients of tail dependence are of theoretical interest, but for good results it helps to know the limit shape, as is shown in Section 3.2.
The paper concentrates on the first-order asymptotics of partial maxima for samples with a limit shape. Under extra conditions one may renormalize the scaled sample around a boundary point of the limit set so that individual points remain distinct. The renormalization may yield a second-order description of the local asymptotic behaviour in terms of a Poisson point process. The paper presents examples of such local expansions. The relationship between the second-order stochastic limits and the first-order deterministic limit is tenuous and not well understood at present. A good description of this renormalization is the challenge which our paper poses. The limit point process for coordinate-wise maxima may be regarded as a second-order expansion, but only if one restricts to points with finite coordinates. If the coordinate-wise maxima of the pair (U, V) of standardized risk variables have a limit distribution and one is interested in partial maxima of linear functionals  $aU+bV$, with a and b positive, the coordinate-wise limit theory will yield precise second-order asymptotic results which capture the random component of the maximum if U and V are tail dependent. If U and V are tail independent, the coordinate-wise limit is of little use. In that case the crude deterministic first-order results from the theory of limit sets treated in this paper give more information. So too for partial maxima of the functional
 $U\land V$, or
 $\sqrt{U^2+V^2}$.
Appendix A. Densities with given margins and limit sets
In this section, we show how to construct probability densities for which sample clouds can be scaled to converge onto one of the four limit sets described in Section 3.2 and which have prescribed margins. Here we consider the case of standard normal margins. In the case of the cross and lozenge, the margins are not exactly normal, but their tails are asymptotically equal to the standard normal tails.
Let  $\varphi$ denote the standard normal density. The ellipse E corresponds to a bivariate normal vector
 ${\mathbf Z}=(X,Y)$ with standard normal margins and correlation
 $\rho=-1/2$. Hence, the density generator is
 $f_*(t)=\phi(t)/c$ with
 $c=2\pi\sqrt{1-\rho^2}$. The density is
 $f_*(r_E)$.
If S is the cross, lozenge, or square, we choose homothetic densities of the form  $f=f_*(r_S)$, where
 $f_*$ is chosen so that
 ${\mathbb P}\{Y>t\}\sim \phi(t)/t$; i.e. the marginal tail is asymptotically equal to that of the standard normal distribution. Below we show that suitable choices of the density generator
 $f_*$ are
 $f_*(t)\sim \phi(t)/t$ for the cross,
 $f_*(t)\sim 8t\phi(t)/3$ for the lozenge, and
 $f_*(t)\sim \phi(t)/(2t)$ for the square.
Let  ${\mathbf Z}=(X,Y)$ and let
 $H_t$ denote the half-plane
 $\{y>t\}$. The high-risk scenario
 ${\mathbf Z}^{H_t}$ is the vector
 ${\mathbf Z}$ conditioned to lie in
 $H_t$. It has density
 $f{\mathbf{1}}_{H_t}/p_t$, where
 $p_t={\mathbb P}\{{\mathbf Z}\in H_t\}$. Let
 $t\to\infty$.
The crossC: By the Concentration Lemma (Lemma 4.2), we may replace C by the rectangle  $[-1/2,1/2]\times[-1,1]$. First assume
 $f_*(t)=\varphi(t)$. We claim that the high-risk scenarios converge:
 \begin{equation}(U_t,V_t)=\alpha_t^{-1}({\mathbf Z}^{H_t})\Rightarrow(U,V),\qquad \alpha_t(u,v)=(tu,t+v/t).\end{equation}
The components U and V are independent, U is uniform on  $({-}1/2,1/2)$, and V is standard exponential. Indeed
 $(U_t,V_t)$ has density
 $g_t(u,v)=f(tu,t+v/t)/p_t$ on the upper half-plane
 $H_0$, and
 \begin{equation*}g_t(u,v)/g_t(0,0)=f(tu,t+v/t)/f(0,t)\to1_{({-}1/2,1/2)}(u)e^{-v}.\end{equation*}
Since the right side is a density on  $H_0$, we see that
 $p_t\sim f(0,t)=f_*(t)$. If we choose
 $f_*(t)=\varphi(t)/t$ for
 $t>1$, then these computations give
 $p_t\sim \varphi(t)/t$.
The lozengeL: An initial shear will yield a quadrilateral determined by the points  $(0,\pm1)$ and
 $\pm(1,1/2)$. Take
 $f_*(t)=\varphi(t)$ as above and
 $\alpha_t(u,v)=(u/t,t+v/t)$. Then (A.1) holds with U and V independent, V standard exponential, and U a Laplace variable with density
 \begin{equation*}g(u,v)=(e^{-u/a}\land e^{u/b})/(a+b),\qquad a=2, b=2/3.\end{equation*}
The limit relations
 \begin{equation*}g_t(u,v)=f(u/t,t+v/t)/t^2/p_t\to g(u,v)\end{equation*}
and
 \begin{equation*}g_t(u,v)/g_t(0,0)=f(u/t,t+v/t)/f_*(t)\to8g(u,v)/3\end{equation*}
give  $p_t\sim3f_*(t)/t^2/8$. Hence we now take
 $f_*(t)=8t\varphi(t)/3$.
The squareQ: Observe that f is a pile of squares,  $f({\mathbf x})=\int_0^\infty1_{rQ}({\mathbf x})|f_*'(r)|dr$, and hence the marginal has the form
 \begin{equation*}f_1(x)=\int_0^\infty2r1_{rI}(x)|f_*'(r)|dr=\int_x^\infty 2r|f_*'(r)|dr,\end{equation*}
where  $I=[-1,1]$. Take
 $f_*(r)=(1-\Phi(r))/2$, where
 $\Phi$ is the standard normal df. Then
 $f_1(x)=\int_x^\infty r\varphi(r)dr=\varphi(x)$ is the standard normal density. In this case there is a homothetic density with standard normal margins.
We have glossed over the important distinction between  ${\bf L}^1$ convergence and pointwise convergence in the presentation above. For this see [Reference Balkema and Embrechts1] or [Reference Balkema and Nolde4].
Acknowledgements
We would like to thank the editor and two reviewers for constructive feedback and valuable comments. The authors are grateful to the director of RiskLab at the ETH Zurich for his hospitality. Part of the research was done while Guus Balkema was visiting the ETH on a grant from FIM in February 2013. Natalia Nolde acknowledges financial support from the Natural Sciences and Engineering Research Council of Canada.