




No CrossRef data available.
Article contents
Do the folk actually hold folk-economic beliefs?
Published online by Cambridge University Press: 30 August 2018
Abstract
Boyer & Petersen (B&P) argue that folk-economic beliefs are widespread – shaped by evolved cognitive systems – and they offer exemplar beliefs to illustrate their thesis. In this commentary, we highlight evidence of substantial variation in one of these exemplars: beliefs about immigration. Contra claims by B&P, we argue that the balance of this evidence suggests the “folk” may actually hold positive beliefs about the economic impact of immigration.
Information
- Type
- Open Peer Commentary
- Information
- Copyright
- Copyright © Cambridge University Press 2018
References
An, B. P. (2015) The role of social desirability bias and racial/ethnic composition on the relation between education and attitude toward immigration restrictionism. The Social Science Journal 52:459–67.Google Scholar
Berinsky, A. J. (2018) Telling the truth about believing the lies? Evidence for the limited prevalence of expressive survey responding. The Journal of Politics 80:211–24.Google Scholar
BSA 33, NatCen Social Research. (2015) Big majority believe immigration increases pressure on schools and hospitals [immigration tables]. British Social Attitudes Survey Report No. 33. Available at: http://www.bsa.natcen.ac.uk/media-centre/archived-press-releases/bsa-33-big-majority-believe-immigration-increases-pressure-on-schools-and-hospitals.aspx.Google Scholar
Bullock, J. G., Gerber, A. S., Hill, S. J. & Huber, G. A. (2015) Partisan bias in factual beliefs about politics. Quarterly Journal of Political Science 10:519–78.Google Scholar
Ford, R. & Lymperopoulou, K. (2017) Immigration: How attitudes in the UK compare with Europe. In: British Social Attitudes 34, pp. 1–30. NatCen Social Research. Available at: http://www.bsa.natcen.ac.uk/media/39148/bsa34_immigration_final.pdf.Google Scholar
Hainmueller, J. & Hiscox, M. J. (2007) Educated preferences: Explaining attitudes toward immigration in Europe. International Organization 61:399–442.Google Scholar
Héricourt, J. & Spielvogel, G. (2014) Beliefs, media exposure and policy preferences on immigration: Evidence from Europe. Applied Economics 46:225–39.Google Scholar
Janus, A. L. (2010) The influence of social desirability pressures on expressed immigration attitudes. Social Science Quarterly 91:928–46.Google Scholar
Kahan, D. M. (2016) The politically motivated reasoning paradigm, Part I: What politically motivated reasoning is and how to measure it. In: Emerging trends in social and behavioral sciences, ed. Scott, R. & Kosslyn, S., pp. 1–16. Wiley.Google Scholar
Pew Research Center (2017) Most say immigrants strengthen the country. Pew Research Center Survey Report. Available at: http://www.people-press.org/2017/10/05/4-race-immigration-and-discrimination/.Google Scholar
Prior, M., Sood, G. & Khanna, K. (2015) You cannot be serious: The impact of accuracy incentives on partisan bias in reports of economic perceptions. Quarterly Journal of Political Science 10:489–518.Google Scholar
Ueffing, P., Rowe, F. & Mulder, C. H. (2015) Differences in attitudes towards immigration between Australia and Germany: The role of immigration policy. Comparative Population Studies 40:437–64.Google Scholar
van der Linden, S. (2016) A conceptual critique of the cultural cognition thesis. Science Communication 38:128–38.Google Scholar
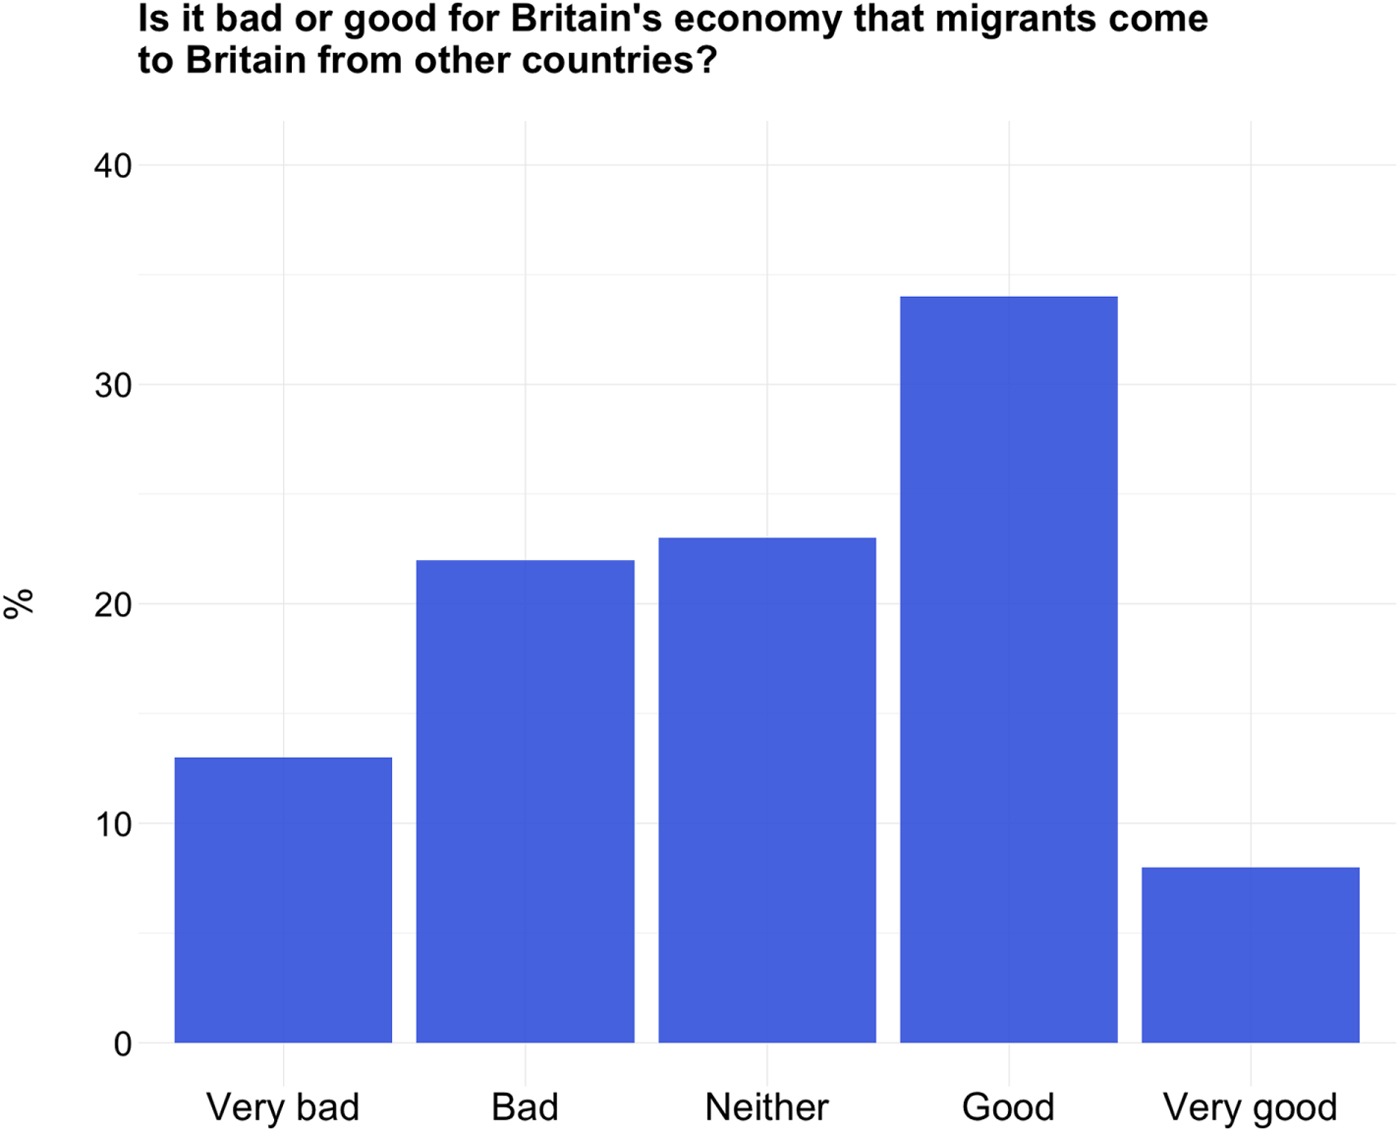
Figure 1. Distribution of reported beliefs about whether immigration is bad or good for the British economy. Data are from the 2015 British Social Attitudes Survey. In the survey, responses were provided on a 0–10 scale (0 = extremely bad; 10 = extremely good). The categories displayed on the x-axis are collapsed across values: 0–1 (very bad), 2–4 (bad), 5 (neither), 6–8 (good), and 9–10 (very good). N = 2,167, representative sample of British adults. Source: BSA 33, NatCen Social Research (2015).
A core feature of folk-economic beliefs (FEBs) according to Boyer & Petersen (B&P) is that they are widespread. There is evidence, however, of substantial variation in several of the exemplar FEBs that they draw upon to illustrate their thesis. For instance, beliefs about the economic impact of immigration vary – sometimes dramatically – as a function of educational attainment and political preference in the United States, Europe, and elsewhere. Furthermore, this evidence suggests that positive beliefs about the economic impact of immigration may actually be more prevalent than their negative counterparts, contrary to the exemplar beliefs B&P cite (sect. 2.1) as evidence for their thesis: that immigrants “steal jobs” (FEB 2) and abuse the welfare system (FEB 3).
Figure 1 displays the results of a recent representative survey of the attitudes of British adults (British Social Attitudes; BSA 33, NatCen Social Research 2015). The data reveal substantial variation; the proportion of Britons who believe immigration is “bad” or “very bad” for the economy is almost equal to those who believe that it is “good” or “very good.” Similarly, the results of the 2014 European Social Survey reports that 40% of Britons believe immigration is good for the economy, whereas 36% believe it is bad (Ford & Lymperopoulou Reference Ford and Lymperopoulou2017). Inferential analyses indicate that educational attainment is a reliable predictor of such variation; more positive beliefs about the economic impact of immigration are consistently observed among individuals with greater education (Hainmueller & Hiscox Reference Hainmueller and Hiscox2007; Héricourt & Spielvogel Reference Héricourt and Spielvogel2014; Ueffing et al. Reference Ueffing, Rowe and Mulder2015).
Distribution of reported beliefs about whether immigration is bad or good for the British economy. Data are from the 2015 British Social Attitudes Survey. In the survey, responses were provided on a 0–10 scale (0 = extremely bad; 10 = extremely good). The categories displayed on the x-axis are collapsed across values: 0–1 (very bad), 2–4 (bad), 5 (neither), 6–8 (good), and 9–10 (very good). N = 2,167, representative sample of British adults. Source: BSA 33, NatCen Social Research (2015).
Survey data from the United States reveals comparable variation in beliefs. According to a 2017 Pew survey, for example, 65% of North American adults believe that immigrants “strengthen the U.S. with their hard work and talents,” while 26% believe the opposite – that immigrants are a “burden.” This variation is strongly predicted by political identity; 84% of individuals who identify with the Democratic Party report the former belief, compared to only 42% of those who identify with the Republican Party (Pew Research Center 2017).
B&P do not specify how widespread an economic belief must be to be considered a folk-economic belief. Must the belief be universal, or merely held by a majority? The preceding evidence indicates that, at least in the context of immigration, the content of such beliefs is strongly variable, and, more notably, the average person (i.e., the “folk”) is perhaps more inclined to hold a positive belief about the economic impact of immigration. This stands in contrast to the exemplar (negative) FEBs about immigration proffered by B&P, which is significant because the inference mechanisms B&P propose to account for negative content – coalitional affiliation and cheater detection – seem less well-equipped to explain positive content. One could argue that more educated and more liberal individuals simply possess more accurate beliefs about the (positive) economic impact of immigration, leaving only the negative beliefs to be explained. But according to B&P's own view (sect. 1.4, para 5), accurate FEBs are unlikely to be due solely (if at all) to superior economic training, and, therefore, still require explanation.
Below, we briefly discuss recent work that offers one explanation for the cited variation in beliefs, and is able to account for both positive and negative content. Broadly speaking, this work suggests variation in beliefs on certain political issues is driven by intergroup processes. Because B&P specify a role for “coalitional” (intergroup) psychology within their model, this work might be integrated with their thesis to account for the variation discussed above.
A prominent line of work suggests that belief formation is affected by cultural conflict, such that, on particularly contested issues, individuals are motivated to form beliefs that signal whose “side” they are on (for a review, see Kahan Reference Kahan, Scott and Kosslyn2016; for a critique, see van der Linden Reference van der Linden2016). In other words, intergroup conflict induces an information-processing bias that drives systematic variation in beliefs: in this case, guiding individuals' beliefs about the economic impact of immigration further towards the belief (positive or negative) that typifies their group identity. B&P allude to such a process in the context of government control over the economy (sect. 6.2, para 4); here we explicitly note this mechanism as one explanation for the variation in beliefs about the economic impact of immigration.
Another possibility is that the variation is somewhat illusory – a product of “expressive responding” (Bullock et al. Reference Bullock, Gerber, Hill and Huber2015; Prior et al. Reference Prior, Sood and Khanna2015; for a critique, Berinsky Reference Berinsky2018). That is, individuals are prone to express group loyalties, but they harbor a more consonant representation of reality in private. Financially incentivizing accurate responses, as a case in point, diminishes disagreement between individuals of opposing political parties (Bullock et al. Reference Bullock, Gerber, Hill and Huber2015). Additional evidence for this proposition is observed in “list experiments,” where beliefs are elicited under a thicker cloak of anonymity than classic self-report methods afford. The results of several such experiments indicate that more-educated individuals report views about immigration closer to those of their lesser-educated counterparts when afforded this extra anonymity (e.g., An Reference An2015; Janus Reference Janus2010). One interpretation of these results is that more-educated individuals possess greater motivation to signal they are tolerant people. Interestingly, whether the cited variation in beliefs reflects expressive responding or sincere difference matters little for the role of intergroup psychology considered here. Variation in beliefs about immigration among the political left and right, and among the more- and less-educated, may indeed be more illusory than real; as suggested by the preceding evidence, however, such an illusion may itself be the product of intergroup processes.
B&P suggest that negative beliefs about the economic impact of immigration are folk beliefs, shaped by a combination of evolved cognitive systems. We have highlighted evidence of substantial variation in beliefs in this domain and evidence that the “folk” may be more inclined to hold positive beliefs about the economic impact of immigration. Consequently, we invite B&P to (i) more clearly specify how widespread an economic belief must be to be considered a folk-economic belief (and thus fall within the purview of their model), and (ii) consider how their model might account for widespread positive beliefs about the economic impact of immigration.
ACKNOWLEDGMENT
This work was supported by the Cogito Foundation [grant number R10917].