Jussim (Reference Jussim2012) argues that researchers strongly overemphasize errors, biases, and self-fulfilling prophecies in person perception and fail to sufficiently emphasize accuracy. In support of this claim, Jussim's literature review found mostly small effect sizes for errors, biases, and self-fulfilling prophecies and mostly larger effect sizes pertaining to the accuracy of people's perceptions. From our perspective, this focus on effect sizes suggests two interesting questions. First, even if the effect sizes are precisely how Jussim characterizes them, does this constitute a strong argument? Second, does Jussim's characterization hold up after correcting the reviewed effect sizes for attenuation due to unreliability of the construct measures?
To address the first question, let us consider a thought experiment. Suppose that the experimenter manipulates participants’ bias so that they expect one target person to be kind and another to be unkind. The experimenter subsequently presents the participants with one kind and one unkind behavior performed by each of the two target persons. Later, participants perform a recognition task where they are given a list of the four behaviors and indicate which target person performed each of them. From the point of view of bias, participants should assign both of the kind behaviors to the kind target person and both of the unkind behaviors to the unkind target person. From the point of view of accuracy, participants should be able to correctly assign the behaviors to the targets that performed them. Doubtless, if this experiment were to be performed, there would be an impressive accuracy effect size and a minuscule bias effect size.
But what if the experiment were modified in any of a variety of easily imaginable ways? For example, suppose that each target person performed 100 behaviors rather than two behaviors, and that there was a delay of a year between the presentation of the behaviors and the recognition task. In that case we would expect to obtain a strong effect size for bias and a small effect size for accuracy. Our specific point is that how one performs the experiment is likely to be a crucial determinant of the obtained effect size for bias or for accuracy. More generally, we note that for many dependent variables in social psychology, it is possible to design experiments to obtain small or large effects depending on what is desired.
Because it is easy to imagine thought experiments that would render small or large bias effects or accuracy effects, it is not clear that the effect sizes in the literature provide a strong reason to draw any conclusions whatsoever about the relative power of bias versus accuracy in people's lives. The most that can be concluded is that the literature contains mostly small bias effect sizes and mostly larger accuracy effect sizes, not that bias plays only a small role and that accuracy plays a larger role in typical human experience.
Our second point concerns correcting effect sizes due to the unreliability of measures, a notion derived from classical true-score theory or classical test theory (CTT). CTT introduces the concept of a true score on a test, which is the expected score for a person across a theoretically infinite set of independent test-taking occasions (see Gulliksen [Reference Gulliksen1987] and Lord & Novick [Reference Lord and Novick1968] for highly cited reviews). Each test includes the true score plus an error component, but because the error component is random, the expected value of error scores across infinite test taking occasions is zero. The goal is to represent the correlation between true scores (r
T
X
T
Y
) as a function of the observed correlation (r
XY
) and how reliable the two tests are (r
XX′
and r
YY′
). Equation 1 provides the way to estimate this (see Allen & Yen Reference Allen and Yen1979 for an accessible proof).
To grasp some implications of Equation 1, imagine that an observed correlation is 0.3 and test reliabilities are both perfect or both 0.6. What is the implication for the true correlation? In the case of perfect reliabilities, Equation 1 implies that the true correlation equals the observed correlation, so the answer is 0.3. In the case where the reliabilities are 0.6 for both tests, we have the following answer:
Whereas a correlation of 0.3 might not be considered a particularly large effect in many contexts, a correlation of 0.5 (as implied by Equation 2) might be considered substantially more impressive.
It is possible to simplify Equation 1 by speaking about the product of the reliabilities
 $\lpar {P = r_{XX^{\prime}} r_{YY^{\prime}} } \rpar $
so that Equation 1 simplifies to Equation 3 below. If the reliabilities of two tests are each at the borderline value of 0.6, the product is 0.36, which might be considered the lowest product to be “acceptable.”
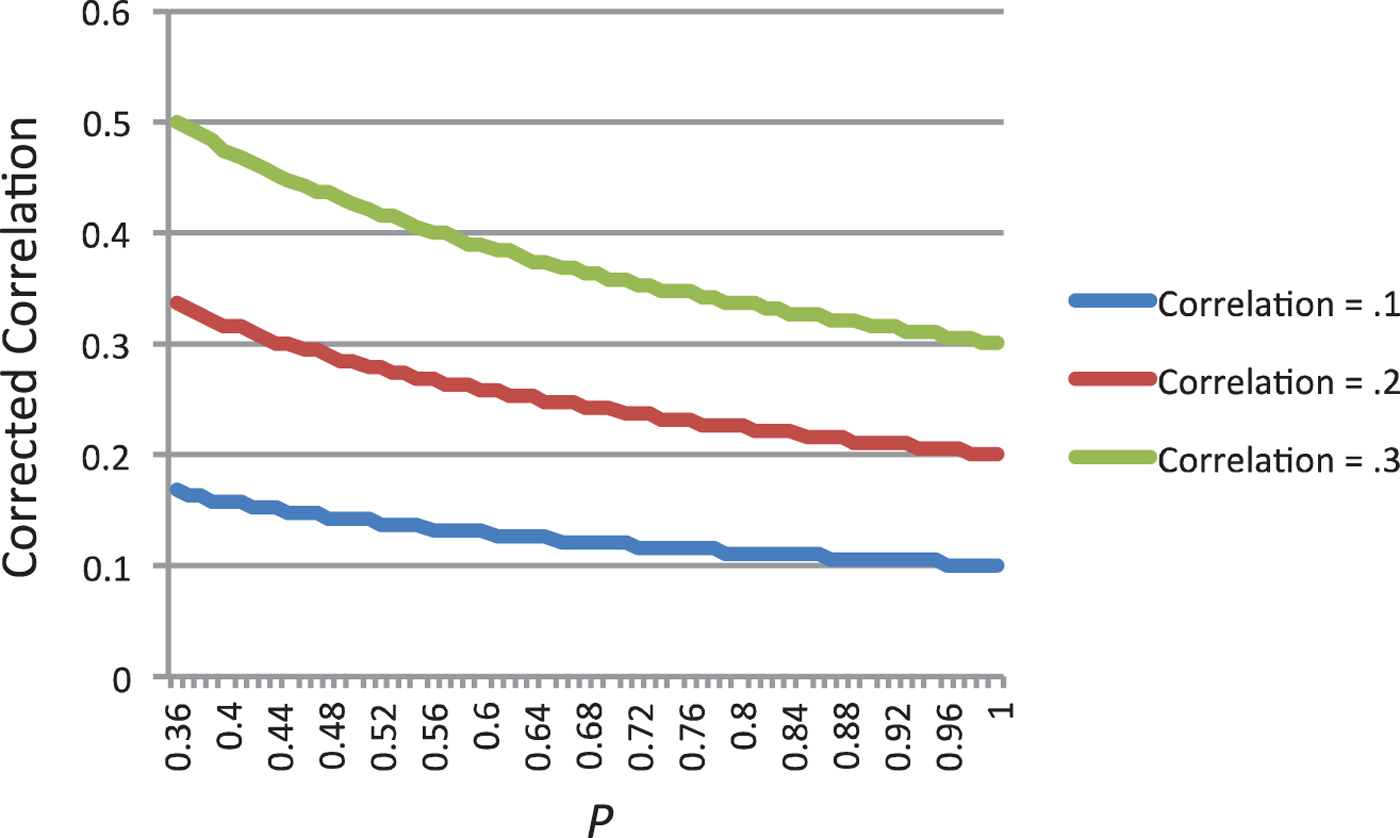
Jussim (Reference Jussim2012) mostly uses the correlation coefficient as the effect size measure, and so we will use that here. In the literatures (and particularly the meta-analyses) that Jussim's book reviews, the typical effect size values for errors, biases, and self-fulfilling prophecies tended to be slightly in excess of 0.2. We might consider a range from 0.10 to 0.30 as containing most of the effect sizes that have been reported. So what is implied about the range of corrected effect sizes, given a product (P) range of 0.36 to 1 and a reported effect size range of 0.10 to 0.30? Figure 1 explores this issue by allowing P to vary between 0.36 and 1 along the horizontal axis. There are three curves representing a “low” effect size of 0.1, a “typical” effect size of 0.2, and a “high” effect size of 0.3. When the low value is used, the corrected correlation ranges from 0.10 to 0.17, so that even assuming quite unreliable tests (where P = 0.36), the correction fails to render an impressive corrected effect size. Using a typical value of 0.2 for the effect size, the corrected correlation ranges from 0.20 to 0.33. Even with maximal correcting, the value of 0.33 can hardly be considered a strong advertisement for the power of errors, biases, and self-fulfilling prophecies. However, moving to the high effect size value of 0.3, the corrected correlation ranges from 0.30 to 0.50. Arguably, values near 0.50 contradict the assertion that errors, biases, and self-fulfilling prophecies do not matter very much.
Figure 1.
Corrected correlation coefficients for errors, biases, and self-fulfilling prophecies as a function of P (ranging from 0.36 to 1.0) and the obtained correlation coefficient (set at 0.1, 0.2, or 0.3).
There are many ways to look at these corrected effect sizes. We set a lower bound for P at 0.36 but this was arguably too low. There are many researchers who consider 0.7 the lower limit of “acceptable” reliability, in which case P would have a lower limit of 0.49 and the corrected correlations are 0.14, 0.29, and 0.42 for observed effect sizes of 0.1, 0.2, and 0.3, respectively. There are even those who advocate that 0.8 is the lower limit of acceptable reliability, in which case P would have a lower limit of 0.64, and the corrected correlations would be 0.13, 0.25, and 0.38 when the observed effect sizes are −0.1, 0.2, and 0.3, respectively. Of course, the issue is less what we consider to be acceptable reliability and more what the reliability values actually are in most research on errors, biases, and self-fulfilling prophecies. This is a difficult topic because there are different kinds of reliability (internal consistency, test-retest, and so on), there is much variance in actual reported values, and reliabilities of measures in these areas have not been subjected to thorough meta-analyses. To the extent it is assumed that researchers have mostly used reasonably reliable measures, Figure 1 supports Jussim's contention, whereas to the extent that one believes that many of the measures have not been reliable, the top curve in Figure 1 may undercut Jussim's claims.
Another complicating factor has to do with the meaning of reliability with regard to true experiments. In a true experiment, the “reliability” of the manipulation is likely to be close to 1, in the sense that everyone in the experimental condition really was in the experimental condition and everyone in the control condition really was in the control condition. Thus, for example, if the dependent variable in a true experiment has a reliability of 0.7, the implication is that P = 0.7, in which case the corrected correlation will be only a small improvement over the obtained one. Obviously, this factor pushes in the direction of supporting Jussim's claims about the literature. On the other hand, if one assumes that the manipulations in the experiments did not take for a substantial number of participants, this could potentially weaken Jussim's argument.
Yet another complicating factor is that it also is possible to convert effect sizes in the form of correlations into success rates (see Rosenthal & Rosnow Reference Rosenthal and Rosnow1991). To illustrate this, imagine a set of cancer patients in which half are treated and half are not treated. Under these binary strictures, Equation 4 gives the proportion of treated people who live, which is the “success rate” (S), as a function of the correlation coefficient (r).
Suppose that the corrected correlation is 0.4. The implication is that the success rate is 0.7, which can be interpreted as being rather impressive (although it must be compared to a baseline success rate of 0.5 due to chance). From this perspective, Jussim arguably was too harsh in his characterization of the literature, as even somewhat small effect sizes can indicate an impressive success rate. On the other hand, some argue that Equation 4 overestimates the success rate (e.g., Hsu Reference Hsu2004).
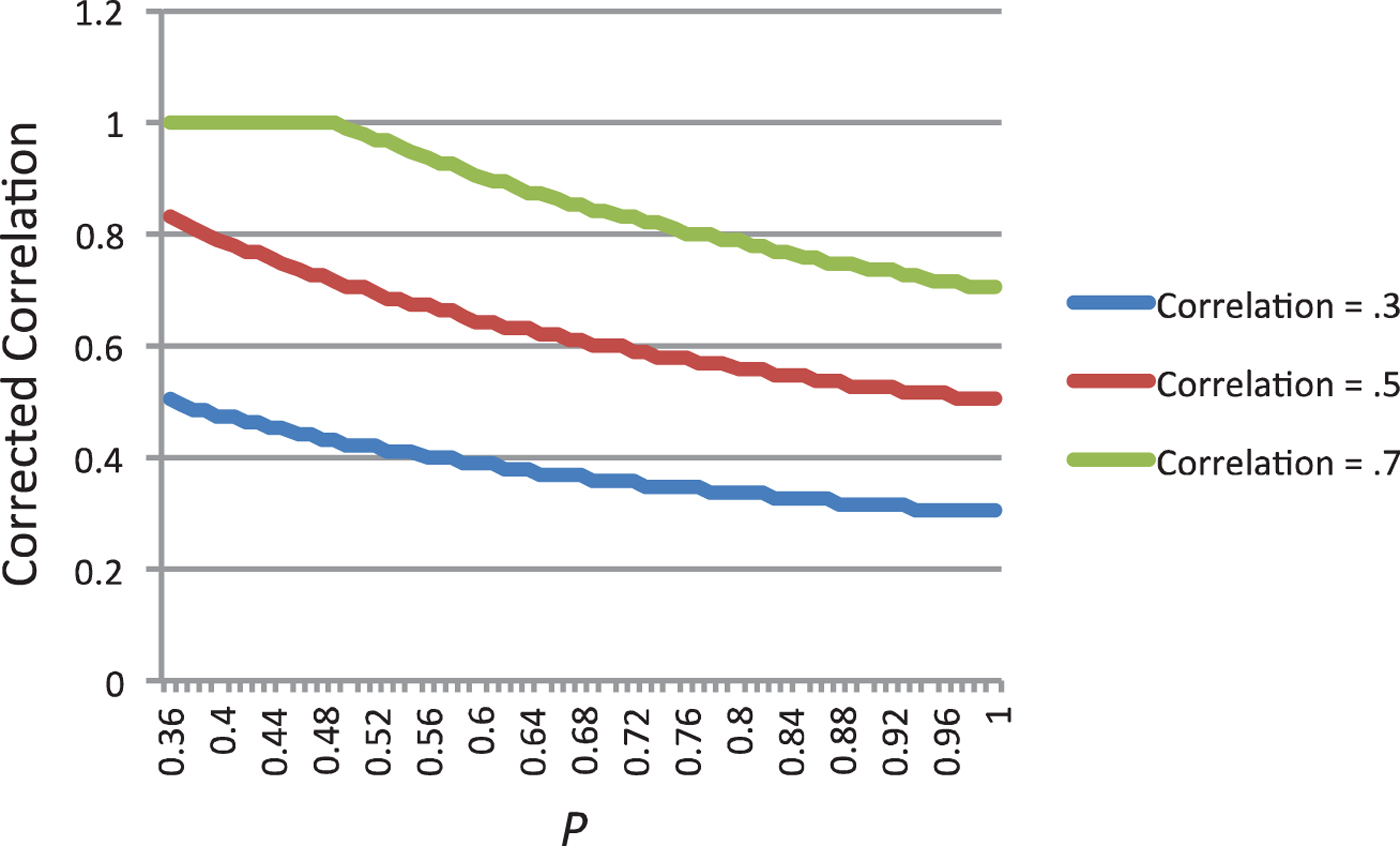
Correcting correlations also bears on Jussim's positive claims about powerful effect sizes in the accuracy literature. Based on Jussim's review, we might take a range of 0.3–0.7 to indicate the various accuracy effect sizes that were reported. Figure 2 illustrates the corrected correlation coefficients as a function of the obtained effect size, where the lower curve uses a low value of 0.3, the middle curve uses an intermediate value of 0.5, and the upper curve uses a high value of 0.7. The corrected correlations range from 0.30 to 0.50, from 0.50 to 0.83, and from 0.70 to 1.00, for the lower, middle, and top curves respectively. (Note that the top curve caps at 1.00.)
Figure 2.
Corrected correlation coefficients for accuracy as a function of P (ranging from 0.36 to 1.0) and the obtained correlation coefficient (set at 0.3, 0.5, or 0.7).
The issues we discussed above regarding the interpretation of Figure 1 similarly color the interpretation of Figure 2. Despite the complexity of these issues, Figures 1 and 2 clarify an important point. Given the disparity in corrected correlations concerning errors, biases, and self-fulfilling prophecies versus accuracy, a straightforward interpretation of Figures 1 and 2 implies that Jussim is correct in characterizing accuracy as more powerful. However, researchers who do not wish to accept this conclusion might consider the following possibility: Suppose someone were to go through the literature and show that the reliabilities of measures showing accuracy are substantially greater than those of measures showing errors, biases, and self-fulfilling prophecies. In that case, effect sizes linked to errors, biases, and self-fulfilling prophecies require more correction than effect sizes linked to accuracy; the corrected sets of correlations might be much closer than Figures 1 and 2 suggest; and an extreme disparity in reliabilities might even produce a reversal. Our guess, however, is that this strategy is unlikely to pan out in an impressive way.
Regarding the more abstract issue of the relative power of accuracy versus errors, biases, and self-fulfilling prophecies in everyday life, we emphasize the implications of the thought experiment with which we began this commentary. It is possible for researchers to attach too much value to effect sizes – even corrected ones! – found in the literature, given that it is obviously possible to design experiments in such a way as to artificially obtain dramatically different effect sizes. The seeming implication for those who wish to dispute Jussim's overall message is that they should perform experiments designed to generate small effect sizes for accuracy and large ones for errors, biases, and self-fulfilling prophecies. Until this happens, Figures 1 and 2 show that the weight of the evidence is on Jussim's side, at least for now.






 You have
Access
Jussim (Reference Jussim2012) argues that researchers strongly overemphasize errors, biases, and self-fulfilling prophecies in person perception and fail to sufficiently emphasize accuracy. In support of this claim, Jussim's literature review found mostly small effect sizes for errors, biases, and self-fulfilling prophecies and mostly larger effect sizes pertaining to the accuracy of people's perceptions. From our perspective, this focus on effect sizes suggests two interesting questions. First, even if the effect sizes are precisely how Jussim characterizes them, does this constitute a strong argument? Second, does Jussim's characterization hold up after correcting the reviewed effect sizes for attenuation due to unreliability of the construct measures?
To address the first question, let us consider a thought experiment. Suppose that the experimenter manipulates participants’ bias so that they expect one target person to be kind and another to be unkind. The experimenter subsequently presents the participants with one kind and one unkind behavior performed by each of the two target persons. Later, participants perform a recognition task where they are given a list of the four behaviors and indicate which target person performed each of them. From the point of view of bias, participants should assign both of the kind behaviors to the kind target person and both of the unkind behaviors to the unkind target person. From the point of view of accuracy, participants should be able to correctly assign the behaviors to the targets that performed them. Doubtless, if this experiment were to be performed, there would be an impressive accuracy effect size and a minuscule bias effect size.
But what if the experiment were modified in any of a variety of easily imaginable ways? For example, suppose that each target person performed 100 behaviors rather than two behaviors, and that there was a delay of a year between the presentation of the behaviors and the recognition task. In that case we would expect to obtain a strong effect size for bias and a small effect size for accuracy. Our specific point is that how one performs the experiment is likely to be a crucial determinant of the obtained effect size for bias or for accuracy. More generally, we note that for many dependent variables in social psychology, it is possible to design experiments to obtain small or large effects depending on what is desired.
Because it is easy to imagine thought experiments that would render small or large bias effects or accuracy effects, it is not clear that the effect sizes in the literature provide a strong reason to draw any conclusions whatsoever about the relative power of bias versus accuracy in people's lives. The most that can be concluded is that the literature contains mostly small bias effect sizes and mostly larger accuracy effect sizes, not that bias plays only a small role and that accuracy plays a larger role in typical human experience.
Our second point concerns correcting effect sizes due to the unreliability of measures, a notion derived from classical true-score theory or classical test theory (CTT). CTT introduces the concept of a true score on a test, which is the expected score for a person across a theoretically infinite set of independent test-taking occasions (see Gulliksen [Reference Gulliksen1987] and Lord & Novick [Reference Lord and Novick1968] for highly cited reviews). Each test includes the true score plus an error component, but because the error component is random, the expected value of error scores across infinite test taking occasions is zero. The goal is to represent the correlation between true scores (r T X T Y ) as a function of the observed correlation (r XY ) and how reliable the two tests are (r XX′ and r YY′ ). Equation 1 provides the way to estimate this (see Allen & Yen Reference Allen and Yen1979 for an accessible proof).
To grasp some implications of Equation 1, imagine that an observed correlation is 0.3 and test reliabilities are both perfect or both 0.6. What is the implication for the true correlation? In the case of perfect reliabilities, Equation 1 implies that the true correlation equals the observed correlation, so the answer is 0.3. In the case where the reliabilities are 0.6 for both tests, we have the following answer:
Whereas a correlation of 0.3 might not be considered a particularly large effect in many contexts, a correlation of 0.5 (as implied by Equation 2) might be considered substantially more impressive.
It is possible to simplify Equation 1 by speaking about the product of the reliabilities $\lpar {P = r_{XX^{\prime}} r_{YY^{\prime}} } \rpar $
so that Equation 1 simplifies to Equation 3 below. If the reliabilities of two tests are each at the borderline value of 0.6, the product is 0.36, which might be considered the lowest product to be “acceptable.”
Jussim (Reference Jussim2012) mostly uses the correlation coefficient as the effect size measure, and so we will use that here. In the literatures (and particularly the meta-analyses) that Jussim's book reviews, the typical effect size values for errors, biases, and self-fulfilling prophecies tended to be slightly in excess of 0.2. We might consider a range from 0.10 to 0.30 as containing most of the effect sizes that have been reported. So what is implied about the range of corrected effect sizes, given a product (P) range of 0.36 to 1 and a reported effect size range of 0.10 to 0.30? Figure 1 explores this issue by allowing P to vary between 0.36 and 1 along the horizontal axis. There are three curves representing a “low” effect size of 0.1, a “typical” effect size of 0.2, and a “high” effect size of 0.3. When the low value is used, the corrected correlation ranges from 0.10 to 0.17, so that even assuming quite unreliable tests (where P = 0.36), the correction fails to render an impressive corrected effect size. Using a typical value of 0.2 for the effect size, the corrected correlation ranges from 0.20 to 0.33. Even with maximal correcting, the value of 0.33 can hardly be considered a strong advertisement for the power of errors, biases, and self-fulfilling prophecies. However, moving to the high effect size value of 0.3, the corrected correlation ranges from 0.30 to 0.50. Arguably, values near 0.50 contradict the assertion that errors, biases, and self-fulfilling prophecies do not matter very much.
Corrected correlation coefficients for errors, biases, and self-fulfilling prophecies as a function of P (ranging from 0.36 to 1.0) and the obtained correlation coefficient (set at 0.1, 0.2, or 0.3).
There are many ways to look at these corrected effect sizes. We set a lower bound for P at 0.36 but this was arguably too low. There are many researchers who consider 0.7 the lower limit of “acceptable” reliability, in which case P would have a lower limit of 0.49 and the corrected correlations are 0.14, 0.29, and 0.42 for observed effect sizes of 0.1, 0.2, and 0.3, respectively. There are even those who advocate that 0.8 is the lower limit of acceptable reliability, in which case P would have a lower limit of 0.64, and the corrected correlations would be 0.13, 0.25, and 0.38 when the observed effect sizes are −0.1, 0.2, and 0.3, respectively. Of course, the issue is less what we consider to be acceptable reliability and more what the reliability values actually are in most research on errors, biases, and self-fulfilling prophecies. This is a difficult topic because there are different kinds of reliability (internal consistency, test-retest, and so on), there is much variance in actual reported values, and reliabilities of measures in these areas have not been subjected to thorough meta-analyses. To the extent it is assumed that researchers have mostly used reasonably reliable measures, Figure 1 supports Jussim's contention, whereas to the extent that one believes that many of the measures have not been reliable, the top curve in Figure 1 may undercut Jussim's claims.
Another complicating factor has to do with the meaning of reliability with regard to true experiments. In a true experiment, the “reliability” of the manipulation is likely to be close to 1, in the sense that everyone in the experimental condition really was in the experimental condition and everyone in the control condition really was in the control condition. Thus, for example, if the dependent variable in a true experiment has a reliability of 0.7, the implication is that P = 0.7, in which case the corrected correlation will be only a small improvement over the obtained one. Obviously, this factor pushes in the direction of supporting Jussim's claims about the literature. On the other hand, if one assumes that the manipulations in the experiments did not take for a substantial number of participants, this could potentially weaken Jussim's argument.
Yet another complicating factor is that it also is possible to convert effect sizes in the form of correlations into success rates (see Rosenthal & Rosnow Reference Rosenthal and Rosnow1991). To illustrate this, imagine a set of cancer patients in which half are treated and half are not treated. Under these binary strictures, Equation 4 gives the proportion of treated people who live, which is the “success rate” (S), as a function of the correlation coefficient (r).
Suppose that the corrected correlation is 0.4. The implication is that the success rate is 0.7, which can be interpreted as being rather impressive (although it must be compared to a baseline success rate of 0.5 due to chance). From this perspective, Jussim arguably was too harsh in his characterization of the literature, as even somewhat small effect sizes can indicate an impressive success rate. On the other hand, some argue that Equation 4 overestimates the success rate (e.g., Hsu Reference Hsu2004).
Correcting correlations also bears on Jussim's positive claims about powerful effect sizes in the accuracy literature. Based on Jussim's review, we might take a range of 0.3–0.7 to indicate the various accuracy effect sizes that were reported. Figure 2 illustrates the corrected correlation coefficients as a function of the obtained effect size, where the lower curve uses a low value of 0.3, the middle curve uses an intermediate value of 0.5, and the upper curve uses a high value of 0.7. The corrected correlations range from 0.30 to 0.50, from 0.50 to 0.83, and from 0.70 to 1.00, for the lower, middle, and top curves respectively. (Note that the top curve caps at 1.00.)
Corrected correlation coefficients for accuracy as a function of P (ranging from 0.36 to 1.0) and the obtained correlation coefficient (set at 0.3, 0.5, or 0.7).
The issues we discussed above regarding the interpretation of Figure 1 similarly color the interpretation of Figure 2. Despite the complexity of these issues, Figures 1 and 2 clarify an important point. Given the disparity in corrected correlations concerning errors, biases, and self-fulfilling prophecies versus accuracy, a straightforward interpretation of Figures 1 and 2 implies that Jussim is correct in characterizing accuracy as more powerful. However, researchers who do not wish to accept this conclusion might consider the following possibility: Suppose someone were to go through the literature and show that the reliabilities of measures showing accuracy are substantially greater than those of measures showing errors, biases, and self-fulfilling prophecies. In that case, effect sizes linked to errors, biases, and self-fulfilling prophecies require more correction than effect sizes linked to accuracy; the corrected sets of correlations might be much closer than Figures 1 and 2 suggest; and an extreme disparity in reliabilities might even produce a reversal. Our guess, however, is that this strategy is unlikely to pan out in an impressive way.
Regarding the more abstract issue of the relative power of accuracy versus errors, biases, and self-fulfilling prophecies in everyday life, we emphasize the implications of the thought experiment with which we began this commentary. It is possible for researchers to attach too much value to effect sizes – even corrected ones! – found in the literature, given that it is obviously possible to design experiments in such a way as to artificially obtain dramatically different effect sizes. The seeming implication for those who wish to dispute Jussim's overall message is that they should perform experiments designed to generate small effect sizes for accuracy and large ones for errors, biases, and self-fulfilling prophecies. Until this happens, Figures 1 and 2 show that the weight of the evidence is on Jussim's side, at least for now.