Dairy calf rearing that allows for cow-calf contact has been highlighted as a management strategy that the public views favourably (Cardoso et al., Reference Cardoso, Von Keyserlingk and Hötzel2017; Hötzel et al., Reference Hötzel, Cardoso, Roslindo and von Keyserlingk2017). Contact with the mother or adult conspecifics have been observed to impact the social development of juveniles (Takahashi et al., Reference Takahashi, Jonas, Ransjöarvidson, Lidfors, Uvnäs Moberg and Nissen2015). One of the most common ways to stress animals during the early postnatal period is maternal separation and this stress is due to abrupt disruption of dam–calf bond, depriving the calf of maternal comfort, nutrition and social security, which activates stress responses during a critical developmental period (Fumagalli et al., Reference Fumagalli, Molteni, Racagni and Riva2007; Meagher et al., Reference Meagher, Beaver, Weary and von Keyserlingk2019). Under Indian conditions, calves may be weaned as early as the first day after birth or as late as 90 days of age, depending on the rearing system. In commercial farms, early weaning is commonly practiced, whereas in rural areas and by smallholder farmers, late weaning is generally followed (Kamboj and Kumar, Reference Kamboj and Kumar2013; Bharti et al., Reference Bharti, Dutt, Patel, Pandey, Ojha, Kamal and Gaur2018). Separating calves from their mothers within 24 hours after parturition has sparked the public's disapproval (Busch et al., Reference Busch, Weary, Spiller and von Keyserlingk2017). Levels of fearfulness, boldness, exploratory behaviour, social interaction and the ability to cope with stressful situations are all attributes that vary between individuals (Foris et al., Reference Foris, Zebunke, Langbein and Melzer2018; Lecorps et al., Reference Lecorps, Kappel, Weary and von Keyserlingk2018). Raising young cattle isolated from adults deprives these animals of the opportunity to learn species-specific behaviour from the adults and may result in impaired social learning and the development of aberrant behaviours in cattle (Gaillard et al., Reference Gaillard, Meagher, Von Keyserlingk and Weary2014; Johnsen et al., Reference Johnsen, Zipp, Kälber, de Passillé, Knierim, Barth and Mejdell2016). Alternative systems that allow dam–calf contact are gaining popularity (Brombin et al., Reference Brombin, Pezzuolo and Brščić2019). Rearing calves with their dams has been demonstrated to minimize fearfulness, improve social competence, increase watchful behaviour and is thought to have a long-term effect on the docility of the calves (Buchli et al., Reference Buchli, Raselli, Bruckmaier and Hillmann2017). Another important factor that has a calming effect on the calves is suckling from the dam (Hänninen et al., Reference Hänninen, Hepola, Raussi and Saloniemi2008). During their early life, calves experience diet changes as well as new social and physical environments, all of which are considered stressors that compromise their performance and welfare; signs of this include increased undesirable social behaviours and increased distress responses (De Paula Vieira et al., Reference De Paula Vieira, von Keyserlingk and Weary2010; Bolt et al., Reference Bolt, Boyland, Mlynski, James and Croft2017). The adaptive capability of the calves may be influenced by their cognitive ability, as calves with stronger cognitive abilities can exhibit more flexible behaviour, and increased behavioural flexibility may help calves better adapt to environmental changes (Horvath and Miller-Cushon, Reference Horvath and Miller-Cushon2019). Calves raised with dam contact are more interactive in a confrontation test than calves raised without dam contact (Wagner et al., Reference Wagner, Barth, Hillmann, Palme, Futschik and Waiblinger2013). Because this is a critical stage in brain development and might influence later behavioural flexibility in animals, social housing has been widely investigated as a way to improve the ability of calves to adjust to environmental changes (Meagher et al., Reference Meagher, Daros, Costa, Von Keyserlingk, Hötzel and Weary2015). The ability to characterize animals based on personality traits has many practical applications in animal production, such as ease of management, genetic selection and animal welfare implications, such as enhanced locomotor activity as an indicator of stress (Pérez et al., Reference Pérez, Orihuela, Galina, Rubio, Corro, Cohen and Hernández2017). Individual differences in traits can affect how calves and cows cope with early transitions and stressors on a commercial dairy farm and how they function overall. As a result, we designed this study in order to address the issue of weaning of Sahiwal calves from their dams to assess behavioural regulation through different tests in a holistic manner.
Materials and methods
The study was undertaken at Livestock Research Centre, ICAR-National Dairy Research Institute, Karnal, Haryana, India located 250 m above sea level at 29.420 N latitude and 79.540 E longitudes. The area experiences hot summers with temperatures often exceeding 40°C, and relatively cold winters, where temperatures can drop to around 5°C. The experiment began in March 2023 and ended in November 2023.
The Institutional Animal Ethics Committee approved the study, which was conducted following IAEC established standards as per Article Number 13 of the committee for the Control and Supervision of Experiments on Animals (CPCSEA) policies of the Government of India.
Grouping of experimental animals
Sixteen newborn calves were allocated into 2 groups of 8 calves each: FMC (fenceline mother-calf contact) and SM (separated mother-calf). In FMC, following calving, calves suckled colostrum directly from their dams twice daily for the first 5 days. Thereafter, a wire mesh fenceline separated the dam and calf for whole day, allowing visual, tactile and audio contact but restricting milk suckling to twice daily during morning and evening milking. Calves in SM group were separated from their dams at birth and housed together. Colostrum was fed via nipple bottle for the first 5 days, followed by milk feeding using the same method.
Housing of experimental animals
The study was conducted in a well-ventilated, spacious shelter designed for group housing of calves and their dams under the two experimental conditions. The FMC group of calves was housed with fenceline contact, allowing visual, olfactory and tactile interactions with their mothers through a sturdy physical barrier. The SM group was separated by a curtained barrier, eliminating visual contact and ensuring no physical interaction by maintaining distance between calves and dams. The shelter maintained optimal environmental conditions through regulated ventilation, a 12 hour light-dark cycle. Rigorous daily cleaning and sanitization was carried out to ensure good standards of animal welfare and hygiene.
Feeding of animals
Throughout the study, all animals were provided with ad libitum access to fresh water and a nutritionally balanced diet. Calves in the separated group were housed in specialized pens and managed using standardized farm protocols, including a consistent feeding schedule. During the first 5 days post-birth, all SM received colostrum, followed by milk feeding twice daily via nipple bottles, with careful attention to maintaining milk temperature for optimal digestion. In contrast, FMC calves suckled colostrum directly from their dams during morning and evening sessions, promoting natural bonding. After the colostrum period, these calves continued to suckle milk from its dam during routine milking times, supporting ongoing maternal interaction and a natural feeding experience.
Calf behavioural response tests
Social reactivity: In both FMC and SM groups, the responses of calves to an unfamiliar calf and an unfamiliar human were assessed using a 5 minute social reactivity test conducted monthly during the first 3 months of age. The test aimed to evaluate social and exploratory behaviour in a controlled environment. A range of behavioural parameters was recorded for each calf to quantify their reactions to unfamiliar individuals. These parameters included (i) Idle standing time: duration for which the calf remained standing without engaging in any specific activity. (ii) Time spent looking at the unfamiliar calf/human: total duration the calf spent visually fixating on the unfamiliar individual. (iii) Time spent sniffing the unfamiliar calf/human: duration of olfactory investigation directed towards the unfamiliar individual. (iv) Time spent in proximity to the unfamiliar calf/human: time the calf spent within close range of the unfamiliar individual. (v) Time spent displaying agitation: duration of visible signs of restlessness or agitation exhibited by the calf within the test arena. (vi) Frequency of looking at the unfamiliar calf/human: number of distinct instances the calf looked towards the unfamiliar individual. (vii) Frequency of butting behaviour: number of occurrences of physical butting directed at the unfamiliar calf or human. (viii) Number of escape attempts: count of the calf's attempts to move away from or avoid the unfamiliar individual.
Preference tests: To assess social preferences of calves towards unfamiliar calf/human, a 2 minute preference test was conducted for each calf at fortnightly intervals. During the test, each calf was given the choice to interact with either an unfamiliar calf or an unfamiliar human. The choice made was recorded to determine social inclination. Calves were categorized into three groups based on their responses: ‘Preferred calf’ indicated preference for interaction with the unfamiliar calf; ‘Preferred human’ denoted preference for the unfamiliar human; and ‘Preferred none’ represented calves that showed no clear preference for either. The distribution of these preferences was analysed across both treatment groups to evaluate differences in social behaviour.
Assessment of fear in a fear-eliciting situation using the umbrella test: To assess the fear response of calves under different treatment conditions, an umbrella test was conducted at fortnightly intervals, with each session lasting 5 minutes. This test involved the sudden opening of an umbrella to create a fear-eliciting stimulus, and a series of behavioural parameters were recorded to evaluate the calves’ responses. These included the latency to start eating or drinking, defined as the time taken by the calf to resume feeding or drinking following the umbrella's opening. The time spent standing idle referred to the duration the calf remained stationary without engaging in any specific activity immediately after the stimulus. The time spent making escape attempts was measured as the total time the calf actively tried to flee the test arena, indicating heightened fear or distress. A reaction score was assigned to quantify the calf's immediate behavioural response to the umbrella stimulus, using a scale from 0 to 3: 0 = no reaction; 1 = stops eating but does not move back; 2 = stops eating and takes one step back and 3 = stops eating and takes several steps back. Additionally, latency to resume eating was recorded to assess the recovery time post-stimulus. Finally, the number of vocalizations made after the umbrella was opened was counted as an indicator of emotional reactivity.
Assessment of reactivity to familiar human: To evaluate the behavioural response of calves towards a familiar human handler, observations were conducted during the weekly routine farm recording of body weight. A series of behavioural parameters were recorded to assess the calves’ interactions with the handler. These included the latency to approach the handler, defined as the time taken by the calf to voluntarily approach the handler, with a maximum observation period of 90 sec. A binary retreat response was noted to indicate whether the calf retreated from the handler during the interaction (1 = yes, 0 = no), along with the number of retreats, representing the frequency of backward movements made by the calf. The difficulty of placing the calf on the weighing scale was scored on a scale from 1 to 4: 1 = guided gently onto the scale; 2 = some pushing required; 3 = one person pushing with maximum effort; 4 = two people required to place the calf onto the scale. Additionally, the number of gentle pushes administered by the handler to assist the calf onto the scale was recorded. A binary indicator of urination was also noted (1 = yes, 0 = no), as a possible sign of stress. Lastly, the time taken to position the calf on the scale was measured to assess the ease or difficulty of handling.
Statistical analysis
The data generated after conducting the experiment was analysed using statistical procedure described by Snedecor and Cochran (Reference Snedecor and Cochran1994). Treatment, time and their interaction were included as fixed effects, and the individual calves were included as random effects. Differences were considered statistically significant when P < 0.05. Results are presented as LS means ± SEM. The significant difference between the mean values of various parameters studied in two groups were compared using mixed model which was carried out using SPSS computer software version 23.0. Data graphs were prepared using Graph Pad Prism 8.0 San Diego California USA.
Results
Social reactivity assessment of calves from their response to an unfamiliar calf
Figure 1a shows that FMC calves exhibited significantly longer idle standing times than SM calves throughout most of the experiment, except in week 8. Although both groups initially spent similar amounts of time observing the unfamiliar calf (Fig. 1b), a trend emerged from week 9 onwards, with FMC calves showing increased attention, which was statistically significant in weeks 11 and 12. Sniffing behaviour was comparable in the early weeks but significantly more pronounced in FMC calves from week 5 onwards (Fig. 1c). FMC calves consistently spent more time in proximity to the unfamiliar calf across all weeks (Fig. 1d) and displayed significantly lower levels of agitation throughout the study period (Fig. 1e). While both groups initially showed similar frequencies of looking at the calf, FMC calves exhibited a significantly higher frequency from week 8 onwards (Fig. 1f). Similarly, butting behaviour was significantly higher in FMC calves from week 5 (Fig. 1g), indicating more active and possibly dominant social engagement. SM calves demonstrated a higher frequency of escape attempts, particularly during the early weeks (Fig. 1h). These findings suggest that fenceline rearing fosters more positive social behaviours and reduces stress-related responses in calves compared to complete separation.
Behavioural responses of calves as mean ± SE in two groups during the social reactivity test near an unfamiliar calf. (a) Idle standing time; (b) time spent looking at unfamiliar calf; (c) time spent sniffing unfamiliar calf; (d) time spent near unfamiliar calf; (e) time spent agitated in arena; (f) frequency of looking at unfamiliar calf; (g) frequency of butting; (h) number of escape attempts during the test.

Figure 1 Long description
The image A showing a line graph labeled a. Vertical axis label: Idle standing time (sec). Range: 160 to 240. Horizontal axis label: Age (weeks). Range: 1 to 12. Legend labels: Fenceline calves; Separated calves. Line identification by markers: Fenceline calves use circle markers; Separated calves use square markers. Trend description: Both series rise from week 1 to week 12. The circle-marker series stays above the square-marker series across the weeks. The circle-marker series rises quickly by about week 3 and then stays near a flatter level through later weeks. The square-marker series rises more gradually and then levels off in later weeks. The image B showing a line graph labeled b. Vertical axis label: Time spent looking at calf (sec). Range: 20 to 45. Horizontal axis label: Age (weeks). Range: 1 to 12. Legend labels: Fenceline calves; Separated calves. Line identification by markers: Fenceline calves use circle markers; Separated calves use square markers. Trend description: Both series increase across weeks. The circle-marker series increases more strongly after the early weeks and remains above the square-marker series through later weeks. The square-marker series increases more slowly and shows a flatter section around the middle weeks before rising again. The image C showing a line graph labeled c. Vertical axis label: Time spent sniffing calf (sec). Range: 0 to 40. Horizontal axis label: Age (weeks). Range: 1 to 12. Legend labels: Fenceline calves; Separated calves. Line identification by markers: Fenceline calves use circle markers; Separated calves use square markers. Trend description: The circle-marker series increases from the early weeks to week 12, with a noticeable rise around the middle weeks and higher values in the later weeks. The square-marker series increases slightly across weeks and stays below the circle-marker series throughout. The image D showing a line graph labeled d. Vertical axis label: Time spent near calf (sec). Range: 0 to 60. Horizontal axis label: Age (weeks). Range: 1 to 12. Legend labels: Fenceline calves; Separated calves. Line identification by markers: Fenceline calves use circle markers; Separated calves use square markers. Trend description: Both series increase across weeks. The circle-marker series rises sharply in the early weeks and then stays near a flatter level in later weeks. The square-marker series rises gradually and remains below the circle-marker series across all weeks. The image E showing a line graph labeled e. Vertical axis label: Time spent agitated (sec). Range: 60 to 140. Horizontal axis label: Age (weeks). Range: 1 to 12. Legend labels: Fenceline calves; Separated calves. Line identification by markers: Fenceline calves use circle markers; Separated calves use square markers. Trend description: Both series decrease across weeks. The circle-marker series drops strongly in the early weeks and then stays lower in later weeks. The square-marker series decreases more gradually and remains above the circle-marker series across the weeks. The image F showing a line graph labeled f. Vertical axis label: Frequency of looking at calf. Range: 0 to 15. Horizontal axis label: Age (weeks). Range: 1 to 12. Legend labels: Fenceline calves; Separated calves. Line identification by markers: Fenceline calves use circle markers; Separated calves use square markers. Trend description: Both series increase across weeks. The circle-marker series rises steadily and stays above the square-marker series, with the gap becoming clearer in later weeks. The square-marker series rises more slowly and levels off slightly toward the end. The image G showing a line graph labeled g. Vertical axis label: Frequency of butting. Range: 0 to 8. Horizontal axis label: Age (weeks). Range: 1 to 12. Legend labels: Fenceline calves; Separated calves. Line identification by markers: Fenceline calves use circle markers; Separated calves use square markers. Trend description: Both series increase across weeks. The circle-marker series rises more strongly, especially in later weeks and remains above the square-marker series. The square-marker series increases more gradually and stays lower across the weeks. The image H showing a line graph labeled h. Vertical axis label: No. of escape attempts. Range: 8 to 20. Horizontal axis label: Age (weeks). Range: 1 to 12. Legend labels: Fenceline calves; Separated calves. Line identification by markers: Fenceline calves use circle markers; Separated calves use square markers. Trend description: The circle-marker series shows a gradual decrease from early to later weeks. The square-marker series stays higher than the circle-marker series and shows a slight decline toward later weeks. Overall message across the eight graphs: Across age in weeks, the circle-marker series is higher for idle standing time, time spent looking at calf, time spent sniffing calf, time spent near calf, frequency of looking at calf and frequency of butting, while the square-marker series is higher for time spent agitated and number of escape attempts.
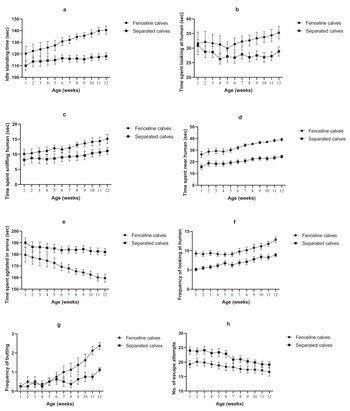
Social reactivity assessment of calves from their response to an unfamiliar human
In the initial weeks (1–4), no significant differences were observed in idle standing time, sniffing duration or butting frequency between the two groups (Fig. 2a,c,g). However, from week 5 onwards, SM calves consistently showed significantly shorter idle standing times, lower proximity to the human and reduced engagement behaviours (sniffing and looking), suggesting greater avoidance. FMC calves, in contrast, spent more time near the unfamiliar human (Fig. 2d) and exhibited a higher frequency of looking and butting behaviours (Fig. 2f), particularly in the later weeks (8–12), reflecting increased social engagement and assertiveness. Agitation levels were higher in SM calves, becoming significantly distinct from week 5 and remaining elevated throughout the study (Fig. 2e). While both groups initially showed a high number of escape attempts, SM calves attempted escape more frequently (Fig. 2h). This difference diminished over time and became statistically non-significant by week 5, indicating acclimatization.
Behavioural responses of calves as mean ± SE in two groups during the social reactivity test near an unfamiliar human. (a) Idle standing time; (b) time spent looking at unfamiliar human; (c) time spent sniffing unfamiliar human; (d) time spent near unfamiliar human; (e) time spent agitated in arena; (f) frequency of looking at unfamiliar human; (g) frequency of butting; (h) number of escape attempts during the test.

Figure 2 Long description
The image A showing a line graph labeled a. Legend: Fenceline calves; Separated calves. Fenceline calves are marked with circles. Separated calves are marked with squares. Horizontal axis label: Age (weeks). Horizontal axis values: 1 to 12. Vertical axis label: Idle standing time (sec). Vertical axis range: 100 to 150. The fenceline calves line rises from about 120 sec at week 1 to about 140 sec at week 12. The separated calves line rises from about 110 sec at week 1 to about 118 sec at week 12. The gap between the two lines increases from about 10 sec at week 1 to about 22 sec at week 12. The image B showing a line graph labeled b. Legend: Fenceline calves; Separated calves. Fenceline calves are marked with circles. Separated calves are marked with squares. Horizontal axis label: Age (weeks). Horizontal axis values: 1 to 12. Vertical axis label: Time spent looking at human (sec). Vertical axis range: 20 to 40. The fenceline calves line is about 32 sec at week 1, dips to about 30 sec around weeks 4 to 5, then rises to about 35 sec at week 12. The separated calves line is about 30 sec at week 1, dips to about 27 sec around weeks 4 to 5, then rises to about 29 sec at week 12. The fenceline calves values are higher than separated calves from about week 6 through week 12. The image C showing a line graph labeled c. Legend: Fenceline calves; Separated calves. Fenceline calves are marked with circles. Separated calves are marked with squares. Horizontal axis label: Age (weeks). Horizontal axis values: 1 to 12. Vertical axis label: Time spent sniffing human (sec). Vertical axis range: 0 to 20. The fenceline calves line increases from about 10 sec at week 1 to about 15 sec at week 12. The separated calves line increases from about 8 sec at week 1 to about 11 sec at week 12. The difference between groups is about 2 sec at week 1 and about 4 sec at week 12. The image D showing a line graph labeled d. Legend: Fenceline calves; Separated calves. Fenceline calves are marked with circles. Separated calves are marked with squares. Horizontal axis label: Age (weeks). Horizontal axis values: 1 to 12. Vertical axis label: Time spent near human (sec). Vertical axis range: 0 to 50. The fenceline calves line increases from about 27 sec at week 1 to about 39 sec at week 12, with a rise after about week 5. The separated calves line increases from about 17 sec at week 1 to about 24 sec at week 12. The gap is about 10 sec at week 1 and about 15 sec at week 12. The image E showing a line graph labeled e. Legend: Fenceline calves; Separated calves. Fenceline calves are marked with circles. Separated calves are marked with squares. Horizontal axis label: Age (weeks). Horizontal axis values: 1 to 12. Vertical axis label: Time spent agitated in arena (sec). Vertical axis range: 150 to 200. The fenceline calves line decreases from about 180 sec at week 1 to about 160 sec at week 12. The separated calves line is about 190 sec at week 1 and declines slightly to about 183 sec at week 12. The separated calves values are higher than fenceline calves across weeks 1 to 12, with the largest separation near week 12 at about 23 sec. The image F showing a line graph labeled f. Legend: Fenceline calves; Separated calves. Fenceline calves are marked with circles. Separated calves are marked with squares. Horizontal axis label: Age (weeks). Horizontal axis values: 1 to 12. Vertical axis label: Frequency of looking at human. Vertical axis range: 0 to 15. The fenceline calves line is about 9 at week 1, stays near 9 through about week 6, then rises to about 13 at week 12. The separated calves line rises from about 5 at week 1 to about 9 at week 12. The difference is about 4 at week 1 and about 4 at week 12. The image G showing a line graph labeled g. Legend: Fenceline calves; Separated calves. Fenceline calves are marked with circles. Separated calves are marked with squares. Horizontal axis label: Age (weeks). Horizontal axis values: 1 to 12. Vertical axis label: Frequency of butting. Vertical axis range: 0 to 3. The fenceline calves line is about 0.2 at week 1, stays below about 0.6 through about week 6, then rises to about 2.4 at week 12. The separated calves line is about 0.2 at week 1 and rises to about 1.1 at week 12. The largest separation is at week 12 at about 1.3. The image H showing a line graph labeled h. Legend: Fenceline calves; Separated calves. Fenceline calves are marked with circles. Separated calves are marked with squares. Horizontal axis label: Age (weeks). Horizontal axis values: 1 to 12. Vertical axis label: No. of escape attempts. Vertical axis range: 10 to 30. The fenceline calves line decreases from about 20 at week 1 to about 17 at week 12. The separated calves line decreases from about 24 at week 1 to about 19 at week 12. The separated calves values are higher than fenceline calves across weeks 1 to 12, with a difference of about 4 at week 1 and about 2 at week 12. Across images A to H, both groups are plotted across age 1 to 12 weeks with error bars. Fenceline calves are higher than separated calves in idle standing time, time spent looking at human, time spent sniffing human, time spent near human, frequency of looking at human and frequency of butting. Separated calves are higher than fenceline calves in time spent agitated in arena and number of escape attempts.
Preference test for calves in two groups
An equal proportion of calves in both treatment groups (56.25%) preferred interaction with the unfamiliar calf, highlighting the inherent social nature of calves regardless of weaning method. However, distinct differences emerged in preferences for human interaction and lack of preference. A greater proportion of FMC calves (25.00%) showed a preference for the unfamiliar human compared to SM calves (12.50%), suggesting that continued visual and limited physical contact with the mother may enhance calves’ confidence and willingness to engage with humans. Conversely, a higher percentage of SM calves (31.25%) exhibited no clear preference for either stimulus, compared to FMC calves (18.75%), potentially indicating reduced social motivation or higher stress levels in the absence of maternal contact.
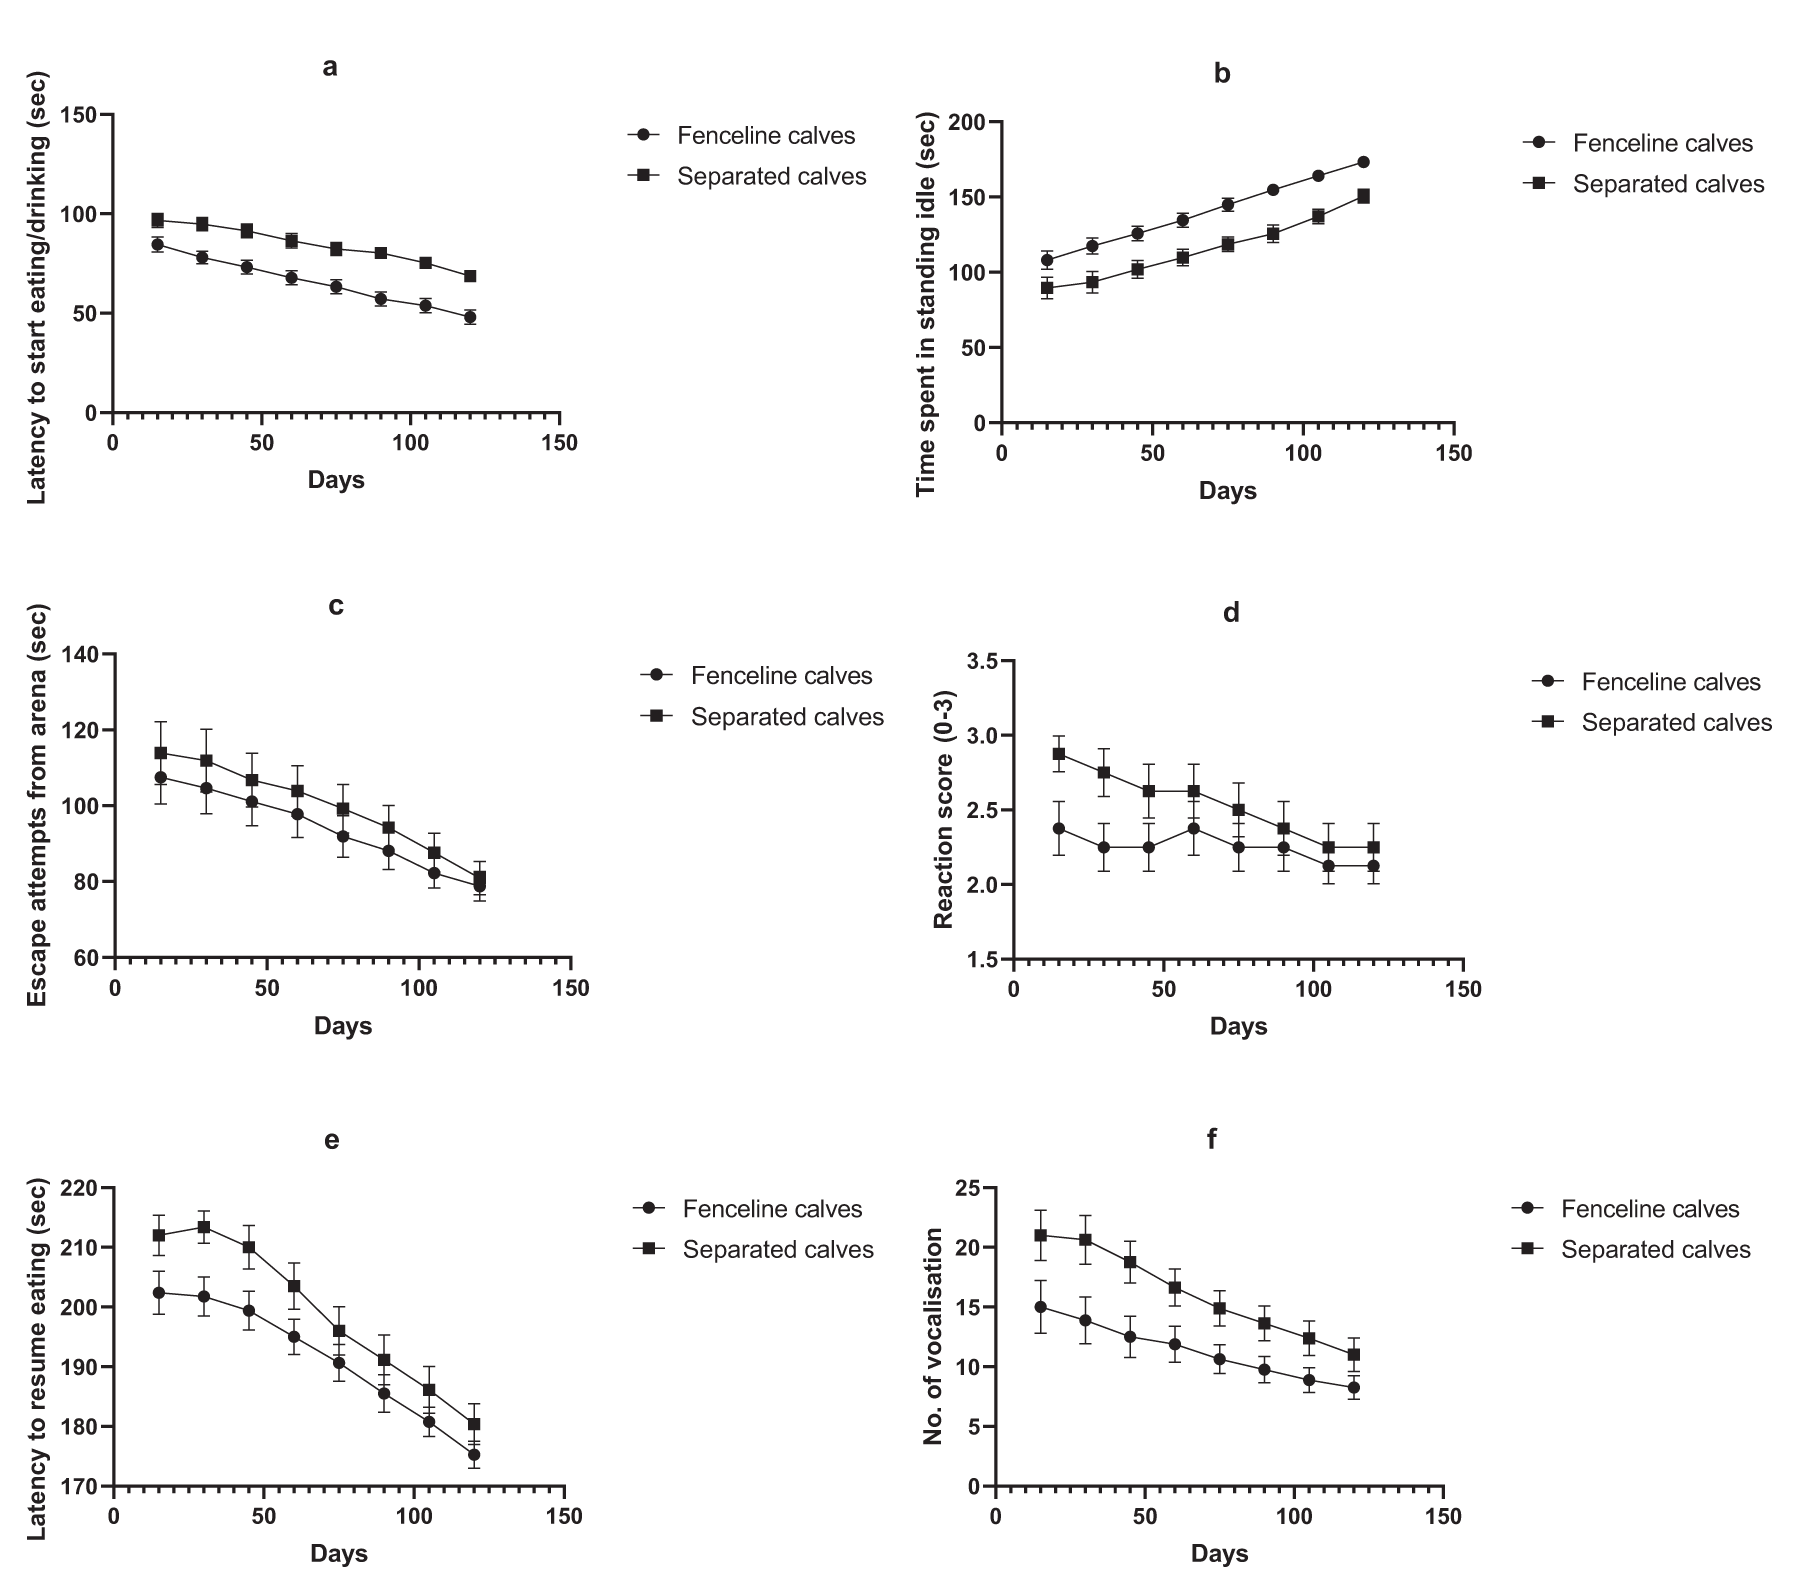
Umbrella test for assessment of fear in calves of two groups
At all timepoints, SM calves exhibited significantly longer latencies to begin eating/drinking and to resume eating following the umbrella presentation (Figs. 3a and 3e), indicating a heightened fear response and slower recovery. Conversely, FMC calves spent more time standing idle after stimulus presentation (Fig. 3b) suggesting greater vigilance. No significant differences were found between the groups in the duration of escape attempts, although both showed a decline in escape behaviour over time (Fig. 3c). Reaction scores were significantly higher in SM calves at day 15, indicating a more intense initial response to the umbrella, but this difference diminished over time as both groups habituated to the stimulus (Fig. 3d). SM calves also vocalized more frequently than FMC calves from days 30 to 75, reflecting elevated distress levels, although this difference disappeared by day 90 (Fig. 3f). Overall, FMC calves exhibited greater adaptability and reduced stress reactivity compared to SM calves.
Behavioural responses of calves as mean ± SE in control and treatment groups during the umbrella test for fear assessment. (a) Latency to start eating/drinking; (b) time spent standing idle after opening the umbrella; (c) time spent making escape attempts from the arena; (d) reaction score; (e) latency to resume eating after opening the umbrella; (f) number of vocalizations after opening the umbrella.

Figure 3 Long description
The image A showing a line graph labeled a. The horizontal axis label is “Days” with a range from 0 to 150. The vertical axis label is “Latency to start eating/drinking (sec)” with a range from 0 to 150. Two series are shown in the legend: “Fenceline calves” and “Separated calves.” The plotted points use circular markers for “Fenceline calves” and square markers for “Separated calves.” Vertical error bars are drawn at each point. Both series decrease across days. “Separated calves” is higher than “Fenceline calves” at each plotted day. The image B showing a line graph labeled b. The horizontal axis label is “Days” with a range from 0 to 150. The vertical axis label is “Time spent in standing idle (sec)” with a range from 0 to 200. Two series are shown in the legend: “Fenceline calves” and “Separated calves.” Circular markers represent “Fenceline calves” and square markers represent “Separated calves.” Vertical error bars are drawn at each point. Both series increase across days. “Fenceline calves” is higher than “Separated calves” at each plotted day. The image C showing a line graph labeled c. The horizontal axis label is “Days” with a range from 0 to 150. The vertical axis label is “Escape attempts from arena (sec)” with a range from 60 to 140. Two series are shown in the legend: “Fenceline calves” and “Separated calves.” Circular markers represent “Fenceline calves” and square markers represent “Separated calves.” Vertical error bars are drawn at each point. Both series decrease across days. “Separated calves” is higher than “Fenceline calves” at each plotted day. The image D showing a line graph labeled d. The horizontal axis label is “Days” with a range from 0 to 150. The vertical axis label is “Reaction score (0-3)” with a range from 1.5 to 3.5. Two series are shown in the legend: “Fenceline calves” and “Separated calves.” Circular markers represent “Fenceline calves” and square markers represent “Separated calves.” Vertical error bars are drawn at each point. Both series decrease across days. “Separated calves” is higher than “Fenceline calves” at each plotted day. The image E showing a line graph labeled e. The horizontal axis label is “Days” with a range from 0 to 150. The vertical axis label is “Latency to resume eating (sec)” with a range from 170 to 220. Two series are shown in the legend: “Fenceline calves” and “Separated calves.” Circular markers represent “Fenceline calves” and square markers represent “Separated calves.” Vertical error bars are drawn at each point. Both series decrease across days. “Separated calves” is higher than “Fenceline calves” at each plotted day. The image F showing a line graph labeled f. The horizontal axis label is “Days” with a range from 0 to 150. The vertical axis label is “No. of vocalisation” with a range from 0 to 25. Two series are shown in the legend: “Fenceline calves” and “Separated calves.” Circular markers represent “Fenceline calves” and square markers represent “Separated calves.” Vertical error bars are drawn at each point. Both series decrease across days. “Separated calves” is higher than “Fenceline calves” at each plotted day.
Assessment of reactivity of calf to familiar human during weekly body weight
FMC calves consistently showed a significantly shorter latency to approach the handler (Fig. 4a), ranging from 35.00 ± 0.41 sec in week 1 to 23.12 ± 0.90 sec in week 12, compared to SM calves (40.88 ± 0.58 sec to 29.88 ± 0.98 sec). Retreat behaviour was also more prevalent in SM calves (Fig. 4b), with higher retreat proportions (1.00 ± 0.00 to 0.25 ± 0.05) and a greater number of retreats (1.88 ± 0.08 to 2.75 ± 0.05) than in FMC calves (0.75 ± 0.05 to 0.13 ± 0.04; 1.62 ± 0.06 to 2.25 ± 0.08, Fig. 4c). FMC calves were more cooperative during weighing, as indicated by lower coaxing difficulty scores (1.50 ± 0.06 to 2.00 ± 0.09) (Fig. 4d), and fewer gentle pushes (1.62 ± 0.26 to 1.88 ± 0.21) (Fig. 4e), in contrast to SM calves who displayed higher difficulty scores (2.12 ± 0.08 to 2.75 ± 0.05) and required more pushes (2.00 ± 0.48 to 3.25 ± 0.28). Urination during handling was more frequent in SM calves (0.62 ± 0.06) compared to FMC calves (0.38 ± 0.06) in the first week (Fig. 4f). Additionally, FMC calves consistently took less time to be coaxed onto the scale (20.12 ± 0.90 to 27.00 ± 0.79 sec), whereas SM calves required significantly more time (25.62 ± 0.44 to 33.62 ± 0.50 sec) (Fig. 4g).
Behavioural reactivity of calves as mean ± SE in two groups to a familiar human during weekly body weight measurements. (a) Latency to approach the handler; (b) retreat from the handler; (c) number of retreats from the handler; (d) score of difficulty to get on the scale; (e) number of gentle pushes by the handler; (f) urination during the test; (g) time taken to get a calf on the scale.

Figure 4 Long description
The image A showing a line graph labeled a. Legend: Fenceline calves shown with circle markers; Separated calves shown with square markers. X-axis label: Age (weeks). X-axis range: 0 to 15. Y-axis label: Latency to approach handler (sec). Y-axis range: 0 to 50. Both lines decrease across weeks. Separated calves are higher than fenceline calves at each plotted week. The fenceline calves line starts near 35 sec and ends near 23 sec. The separated calves line starts near 41 sec and ends near 30 sec. The image B showing a line graph labeled b. Legend: Fenceline calves shown with circle markers; Separated calves shown with square markers. X-axis label: Age (weeks). X-axis range: 0 to 15. Y-axis label: Retreat from handler (1/0). Y-axis range: 0 to 1.5. Both lines decrease across weeks. Separated calves are higher than fenceline calves at each plotted week. The fenceline calves line starts near 0.75 and ends near 0.13. The separated calves line starts near 1.00 and ends near 0.25. The image C showing a line graph labeled c. Legend: Fenceline calves shown with circle markers; Separated calves shown with square markers. X-axis label: Age (weeks). X-axis range: 0 to 15. Y-axis label: No. of retreats from handler. Y-axis range: 0 to 10. Both lines decrease across weeks. Separated calves are higher than fenceline calves at each plotted week. The fenceline calves line starts near 6.5 and ends near 2.25. The separated calves line starts near 7.5 and ends near 2.75. The image D showing a line graph labeled d. Legend: Fenceline calves shown with circle markers; Separated calves shown with square markers. X-axis label: Age (weeks). X-axis range: 0 to 15. Y-axis label: Score of difficulty to get on scale (1-4). Y-axis range: 0 to 3. The fenceline calves line stays lower than the separated calves line across weeks. The fenceline calves line starts near 1.50 and ends near 2.00. The separated calves line starts near 2.12 and ends near 2.75. The image E showing a line graph labeled e. Legend: Fenceline calves shown with circle markers; Separated calves shown with square markers. X-axis label: Age (weeks). X-axis range: 0 to 15. Y-axis label: No. of gentle pushes by handler. Y-axis range: 0 to 5. The fenceline calves line stays lower than the separated calves line across weeks. The fenceline calves line ranges from about 1.62 to about 1.88. The separated calves line ranges from about 2.00 to about 3.25. The image F showing a line graph labeled f. Legend: Fenceline calves shown with circle markers; Separated calves shown with square markers. X-axis label: Age (weeks). X-axis range: 0 to 15. Y-axis label: Urination during test (1/0). Y-axis range: 0 to 0.8. Both lines decrease from early weeks toward values near 0. The separated calves line starts near 0.62 and the fenceline calves line starts near 0.38. The image G showing a line graph labeled g. Legend: Fenceline calves shown with circle markers; Separated calves shown with square markers. X-axis label: Age (weeks). X-axis range: 0 to 15. Y-axis label: Time taken to get on scale (sec). Y-axis range: 15 to 35. Both lines decrease across weeks. Separated calves are higher than fenceline calves at each plotted week. The fenceline calves line starts near 20.12 sec and ends near 27.00 sec. The separated calves line starts near 25.62 sec and ends near 33.62 sec.
Discussion
Reduced exploration and increased escape behaviours in separated calves suggest elevated fear in novel social contexts, consistent with the established relationship between novelty, exploration and fear inhibition (Jensen et al., Reference Jensen, Vestergaard, Krohn and Munksgaard1997). Social contact has been shown to decrease the latency to approach unfamiliar conspecifics (De Paula Vieira, Reference De Paula Vieira2012), and both familiarity and kinship are known to influence calf social preferences and group dynamics (Færevik et al., Reference Færevik, Jensen and Bøe2006). In this study, separated calves, having limited pre-test social exposure, showed lower sociability, reinforcing the importance of early-life proximity for normal social development. The fact that fenceline calves increased time spent sniffing and remaining close to unfamiliar calves may reflect greater social curiosity, likely facilitated by maternal presence. Such behaviours are linked to social bonding and positive emotional states and may contribute to improved welfare outcomes (Lawrence et al., Reference Lawrence, Vigors and Sandøe2019; Rault et al., Reference Rault, Hintze, Camerlink and Yee2020). Maternal care can enhance a calf's confidence in exploring and processing social and environmental stimuli, possibly supporting olfactory-based social learning. The maternal presence also appears to act as a source of emotional security. Fenceline calves exhibited stronger affiliative behaviours, aligning with findings that familiar companions buffer stress (Rault, Reference Rault2012). Isolation-reared calves, by contrast, showed reduced play and exploratory behaviour (Jensen et al., Reference Jensen, Vestergaard, Krohn and Munksgaard1997, Reference Jensen, Vestergaard, Krohn and Munksgaard1997), and greater behavioural reactivity to novelty (De Paula Vieira, Reference De Paula Vieira2012). These results align with evidence suggesting that early social housing reduces agonistic interactions and promotes positive behaviours like allogrooming and play (Lyu et al., Reference Lyu, Wang, Zhao, Miao, Wang, Xu, Bai and Bao2023). Play behaviour is a well-established indicator of positive welfare (Jensen et al., Reference Jensen, Vestergaard, Krohn and Munksgaard1997), and its increased expression in fenceline calves suggests better emotional states. Furthermore, the presence of a maternal figure may support the development of social competence and facilitate adaptation in complex social situations (Sirovnik et al., Reference Sirovnik, Barth, De Oliveira, Ferneborg, Haskell, Hillmann, Jensen, Mejdell, Napolitano, Vaarst, Verwer, Waiblinger, Zipp and Johnsen2020). Calves reared without maternal contact exhibited more escape attempts and appeared more stressed in novel settings, consistent with findings that cow-contact rearing promotes confidence and reduces fear (Wagner et al., Reference Wagner, Seitner, Barth, Palme, Futschik and Waiblinger2015). Similarly, studies have shown that partner-housed calves explore more and vocalize less under separation stress than individually housed calves (Duve and Jensen, Reference Duve and Jensen2011).
According to Rault et al. (Reference Rault, Hintze, Camerlink and Yee2020), fear is a typical response to unfamiliar stimuli and habituation can mitigate this. From week 5 onwards, fenceline calves displayed more positive human-directed behaviours, possibly due to improved emotional resilience fostered by early social contact. In contrast, separated calves showed signs of increased fear and agitation, supporting prior findings that weaning stress can induce negative affective states and reduce exploratory behaviour (Daros et al., Reference Daros, Costa, Von Keyserlingk, Hötzel and Weary2014). Learning in calves, facilitated through direct experience and social observation, is a dynamic process (Nowak and Boivin, Reference Nowak and Boivin2015). Behavioural synchrony, a mechanism for relationship building in humans and animals (Chartrand and Bargh, Reference Chartrand and Bargh1999), may also support calf-human bonding, particularly in socially housed calves. Behavioural synchrony refers to the coordinated expression of similar behaviours by individuals within a group at the same time, such as feeding, resting or moving together, often reflecting social bonding, communication and group cohesion (Gordon et al., Reference Gordon, Gilboa, Cohen, Milstein, Haimovich, Pinhasi and Siegman2020). Peer presence can shape responses to humans (Grignard et al., Reference Grignard, Boissy, Boivin, Garel and Le Neindre2000), and rearing systems, handler familiarity and early habituation have lasting effects on how cattle interact with people (Uetake et al., Reference Uetake, Morita, Hoshiba and Tanaka2002). Fenceline calves were more willing to approach and remain near unfamiliar humans, indicating lower fear levels and potentially more positive human–animal relationships (HARs) (Waiblinger et al., Reference Waiblinger, Boivin, Pedersen, Tosi, Janczak, Visser and Jones2006). Latency to approach, a measure of curiosity and confidence, was shorter in fenceline calves. While lack of approach does not necessarily reflect a negative relationship (Caeiro et al., Reference Caeiro, Burrows and Waller2017), it may indicate low motivation in separated calves. Separated calves showed increased signs of distress in the presence of unfamiliar humans, consistent with literature identifying human exposure as a significant stressor for farm animals (Jones, Reference Jones1996). Their passive or escape-related coping behaviours reflect emotional challenges linked to separation, personality traits and reduced maternal guidance (Visser et al., Reference Visser, Van Reenen, Hopster, Schilder, Knaap, Barneveld and Blokhuis2001). Early-life social housing has been shown to enhance calves’ sociability, both with conspecifics and humans (Doyle et al., Reference Doyle, Lindner, Gingerich and Miller-Cushon2022). Socially motivated calves benefit from group housing, fulfilling their need for contact and improving adaptability over time (Bertelsen and Jensen, Reference Bertelsen and Jensen2019). Though some research suggests individually housed animals may develop stronger bonds with humans due to their isolation (Ward and Melfi, Reference Ward and Melfi2015), our findings indicate that social housing fosters healthier, more confident interactions. Behavioural expressions such as headshaking and butting, particularly among fenceline calves, suggest heightened playfulness and assertiveness, linked to better emotional states and confidence (Bertelsen and Jensen, Reference Bertelsen and Jensen2019). In contrast, separated calves, having transitioned to independence, displayed lower frequencies of such behaviour, reflecting reduced motivation and possibly increased stress. Weaning, especially when abrupt, can lead to behavioural and physiological stress responses (Enríquez et al., Reference Enríquez, Ungerfeld, Quintans, Guidoni and Hötzel2010), often resulting in decreased performance and well-being (Weary et al., Reference Weary, Jasper and Hötzel2008). These effects are attributed to disruption of the maternal bond (Newberry RC and Swanson JC, 2008). Distress-related behaviours such as increased escape attempts in separated calves further highlight the impact of early maternal separation (Hötzel et al., Reference Hötzel, Ungerfeld, Quintans, Hötzel, Ungerfeld and Quintans2010). Such calves may interpret ambiguous stimuli more negatively due to poorer emotional states (Mathews and MacLeod, Reference Mathews and MacLeod2005).
Ninomiya (Reference Ninomiya2019) demonstrated that socially raised calves can learn and habituate to novel objects, a capacity reflected in the fenceline calves’ greater willingness to explore and consume food and water. In contrast, behavioural restrictions in artificial or isolated environments are associated with frustration and compromised welfare (Mason and Burn, Reference Mason and Burn2018).
Anxiety may hinder habituation, reducing the ability of calves to assess novel stimuli as safe (Gaillard et al., Reference Gaillard, Meagher, Von Keyserlingk and Weary2014), and emotional states significantly shape perception and welfare outcomes (Mendl et al., Reference Mendl, Burman, Parker and Paul2009). The expression of natural behaviours allows animals to cope more effectively with stressors (Rushen, Reference Rushen2000). Fearfulness, a personality trait (Uher, Reference Uher2011), has been shown to negatively impact welfare and adaptability (von Keyserlingk et al., Reference von Keyserlingk, Rushen, de Passillé and Weary2009). The mother represents a primary social bond, critical to emotional development and stress resilience (Newberry RC and Swanson JC, 2008). Complete maternal deprivation is associated with heightened behavioural and physiological stress responses (Latham and Mason, Reference Latham and Mason2008). Duve et al. (Reference Duve, Weary, Halekoh and Jensen2012) observed reduced stress responses in calves maintained in maternal contact compared to those reared singly or in pairs. Group housing has been shown to reduce fear responses and improve social rank, play behaviour and competitiveness (Jensen et al., Reference Jensen, Vestergaard, Krohn and Munksgaard1997). This underscores the long-term benefits of early socialization on behavioural development and calf performance. Personality traits also influence behavioural and growth outcomes. Calves separated early tend to show increased fearfulness, while those more active and exploratory achieve higher post-weaning weights (Neave et al., Reference Neave, Costa, Benetton, Weary and von Keyserlingk2019). Social isolation soon after birth increases reactivity to novelty, reduces concentrate intake and delays feeding initiation (Costa et al., Reference Costa, Meagher, von Keyserlingk and Weary2015). Exploratory behaviour is positively associated with feed intake and growth (Neave et al., Reference Neave, Costa, Benetton, Weary and von Keyserlingk2019), and socially housed calves generally begin feeding earlier and consume more than isolated peers, likely due to social facilitation (Costa et al., Reference Costa, Meagher, von Keyserlingk and Weary2015). The neuroendocrine system, which is sensitive to stress, may inhibit appetite when stressors are perceived (Matteri et al., Reference Matteri, Carroll and Dyer2000), and reduced feeding behaviour is a recognized sign of distress during weaning (Price et al., Reference Price, Harris, Borgwardt, Sween and Connor2003). Vocalizations serve as distress indicators post-weaning, reflecting calves’ attempts to re-establish maternal contact (Weary et al., Reference Weary, Jasper and Hötzel2008). Their intensity depends on the calves’ emotional state and needs (Stěhulová et al., Reference Stěhulová, Valníčková, Šárová and Špinka2017). Research shows that calves vocalize more following separation, especially when they can still hear or see their dams (Schnaider et al., Reference Schnaider, Heidemann, Silva, Taconeli and Molento2022). Vocal response also varies by age at separation, with younger calves exhibiting more intense calling behaviour (Lambertz et al., Reference Lambertz, Farke‐Röver and Gauly2015).
The quality of HARs is shaped by early interactions and the context in which they occur (Hemsworth and Coleman, Reference Hemsworth and Coleman2010). Fear is a predominant response in such interactions, often leading to escape or avoidance behaviours that can contribute to stress and health issues (Waiblinger et al., Reference Waiblinger, Boivin, Pedersen, Tosi, Janczak, Visser and Jones2006). In this study, separated calves exhibited a greater tendency to retreat from humans, indicating increased fear and reduced familiarity with handlers compared to fenceline calves. These findings align with previous research showing that early separation can negatively impact calves’ comfort with human presence (Calderón-Amor et al., Reference Calderón-Amor, Beaver, Von Keyserlingk and Gallo2020). Despite group differences, both fenceline and separated calves showed a decline in avoidance behaviour over time, suggesting some acclimation to human presence. Positive early-life interactions, such as petting and gentle handling, are associated with reduced fear and improved performance outcomes (Lürzel et al., Reference Lürzel, Münsch, Windschnurer, Futschik, Palme and Waiblinger2015), further emphasizing the benefits of early contact in shaping calf behaviour. Management practices and environmental conditions also influence behavioural responses. Factors such as large herd sizes, limited space and lack of enrichment contribute to heightened fearfulness in calves (Leruste et al., Reference Leruste, Bokkers, Heutinck, Wolthuis-Fillerup, Van Der Werf, Brscic, Cozzi, Engel, Van Reenen and Lensink2012). Individual traits, including temperament and health status, further shape HAR dynamics (Cramer and Stanton, Reference Cramer and Stanton2015). In this study, the more cooperative behaviour of fenceline calves during weighing procedures suggests that the weaning method may influence calves’ adaptability to novel or mildly stressful situations.
Social housing plays a critical role in behavioural development through social learning. Calves learn from their dams and peers, forming feeding and behavioural preferences that mirror those of social models (Cantor et al., Reference Cantor, Neave and Costa2019). When social contact is restricted, calves lose valuable learning opportunities, which can impair their ability to navigate social and environmental challenges (Costa et al., Reference Costa, Meagher, von Keyserlingk and Weary2015). The improved handling response observed in fenceline calves may therefore stem from greater exposure to social models and environmental familiarity. Urination, observed more frequently in separated calves during testing, is a behavioural indicator of stress (Lauber et al., Reference Lauber, Hemsworth and Barnett2006). Although cattle have limited control over urination, higher incidences in stressful situations suggest an elevated physiological response in more fearful individuals (Whistance et al., Reference Whistance, Sinclair, Arney and Phillips2011). This aligns with research showing individual differences in stress coping styles among calves (Van Reenen et al., Reference Van Reenen, O'Connell, Van der Werf, Korte, Hopster, Jones and Blokhuis2005). The reluctance of separated calves to approach or cooperate with handlers supports findings that negative HAR or lack of early interaction results in increased fear (Hemsworth et al., Reference Hemsworth, Coleman, Barnett and Borg2000). Pajor et al. (Reference Pajor, Rushen and De Passillé2000) reported that fearful animals took longer to move through test environments, which may explain the longer time required to place separated calves on the scale in this study. In contrast, fenceline calves consistently required less handling effort, indicating lower fear and better handling ease.
In conclusion, this study demonstrates that rearing method significantly affects calves’ behaviour, social reactivity and fear responses. Fenceline reared calves (FMC) showed greater social engagement, lower stress and better adaptability than separated calves. They interacted more confidently with unfamiliar calves and humans and recovered faster from fear stimuli. Preference tests and weekly handling also revealed more cooperative and less fearful behaviour in FMC calves. SM calves exhibited more withdrawal, agitation and stress related behaviours throughout the study. Overall, fenceline rearing promotes healthier social behaviour, emotional stability and improved human–animal interaction in calves, making it a welfare-enhancing alternative to complete separation.
Acknowledgements
The authors thank the Director ICAR-NDRI for providing necessary funds and resources for the smooth conduct of trial.
Competing interests
The authors declare that they have no conflict of interest.