
I. INTRODUCTION
Additive manufacturing (AM), or 3D printing, provides unprecedented spatial control over feature geometry and material composition. Reference Truby and Lewis1,Reference King, Anderson, Ferencz, Hodge, Kamath, Khairallah and Rubenchik2 In direct ink writing (DIW), a filament-based 3D printing process, a shear-thinning fluid is extruded from a nozzle onto a substrate using a multiaxis printing system, producing a 3D structure in a layer-by-layer fashion. Reference Lewis3 With custom silicone elastomeric ink formulations, we have developed a printing capability to fabricate cushions for stress mitigation, vibration isolation, and impact absorption. Reference Duoss, Weisgraber, Hearon, Zhu, Small, Metz, Vericella, Barth, Kuntz, Maxwell, Spadaccini and Wilson4 Direct ink writing can reliably manufacture ordered architectures with highly uniform and reproducible geometric, material, and mechanical properties which are far superior to traditional stochastic foams, from both a design and lifetime performance standpoint. Reference Maiti, Small, Lewicki, Weisgraber, Duoss, Chinn, Pearson, Spadaccini, Maxwell and Wilson5 These ordered cellular solids are a subset of mechanical metamaterials, typically structures consisting of arrays of unit cells with unique properties, including large strength to weight ratios Reference Zheng, Lee, Weisgraber, Shusteff, DeOtte, Duoss, Kuntz, Biener, Ge, Jackson, Kucheyev, Fang and Spadaccini6,Reference Meza, Zelhofer, Clarke, Mateos, Kochmann and Greer7 and negative thermal expansion. Reference Wang, Jackson, Ge, Hopkins, Spadaccini and Fang8 While many of these lattice networks only consider static feedstock material properties, the introduction of soft materials with functional, dynamic properties enable even more complex behaviors. Lattices and foams comprised of two elastomers can exhibit negative swelling, Reference Liu, Gu, Shan, Kang, Weaver and Bertoldi9 and shape memory polymer architectures provide programmable actuation and recovery. Reference Gladman, Matsumoto, Nuzzo, Mahadevan and Lewis10,Reference Wu, Small, Bryson, Cheng, Metz, Schulze, Duoss and Wilson11 In addition to structural applications, engineered foams serve as bio-scaffolding, Reference Lode, Meyer, Brüggemeier, Paul, Baltzer, Schropfer, Winkelmann, Sonntag and Gelinsky12 separation membranes, Reference Mrozek, Gold, Leighliter, Sietins and Lenhart13 and soft robots. Reference Mac Murray, An, Robinson, van Meerbeek, O’Brien, Zhao and Shepherd14
Demonstrations of these designer materials with tailorable microstructures have accelerated, coinciding with the maturation of 3D printing technologies, and this ability to control structure and material constituents provides access to an expanding design space. What is lacking, however, is a means to solve the inverse design problem by efficiently interrogating this material-structural-response phase space and produce an architecture that meets a given set of performance requirements. Topology optimization Reference Bendsoe and Sigmund15 is a general approach to the design of lightweight, porous mechanical structures but is typically applied to static, linear elastic problems for which the response and sensitivities are relatively inexpensive to compute. However, elastomeric foams used in cushion applications undergo large nonlinear deformations with numerous contacting surfaces, requiring much costlier simulations at each optimization iteration. The design problem can be simplified by considering specific architectures Reference Valdevit, Godfrey, Schaedler, Jacobsen and Carter16 or parameterizing lattice unit cells as a set of interconnected struts. Reference Messner17,Reference Watts and Tortorelli18 Further reductions in computational cost can be achieved by substituting a reduced order model (ROM) for the mechanical forward model simulation in the optimization. A ROM can be based on, for example, structural mechanical theory Reference Zheng, Jiang, Huang, Shang and Ju19 or projecting parametric simulation solutions onto a lower dimensional space. Reference Weickum, Eldred and Maute20 We consider two specific DIW architectures and derive a two-parameter reduced order model for the stress response under compressive loading. With one parameter describing the architecture and the other the ink material properties, we develop a physical understanding of the relationship of these variables to the stress response which informs the formulation of the reduced order model. We apply the ROM to a specific design problem and demonstrate how a solution is readily achieved with insignificant computational effort.
II. METHODOLOGY
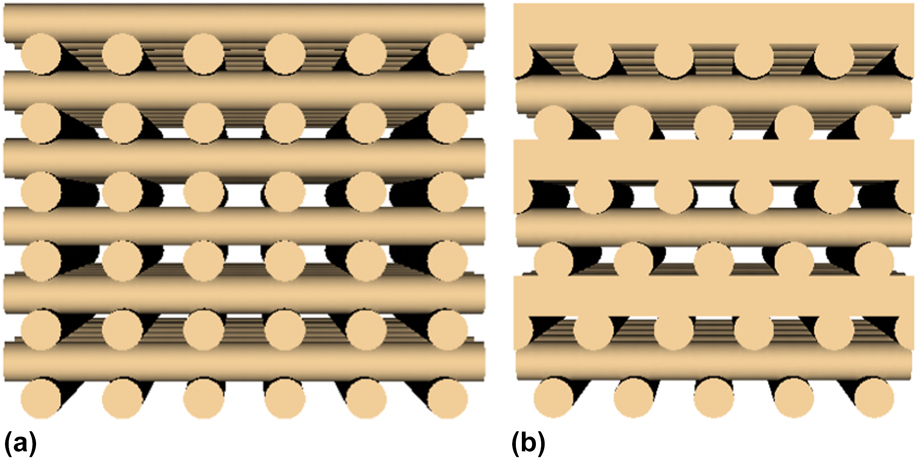
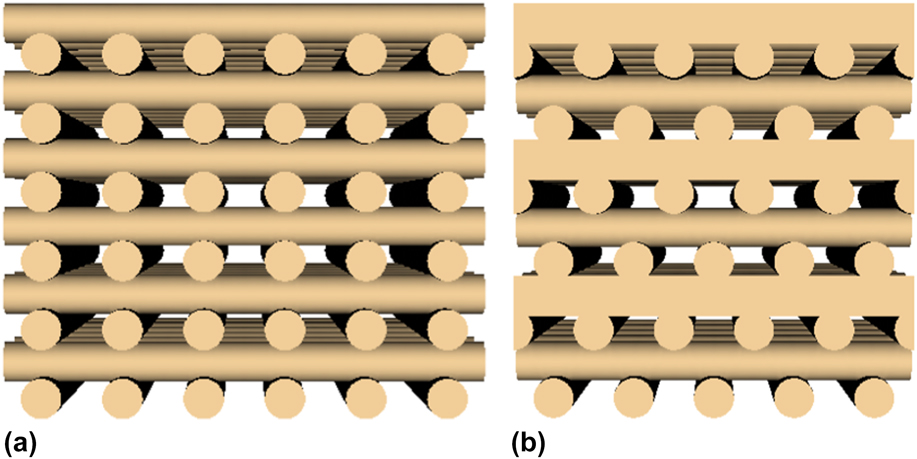
We consider the compressive deformation of two wood pile architectures with uniform alignment and spacing within a single layer, simple cubic (SC) and face-centered tetragonal (FCT), depicted in Fig. 1. In the SC structure, adjacent layers are oriented 90° with respect to each other; the FCT structure has the same change of orientation with the addition of a lateral shift equal to half of the center-to-center spacing. To simplify our approach, we make the following assumptions: (i) there are a sufficient number of layers (≥12) so that there is no thickness, H, dependence on the response to a compressive load, and (ii) the applied loading area on the cushion is much larger than the strand diameter. With these two conditions the stress response as a function of strain (ε = 1 − h/H, where h is the thickness at a prescribed loading), is independent of filament diameter, d. Then, for a cushion with uniform porosity, the only structural parameter is the dimensionless pitch, s/d, where s is the center-to-center spacing within a layer. In addition, we define a second parameter, E bulk, the Young’s modulus of the DIW elastomeric ink. With our current formulations, we can achieve about a factor of ten in modulus variability. In deriving the reduced order model, we analyzed data from both computational compression simulations and experimental characterization.
Renderings of 12-layer (a) simple cubic (SC) and (b) face-centered tetragonal (FCT) architectures with a dimensionless pitch s/d = 2.
A. Simulations
Finite element hexagonal meshes for the simulations were generated using the automated scripting capabilities of Cubit and then translated into an input file for the LLNL implicit quasi-static solver NIKE3D. Reference Puso21 We modeled the bulk elastomer as a Mooney–Rivlin material calibrated to match the compressive response of a commercially available silicone paste (Dow Corning SE-1700). Poisson’s ratio, ν, was set to 0.48. We explored sensitivity of the simulations to ν between 0.47 and 0.495 and found negligible variation in the stress response except at lock-up, where there was a 15% variation in strain at a maximum simulated stress of 700 kPa. To apply boundary conditions, thin plates with high stiffness were added to the upper and lower surfaces of the FCT or SC mesh. The nodes of the lower plate were held fixed whereas those of the upper were allowed to move in the vertical direction. We applied periodic boundary conditions to the lateral cushion surfaces. To obtain the predicted stress response, we incrementally applied a compressive displacement to the top plate for each step and iterated until convergence. With respect to contact interfaces, NIKE3D is fairly robust and the simulations could achieve strains close to full densification. We simulated the compressive stress response for FCT and SC structures with 12 layers over a range of dimensionless pitches, s/d = 1.4–3.2.
B. Ink formulation and mechanical tests
For the mechanical tests, 12-layer FCT and SC structures were manufactured using direct ink writing, capable of achieving ∼10 μm spatial resolution with feature sizes in the 40–500 μm range. Dow Corning SE-1700 (Dow Corning, Midland, Michigan), a polydimethylsiloxane (PDMS) thermoset was dispensed through a 250 μm nozzle at a flow rate consistent with a 15 mm/s linear print speed and onto a silicon substrate mounted on an Aerotech three-dimensional positioning system. After printing, the structures were cured in a vacuum oven for one hour at 150°C. Several designs were produced with the pitch ranging from 475 to 575 μm.
In all the tests, we performed three loading–unloading cycles up to a maximum 2 MPa stress at a strain rate of 1.27 mm/min on an Instron 5967 (Instron, Norwood, Massachusetts). Each printed sample was placed between a 28.68 mm diameter fixed lower platen and a 50 mm diameter spherical seat upper platen. The third loading curve was extracted for comparisons with simulations. For each pitch, we manufactured multiple cushions and tested the response at four locations on each sample. The data presented in the next section represents the average response over all locations and samples. We calculated the as-built porosities of the printed cushions using their measured masses, thicknesses, and lateral dimensions (approximately 75 mm square). The thickness was defined by the crosshead displacement at a stress of 2 kPa during the first loading cycle.
To modify the elastic modulus, a custom DIW ink was formulated. This material was formulated as a two-part (A:B) thermal cure Pt-catalyzed siloxane (10:1) having a combination of a vinyl terminated poly(dimethylsiloxane)-co-(diphenylsiloxane), reinforcing fumed silica, thixotropic additive, reaction inhibitor, vinyl MQ siloxane resin, and poly(dimethylsiloxane)-co-(methylhydrosiloxane) as crosslinker. Curing profiles similar to the SE-1700 protocol were applied after printing resulting in a custom cured elastomer having a hardness of Shore 62A. To validate the reduced order model, we printed a larger cushion (100 mm in diameter) and measured the response on an Instron 5967 with a 203.2 mm diameter fixed lower platen and a 200 mm diameter spherical seat upper platen.
III. RESULTS AND DISCUSSION
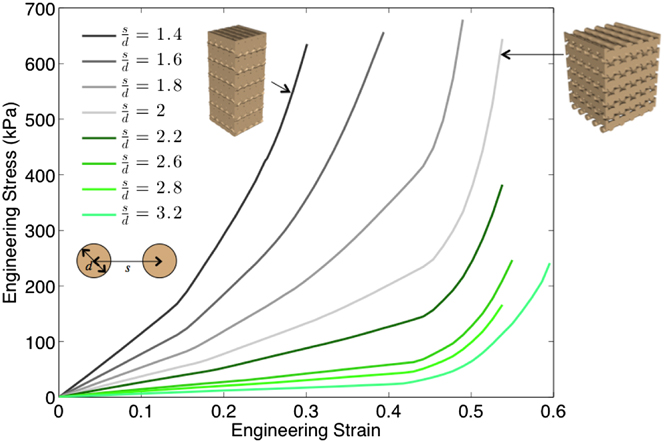
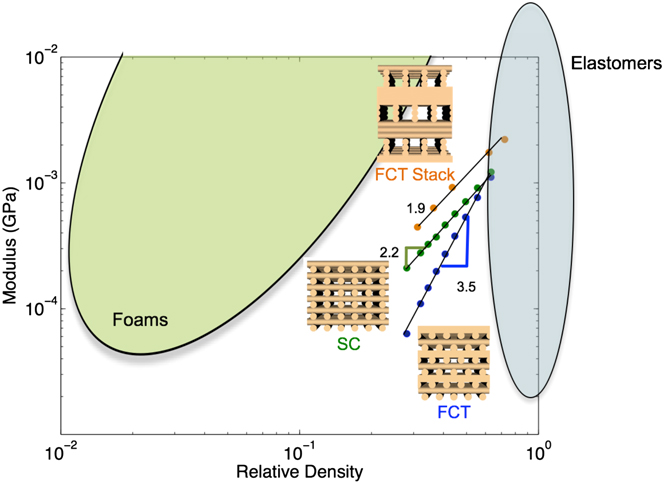
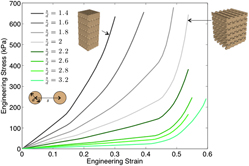
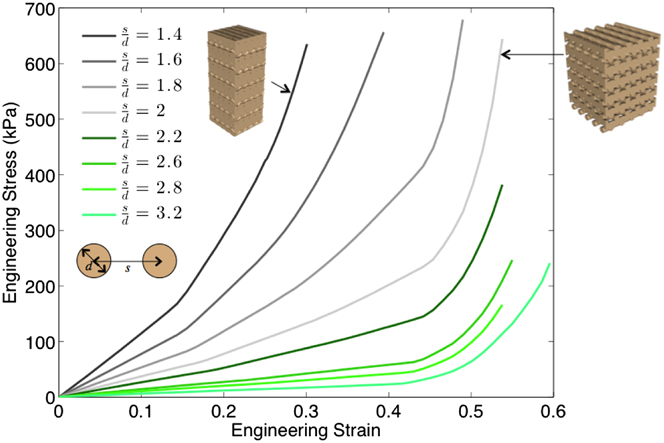
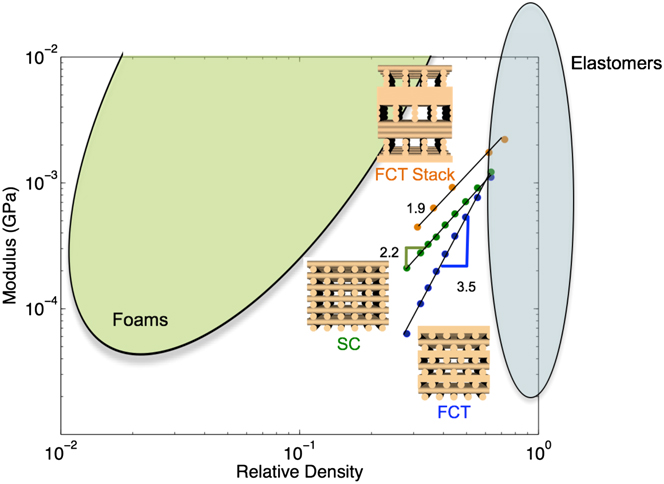
The FCT stress response curves derived from the finite element simulations are plotted in Fig. 2 for a range of dimensionless pitches, s/d. With increasing pitch, the architecture softens and the resulting higher porosity shifts the lockup point to higher strains. Considering the stress at 0.3 strain, a 2.3 increase in pitch reduces the stress by a factor of 37. By examining the stress at very small strains (1–2%) we extracted the architecture moduli from the slopes in this regime and compared their behavior to other open cell structures. Reference Gibson and Ashby22 Figure 3 is an Ashby material plot for the stiffness-density relationship for the FCT and SC architectures. Also depicted are the regions occupied by solid elastomers and bend-dominated open cell foams. The DIW structures are somewhat softer than foams in this density range and their stiffness curves intersect the elastomer region as the density increases toward bulk values (for SE-1700, ρ = 1.13 g/cc). The density scaling for the FCT structures is 3.5 which is similar to the behavior of extremely compressible carbon nanotube foams and aerogels. Reference Worsley, Kucheyev, Satcher, Hamza and Baumann23 With a slope of 2.2, the SC architecture is closer to the stiffness of bend-dominated lattices with a typical scaling of 2. This difference between SC and FCT is likely due to the stress distribution within the filament structure. In simple cubic vertical stress columns aligned with the loading direction are generated, passing through the inter-layer contact areas, whereas the connectivity of the stress within FCT has a more convoluted pathway to resist compression, with a highly bend-dominant arrangement. Reference Duoss, Weisgraber, Hearon, Zhu, Small, Metz, Vericella, Barth, Kuntz, Maxwell, Spadaccini and Wilson4 Stacking the FCT architecture by aligning adjacent layers and rotating 90° only every four layers decreases the thickness-to-height ratio of the pore walls and produces a more traditional bend-dominated structure, depicted at the top of the figure. For a given pitch, the porosity remains the same but the increase in the number of aligned layers produces a stiffer response than simple cubic. The increase in the pore size relative to strand diameter also decreased the slope to 1.9, indicating that a lower power law relationship is achievable with these parallel strand stacked architectures. Though we are interested in the stress response over the entire compressible range of strains, the scaling of modulus with density will have implications in the development of the reduced order model.
Compressive stress responses from finite element simulations of the FCT structure for a range of dimensionless pitches (s/d) indicated by the legend. Representative renderings of two different porosities are included and identify their respective stress response.
Ashby chart of stiffness-density relationship for three direct-ink writing architectures: SC (green), FCT (blue), and stacked FCT (orange).
The results in Fig. 3 suggest an initial approach to scaling the response curves. In the linear stress–strain regime σ = E
aε, where E
a is the elastic modulus of the architecture and is proportional to the nth power of the relative density and the modulus of the bulk elastomer, E
a ∼ E
bulkρ
n
rel. The relative density can be determined by considering the unit cell of an N layer ideal structure with no overlap. The total volume, V
t, of the repeating unit is V
t = Nds
2, whereas the volume of the structure within the unit cell is
 ${V_{\rm{a}}} = {\pi \over 4}N{d^2}s$
. Therefore, the relative density is given by,
 $${\rho _{{\rm{rel}}}} = {{{V_{\rm{a}}}} \over {{V_{\rm{t}}}}} = {{\pi d} \over {4s}}\quad ,$$
and at least in the linear regime the stress scales as,
 $$\sigma \; \sim \;{\left( {{d \over s}} \right)^n}\quad .$$
This analysis predicts the stress can be normalized by
 ${\left( {{d \over s}} \right)^n}$
, where n is architecture dependent as indicated by Fig. 3.
That leaves the normalization of the strain axis. The strain at which lock-up occurs is correlated with the porosity, defined as,
 $${\rm{porosity}}\; \equiv \;\phi = 1 - {\rho _{{\rm{rel}}}} = 1 - {{\pi d} \over {4s}}\quad ,$$
which is a reasonable candidate for a normalization parameter. Again, considering an ideal structure, the total volume of a unit cell in a state of strain ε is
 $${V_{\rm{t}}}\left( \varepsilon \right) = h{s^2}\quad ,$$
where h is the thickness of the pad at the current strain. For an incompressible material, V a remains constant and we can derive the thickness at lockup by equating Eq. (4) and V a,
 $${h_{{\rm{lock}}}} = {{\pi N{d^2}} \over {4s}}\quad .$$
Since εlock = 1 − h/Nd, the strain at lockup is
 $${\varepsilon _{{\rm{lock}}}} = 1 - {{\pi d} \over {4s}}\quad ,$$
which is exactly equal to the porosity.
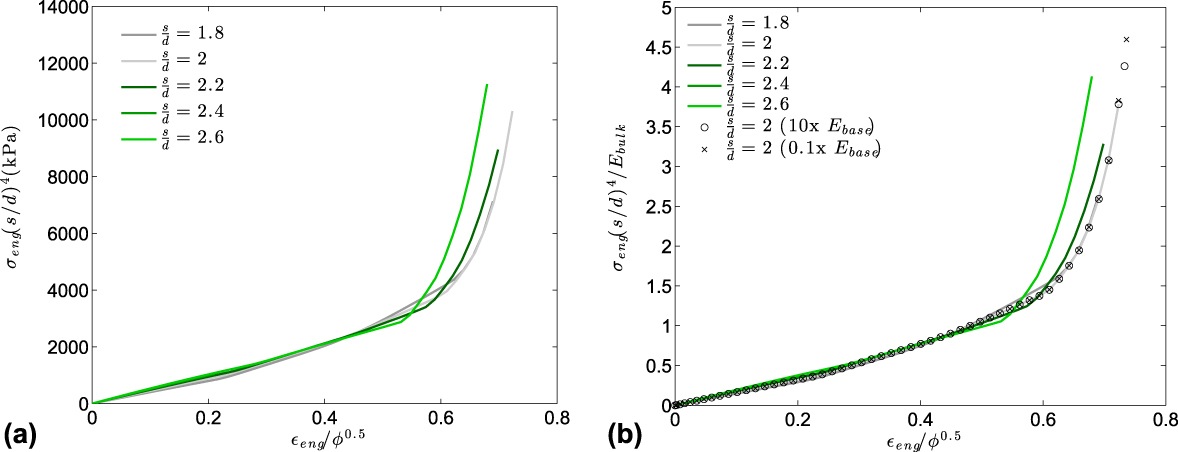
However, when normalizing the strain by porosity, the simulation stress curves did not coincide at lockup, which was likely caused by the finite amount of layer overlap and errors in the computations with a significant amount of contact. Using the least squares optimization method, we determined the power of porosity, p, that minimized the areas between the response curves when normalizing stress by (d/s) n and strain by φ p . We selected n = 4 to correspond to the slope of the FCT stiffness in Fig. 3. Upon closer examination of the data, the modulus scaled as ρ3 for low porosities and as ρ4 for moderate and high porosities. Since many of our applications require at least moderate porosity, (>30%) we scaled the stress with n = 4 in Fig. 4(a), which shows the curves in the intermediate range of s/d values plotted on the normalized axes with the optimal scaling, p = 0.5. Instead of determining porosity from Eq. (3), we computed it directly from the volume fraction of the mesh of each FCT structure which accounts for the overlapping filaments. Comparing these results with Fig. 2, there is very good collapse of the stress response curves, especially at the lower strains before lockup.
Normalized compressive responses of the FCT structure from finite element simulations: (a) strain and stress normalized by ϕ0.5 and (d/s)4, respectively, (b) additional stress scaling by the elastic modulus of the cured resin, E bulk.
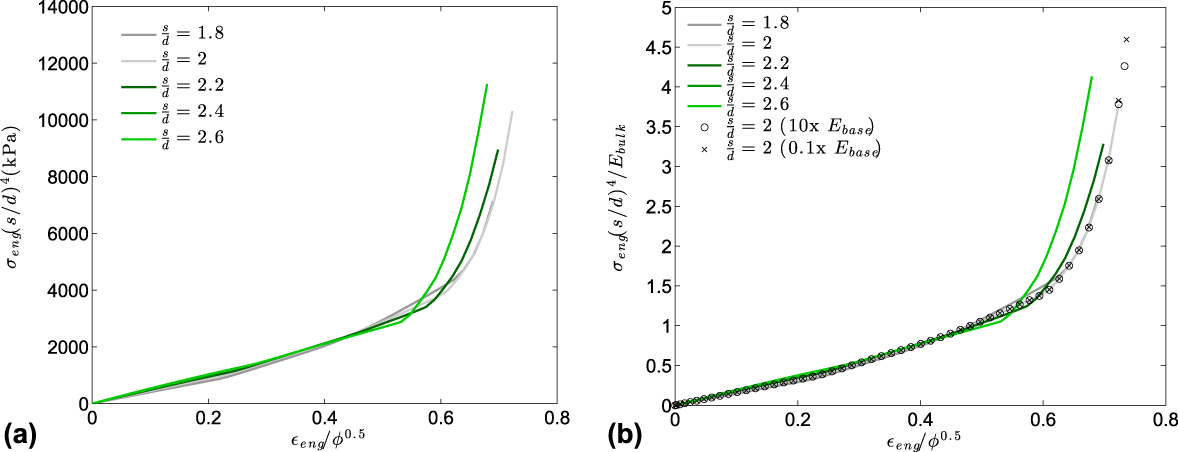
We can add a second design parameter and consider the stiffness of the DIW feedstock. Since the architecture modulus is directly proportional to the bulk ink modulus, E bulk, we can rescale the stress by dividing by E bulk as shown in Fig. 4(b). The data from Fig. 4(a) are replotted along with the stress responses from two additional simulations of structures with a dimensionless pitch s/d = 2, but with different moduli, one a factor of ten higher, and the other a factor of ten lower than the original modulus, E base. Here, the modulus is expressed as the linear elastic equivalent derived from the Mooney–Rivlin constants C 1 and C 2, E base = 4(C 1 + C 2)(1 + ν). With this scaling, the response curves with different moduli coincide extremely well.
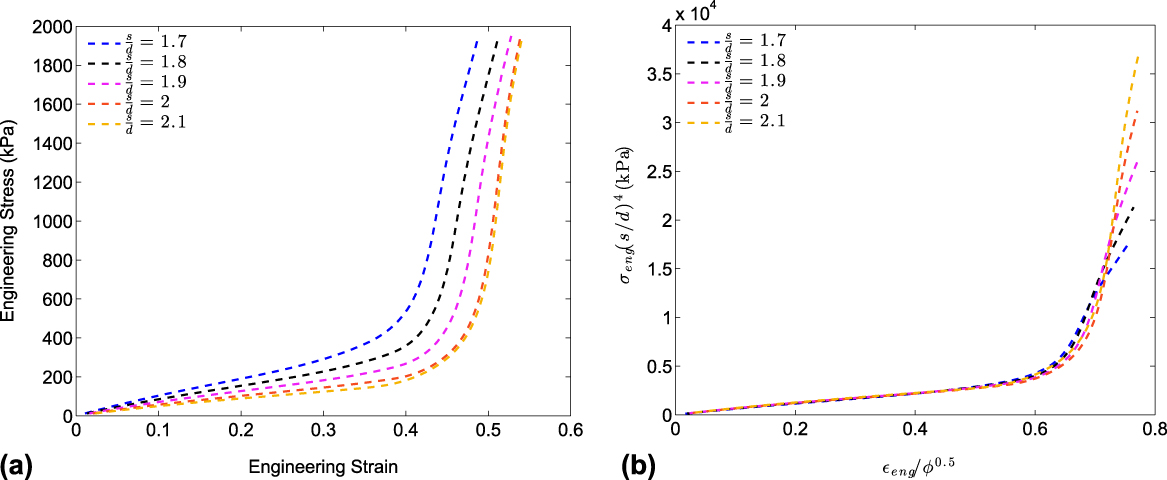
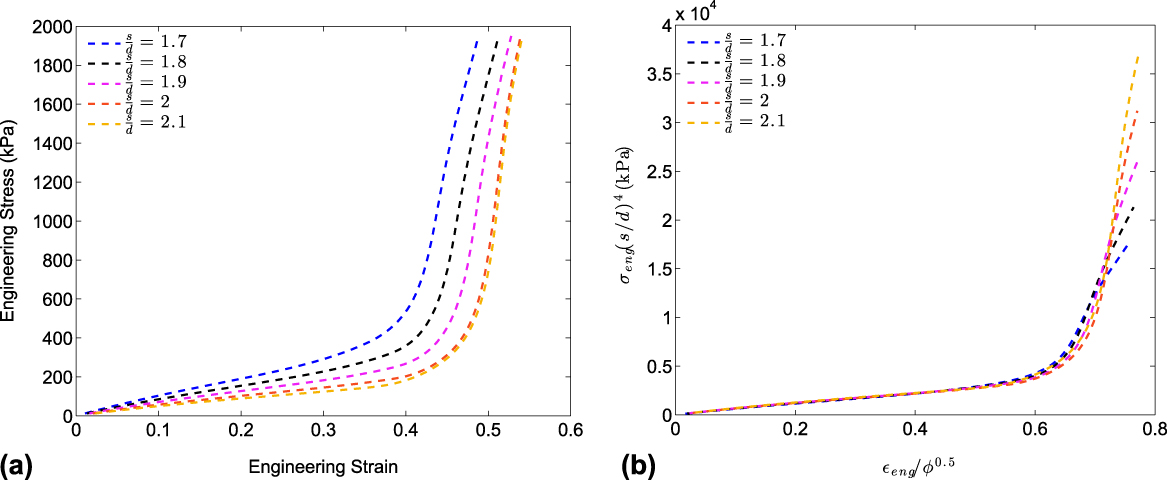
We performed a similar analysis of the experimental mechanical testing of FCT under compression with dimensionless pitches between 1.7 and 2.1. Figure 5(a) shows the stress responses of five structures averaged over three cushions and four interrogation regions within each cushion. The cushions with s/d = 2 and 2.1 have a very similar response since the measured porosities were identical due to an oversized strand diameter. In Fig. 5(b), the curves are replotted on the scaled axes identical to those in Fig. 4(a). To confirm the best scaling for this data, we optimized the values of both the exponents to minimize the area between the curves and obtained values of n = 3.7 and p = 0.56 which are very similar to the powers derived from the Ashby chart and the optimal porosity scaling for the computational data. Because of variability during the ink writing process the values for s/d and porosity were determined from size and mass measurements of the printed cushions. The collapse of the experimental data is excellent and is an improvement over the finite element results.
Compressive stress responses from mechanical tests of the FCT structure for a range of dimensionless pitches (s/d) indicated in the legend: (a) unscaled data, (b) normalized data using the scaling from Fig. 4(a).
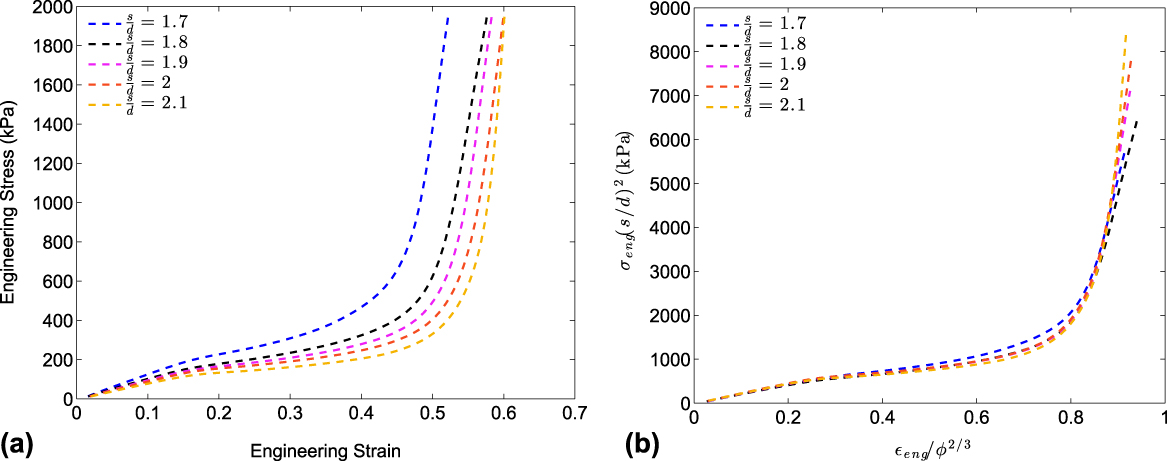
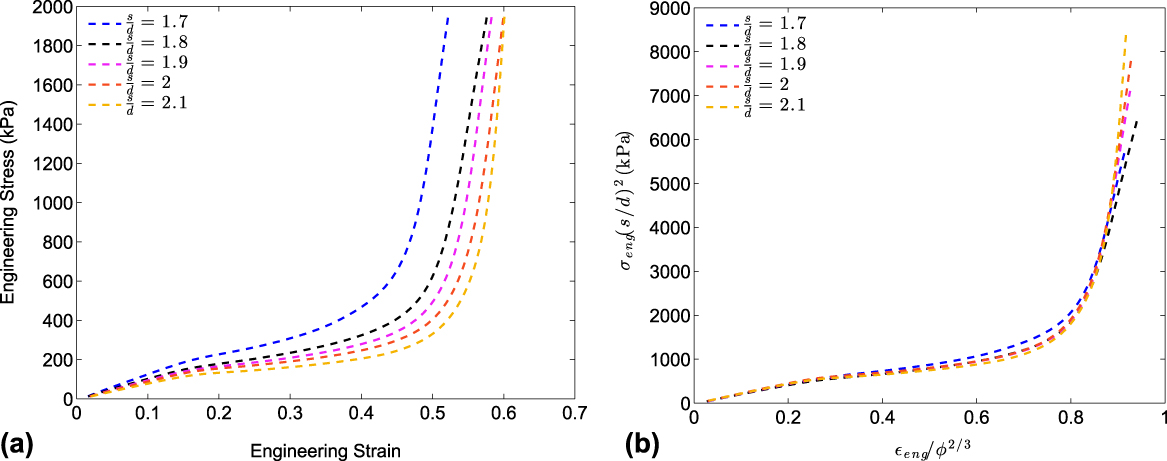
Likewise, the mechanical response for the simple cubic structure can be scaled using the same approach. Guided by Fig. 3, n should be close to 2.2, which is confirmed by least squares optimization, producing values of n = 2.4 and P = 0.63. Reflecting our preference for whole number fractions, Fig. 6 shows plots of the unscaled and scaled stress curves, using n = 2 and P = 2/3 for the same range of s/d in Fig. 5, and graphically demonstrates the scaling for SC is as effective as the FCT normalization. The SC simulation data is not shown since the NIKE3D implicit quasi-static solver cannot capture the dynamic buckling exhibited by this architecture at moderate compressions and produces a stiffer response than the mechanical characterization. For the remainder of this analysis, we focus on the behavior of the FCT architecture and derive a general model to serve as the basis for a rapid design capability.
Compressive stress responses from mechanical tests of the SC structure for a range of dimensionless pitches (s/d) indicated in the legend: (a) unscaled data, (b) normalized data by ϕ2/3 and (d/s)2.
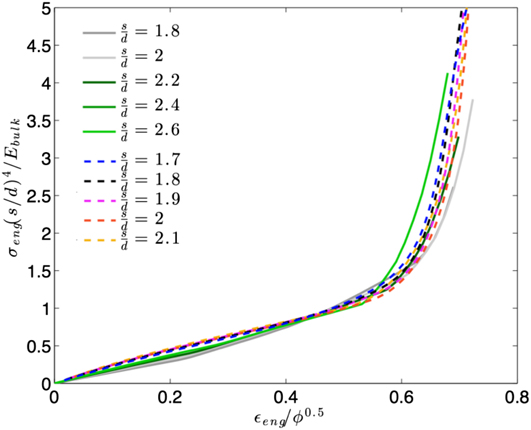
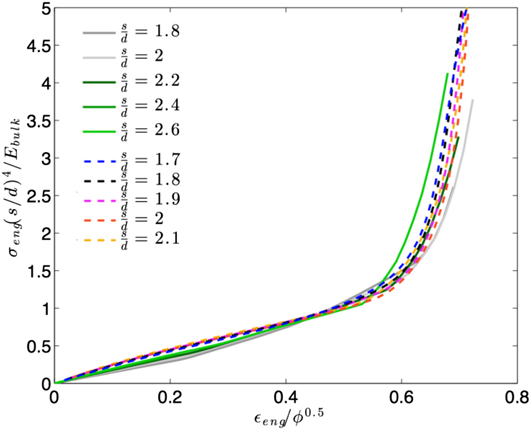
To demonstrate that computations and experiments yield comparable universal curves, both sets of scaled responses are shown in Fig. 7. Though the simulations slightly underestimate the experimental stress at lower strains, the general agreement is quite good, especially near the region of highest curvature where the slope dramatically increases toward lockup. By taking the average of all the rescaled computational and experimental data and fitting the resulting curve with an appropriate function, we can derive an analytical expression for the compressive mechanical behavior of the FCT architecture. For this function, we selected the Hill–Ogden hyperelastic foam model Reference Ogden24,Reference Hill25 defined by a strain energy function,
 $$U = \sum\limits_{i = 1}^N {{{2{\mu _i}} \over {\alpha _i^2}}\left[ {\lambda _1^{{\alpha _i}} + \lambda _2^{{\alpha _i}} + \lambda _3^{{\alpha _i}} - 3 + {1 \over {{\beta _i}}}\left( {{J^{ - {\alpha _i}{\beta _i}}} - 1} \right)} \right]} \quad ,$$
where λ
j
= 1 − ε
j
/ϕ1/2 are the rescaled principle stretches and J = λ1λ2λ3 is a scaled volumetric deformation. The parameters β
i
are related to Poisson’s ratio,
 ${v_i} = {{{\beta _i}} \over {1 + 2{\beta _i}}}$
, and to ensure a single-valued ratio, we assumed they were equal for all i. The scaled engineering stress was defined as the gradient of the strain energy with respect to the compression direction (j = 1):
 $$\sigma _1^{{\rm{eng}}}{\left( {{s \over d}} \right)^4}{1 \over {{E_{{\rm{bulk}}}}}} = {\lambda _2}{\lambda _3}{\sigma _1}{\left( {{s \over d}} \right)^4}{1 \over {{E_{{\rm{bulk}}}}}} = {{\partial U} \over {\partial {\lambda _1}}}\quad ,$$
where σ1 is the true stress, and (j = 2, 3) are the lateral directions. Upon taking the derivative,
 $$\sigma _1^{{\rm{eng}}}{\left( {{s \over d}} \right)^4}{1 \over {{E_{{\rm{bulk}}}}}} = \sum\limits_{i = 1}^N {{{2{\mu _i}} \over {{\alpha _i}}}{1 \over {{\lambda _1}}}\left( {\lambda _1^{{\alpha _i}} - {J^{ - {\alpha _i}\beta }}} \right)\quad ,}$$
with λ1 = 1 − εeng/ϕ1/2. Note to be consistent with the Ogden model for compression, the positive stress results presented in the figures were set to negative values and as defined, λ1 ≤ 1. No constraints were applied to the value of the volumetric deformation. Instead, J varied continuously with compression and was parameterized by β through Poisson’s ratio. From the previous definitions and assuming equal lateral strains λ2 = λ3 = λ1 −ν,
 $$J = {\left( {1 - {{{\varepsilon _{{\rm{eng}}}}} \over {{\phi ^{{1 \over 2}}}}}} \right)^{1 - 2\left( {{\beta \over {1 + 2\beta }}} \right)}}\quad ,$$
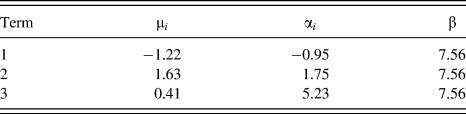
with εeng ≥ 0. Selecting N = 3 terms provided a good fit to the scaled curve with the set of seven parameters {μ i , α i , β} listed in Table I. This parameterization also produces zero lateral principle stresses over the entire deformation range, so the results are self-consistent for uniaxial compression. With this analytical reduced order model, we can rapidly iterate through a majority of the design space indicated in Fig. 2. Moreover, including a variable modulus significantly increases the design potential, the ability to meet a wide range of prescribed requirements, and obtain optimal performance for the desired application.
Normalized stress responses of both computational (solid lines) and experimental (dashed lines) FCT data sets. The legend indicates the dimensionless pitch.
Parameters for the reduced order model described by Eq. (9).

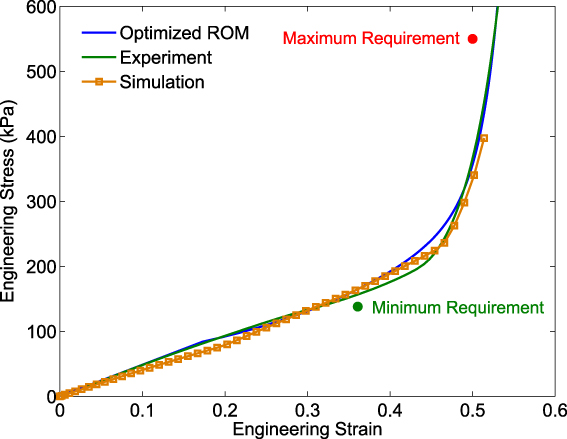
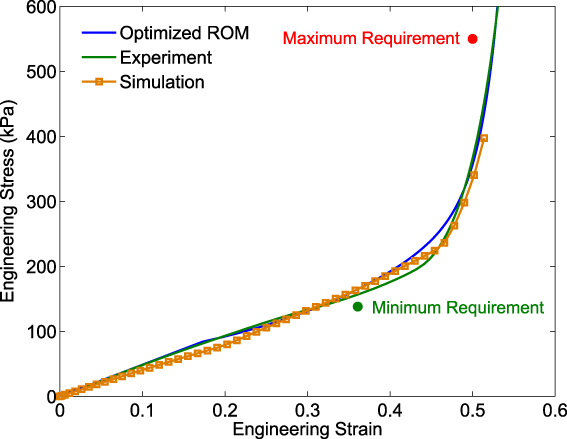
To demonstrate how the reduced order model can be applied to design using some of our custom ink formulations, let’s assume we would like to determine an FCT structure that satisfies a minimum loading requirement of 138 kPa at 36% strain and does not exceed a maximum stress of 550 kPa at 50% strain. With our reduced order model, we define an optimization problem that yields a response curve whose points at the strain requirements are equidistant from their respective stresses. The cost function to minimize is expressed as
 $$\phi = {\left[ {{{\left( {\sigma _{\min }^{{\rm{req}}} - \sigma _{\min }^{{\rm{sol}}}} \right)}^2} - {{\left( {\sigma _{\max }^{{\rm{req}}} - \sigma _{\max }^{{\rm{sol}}}} \right)}^2}} \right]^2}\quad ,$$
where
 $\sigma _{{\rm{min/max}}}^{{\rm{req}}}$
are the specified loading requirements and
 $\sigma _{{\rm{min/max}}}^{{\rm{sol}}}$
is the stresses of the proposed solution at the strain requirements. Additional terms are added as constraints so the stress response curve always exceeds the minimum requirement and lies below the maximum at those prescribed strains. The dividing rectangles (DIRECT) derivative-free global optimization algorithm
Reference Finkel and Kelley26
sweeps through a specified s/d range and the available moduli from our custom resins to produce a solution. For these requirements, the ROM produced a design with a pitch s/d = 2.25 and an ink modulus of 4.3 MPa. Figure 8 compares the stress response from the ROM design curve, the mechanical test of the printed design, and a finite element simulation of the as-built architecture, incorporating the measured strand diameter, pitch, and thickness. The maximum and minimum load requirements are also indicated. The close correspondence of all three curves serves as validation for the capabilities of the ROM. With this model, we can rapidly arrive at an optimal design for any type of loading constraint, provided it is consistent with the assumptions in the model, without costly simulations and/or experimental testing. We can also incorporate the properties of new resins once their response is characterized and parametrized with a constitutive model.
Results from a design optimization example for the FCT architecture. The design criteria are indicated by the minimum and maximum load requirements. The designed response produced by the reduced order model is shown in blue. The experimental validation from a compression test is indicated by the green line and results from a finite element simulation appear as orange squares.
IV. CONCLUSIONS
We have demonstrated that the stress response of the face-centered tetragonal DIW architecture under compression can be parameterized by two independent variables, the relative pitch s/d and the Young’s modulus of the elastomeric resin, provided the number of layers exceeds a minimum value and the applied load spans an area significantly larger than the size of the filaments. With these two parameters, a single design curve can be derived that can predict the stress response over a significant fraction of this two-dimensional parameter space. By fitting this curve with an Ogden foam model, we produced an analytical reduced order model that is easily implemented within an optimization problem. We also demonstrated how to apply this model to solve the inverse problem and obtain a structural design that meets a given set of loading requirements.
Our results indicate that a similar scaling also holds for the simple cubic architecture under compression. One limitation in this analysis is that the porosity is assumed to be uniform throughout the structure. Removing this constraint further enhances the ability to manipulate the shape of the load response curve, so the behavior of graded porosity DIW cushions is currently under investigation. One hypothesis is that the response from a nonuniform porosity is comparable to the response of a uniform structure with porosity equal to the average porosity of the inhomogeneous structure. In the future, we will also expand our analysis and incorporate additional parameters such as an arbitrary rotation angle between layers and hybrid architectures within a single cushion. Ultimately, we plan to derive a family of universal response curves and corresponding models for these stacked filament-based structures for both static and dynamic loading.
ACKNOWLEDGMENTS
The authors would like to thank the reviewers for suggestions to improve the description of the reduced order model. This work performed under the auspices of the U.S. Department of Energy by Lawrence Livermore National Laboratory under Contract DE-AC52-07NA27344 (LLNL-TR-714174).