The term ‘well-being’ pertains to physical and psychological status relative to an individual's efforts to adapt to the environment (Broom and Johnson, Reference Broom and Johnson2019). According to John Webster, a fitting breeding environment must favor five freedoms: (1) freedom from thirst, hunger, and malnutrition; (2) freedom from pain, injury, and disease; (3) freedom from discomfort; (4) freedom to express their natural behavior; and (5) freedom from fear and stress (Pacheco et al., Reference Pacheco, Saad and Trevizan2012). These guidelines facilitate the qualitative assessment of physical, mental, and natural factors of well-being and of the likely discomforts in each of these aspects.
Today, technologies that encourage animal welfare include the use of pheromones, which are the semiochemicals that can influence the behavior of conspecifics (Falewee et al., Reference Falewee, Gaultier, Lafont, Bougrat and Pageat2006; Taylor and Mills, Reference Taylor and Mills2007; Temple et al., Reference Temple, Barthélémy, Mainau, Cozzi, Amat, Canozzi, Pageat and Manteca2016). These pheromones can be recognized by the vomeronasal (or Jacobson's) organ (Crowell-Davis and Houpt, Reference Crowell-Davis and Houpt1985; Kekan et al., Reference Kekan, Ingole, Sirsat, Bharucha, Kharde and Nagvekar2017). The porcine appeasing pheromone was first isolated from sow mammary glands (Pageat, Reference Pageat2001). Thereafter, these appeasing pheromones were investigated in other mammalian species, such as dogs, cats, and cattle (Pageat and Gaultier, Reference Pageat and Gaultier2003; Gunn-Moore and Cameron, Reference Gunn-Moore and Cameron2004; Tod et al., Reference Tod, Brander and Waran2005; Hargrave, Reference Hargrave2014; Osella et al., Reference Osella, Cozzi, Spegis, Turille, Barmaz, Lecuelle, Teruel, Bienboire-Frosini, Chabaud, Bougrat and Pageat2018).
Bovine appeasing substance (BAS) is a synthetic pheromone similar to the natural hormone that cows secrete just after calving. It is composed of a blend of fatty acids that reproduces the original substance (Osella et al., Reference Osella, Cozzi, Spegis, Turille, Barmaz, Lecuelle, Teruel, Bienboire-Frosini, Chabaud, Bougrat and Pageat2018; Cappellozza and Cooke, Reference Cappellozza and Cooke2022). When BAS was used in cattle, it increased daily weight gain and the final weight of calves (Cooke et al., Reference Cooke, Millican, Brandão, Schumaher, de Sousa, Castro, Farias and Cappellozza2020). Additionally, it lowered hair cortisol and haptoglobin levels in beef steers (Schubach et al., Reference Schubach, Cooke, Daigle, Brandão, Rett, Ferreira, Scatolin, Colombo, D'souza and Pohler2020). Furthermore, it improved the immune response of animals with respiratory diseases (Hervet et al., Reference Hervet, Bouiller, Guiadeur, Michel, Brun-Lafleur, Aupiais, Zhu, Mounaix, Meurens and Rennois2021) and supported increased milk production while decreasing somatic cell count (SCC) in dairy cows (Osella et al., Reference Osella, Cozzi, Spegis, Turille, Barmaz, Lecuelle, Teruel, Bienboire-Frosini, Chabaud, Bougrat and Pageat2018).
The greatest challenge for dairy cattle welfare occurs during the peripartum period, known as the transition period, which begins 3 weeks before calving and lasts approximately 3 weeks after. During this time, cows undergo homeorhetic adaptations to support the rise in colostrum and milk production (Marett et al., Reference Marett, Auldist, Moate, Wales, Macmillan, Dunshea and Leury2015). However, these metabolic adjustments can increase susceptibility to illnesses and immunological dysfunctions, with over 70% of illnesses occurring during this stage (Ortolani, Reference Ortolani2009; Daros et al., Reference Daros, Weary and von Keyserlingk2022). Recent research has examined the relationship between energy balance and immune function during this critical period. Understanding these interactions is vital for developing strategies to minimize the negative impacts associated with the transition period (Daros et al., Reference Daros, Weary and von Keyserlingk2022). Therefore, implementing technologies that enhance animal welfare and support cow health during this phase is essential (Falewee et al., Reference Falewee, Gaultier, Lafont, Bougrat and Pageat2006; Taylor and Mills, Reference Taylor and Mills2007; Carroll and Forsberg, Reference Carroll and Forsberg2007; Temple et al., Reference Temple, Barthélémy, Mainau, Cozzi, Amat, Canozzi, Pageat and Manteca2016; Hervet et al., Reference Hervet, Bouiller, Guiadeur, Michel, Brun-Lafleur, Aupiais, Zhu, Mounaix, Meurens and Rennois2021; Cappellozza and Cooke, Reference Cappellozza and Cooke2022).
In this context, the use of bovine appeasing substance (BAS) has shown promise. Studies suggest that BAS can improve milk production and quality, optimize energy metabolism, and strengthen the immune system of cattle (Osella et al., Reference Osella, Cozzi, Spegis, Turille, Barmaz, Lecuelle, Teruel, Bienboire-Frosini, Chabaud, Bougrat and Pageat2018; Angeli et al., Reference Angeli, Cappellozza, Moraes Vasconcelos and Cooke2020; Hervet et al., Reference Hervet, Bouiller, Guiadeur, Michel, Brun-Lafleur, Aupiais, Zhu, Mounaix, Meurens and Rennois2021; Cappellozza and Cooke, Reference Cappellozza and Cooke2022). Additionally, BAS may reduce the adverse effects of the transition period on the metabolism and performance of highly productive dairy cows.
Thus, this study aims to evaluate the impact of BAS on feed intake, milk production, blood parameters, energy metabolism, stress, and inflammation in dairy cows during the transition period.
Materials and methods
This study was conducted on a commercial property in the southern region of the state of Rio Grande do Sul (32°, 16'S, 52 67° 32’ E), with 400 housed lactating cows producing a total of 12,000 L/d. The cows were kept in a compost barn-type confinement system and were fed a total mixed ration (TMR) using automatic, individual feeders (AF 1000 electronic trough, Intergado®, Betim, Minas Gerais, Brazil) twice daily. The animals had access to water ad libitum. They were milked twice daily: at 8:00 and 20:00 h. All animal procedures were approved by the Animal Ethics and Experimentation Committee of the Federal University of Pelotas (project number 044683).
To determine sample size, blood cortisol levels were evaluated from three weeks prior to calving until to two weeks post-calving. The calculation was performed using the OpenEpi epidemiological calculator, following the formula available at (https://www.openepi.com/SampleSize/SSMean.htm). Therefore, for the sample size calculation of each cycle, a total sample size of 24 animals was determined.
Separation of animals and experimental design
Twenty-four multiparous cows were selected and monitored from day-28 pre-partum to day-21 postpartum. A completely randomized experimental design was adopted, and the cows were separated into two experimental groups: the control group (n = 12) and BAS group (n = 12) (SecureCattle®, Nutricorp©, Araras, São Paulo, Brazil; n = 12). The inclusion criterion was cows in their 2nd to 5th lactation, with an average lactation number of 3 for both groups. All animals were housed in a single compost barn-type shed, which was subdivided by electric fencing to maintain a minimum distance of 50 m between groups due to the volatile nature of the product. A dose of 5 mL/animal was administered topically at the nape on day-28 and day-14 relative to the expected calving date, and on the calving day (D0). No management procedures were performed to simulate the application in the Control group (placebo), as the topical application did not induce stress. Throughout the experiment, a minimum distance of 50 m was maintained between the groups. The experiment took place from January to August 2022.
Feed samples and bromatological analyses
Corn silage and pre-dried ryegrass samples were obtained twice weekly to form a weekly pool. TMR samples from the experimental batches were also collected daily for dry matter analysis and a weekly pool was created for other analyses. The samples were frozen for analysis of dry matter (DM), crude protein (CP), neutral detergent fiber (NDF), acid detergent fiber (ADF), ether extract (EE), non-fibrous carbohydrates (NFC), and mineral residue (MR).
The feed samples were analyzed at the Animal Nutrition Laboratory, in the NUPEEC Hub, at the Federal University of Pelotas. First, the samples were subjected to a 72-h pre-drying process in a forced circulation oven, set to 55 °C. Next, the samples were ground in a knife mill. For the definitive DM analysis, the ground samples were placed in an oven set to 105° C for at least 8 h (Easley et al., Reference Easley, McCall, Davis and Shirley1965). For mineral matter analysis, 1 g of ground sample was weighed in triplicate and added to the muffle furnace at 600 °C for 3 h to burn the organic residue (Association of Official Analytical Chemists – International [AOAC], 1995). The value obtained was then subtracted to define the gross mineral matter.
To determine crude protein, the method of Kjeldhal (Association of Official Analytical Chemists – International [AOAC], 1995) for nitrogen determination was used, which included 4% (w/v) boric acid solution as a free ammonia receptor during distillation, a 0.2% (w/v) bromocresol green solution, and 0.1% (w/v) methyl red as the indicator, along with a standard sulfuric acid solution for titration (Kozloski et al., Reference Kozloski, Perottoni, Ciocca, Rocha, Raiser and Sanchez2003). Following this, the NDF and ADF analyses were performed as previously described (Van Soest and Robertson, Reference Van Soest and Robertson1985). NFC were estimated using the formula NFC = 100 – CP – MR – EE – NDF (Sniffen et al., Reference Sniffen, O'Connor, Van Soest, Fox and Russell1992). The average chemical composition of the diets provided to the animals during the experimental phase is shown in Table 1. The formulated diets followed the recommendations of National Academies of Sciences, Engineering, and Medicine [NASEM] (2021).
Average chemical composition and ingredients of pre- and postpartum diets during the experimental period

Table 1 Long description
The table compares average nutrient composition and ingredient amounts for pre-partum versus postpartum diets during an experimental period. Dry matter is similar between diets, at 43.14 percent pre-partum and 42.29 percent postpartum. Postpartum increases non-fibrous carbohydrates from 22.71 to 26.79 percent of dry matter, ether extract from 3.09 to 4.90 percent of dry matter, and crude protein from 12.29 to 14.67 percent of dry matter. Fiber decreases postpartum, with acid detergent fiber dropping from 37.70 to 31.33 percent of dry matter and neutral detergent fiber from 51.64 to 46.13 percent of dry matter; mineral residue also declines from 9.47 to 8.20 percent of dry matter. Several minerals and trace elements are reported only for the pre-partum diet, including chlorine, boron, calcium, copper, sulfur, iron, and phosphorous, so those values cannot be compared across periods. Ingredient changes align with the nutrient shifts: pre-partum includes 5.00 kg concentrate pre-partum, 12.00 kg corn silage, and 2.50 kg oat hay, while postpartum uses 11.90 kg lactation concentrate, 35.80 kg corn silage, and 6.00 kg pre-dried ryegrass and clover.
* Nutrient was not analyzed in the diet.
Feed consumption
Feed intake was recorded continuously, using automatic, individual intelligent feeders (Electronic Trough AF 1000, Intergado®, Betim, Minas Gerais, Brazil). The control group was housed on one side of the barn and had access to eight feeders, while the BAS group was restricted to the other side, with access to eight different feeders. According to the manufacturer's recommendations, there was a maximum 1.6 animals per feeder.
Animals were given a space in the compost barn that allowed sole access to the feeders via a radio-frequency identification tag. One TMR sample was obtained daily from the output and dried in an air fryer to ascertain the concentration of DM (Erker and Brus, Reference Erker and Brus2023). The TMR was made available twice a day at 11:00 a.m. and 4:00 p.m.
Milk production and analysis of milk constituents
Milk production was assessed electronically using DelPro™ software (DeLaval®, Tumba, Botkyrka, Sweden), and in-person monitoring was performed during the two daily milkings. The milk from two sequential milkings was collected twice a week for each animal, totaling six samples per cow. The samples were preserved with bronopol and kept at room temperature, analyzed within 7 days, and send to the Centralized Milk Quality Analysis Laboratory (LCAQL) (APCBRH, Curitiba, Paraná, Brazil) to analyze the milk constituents (fat, lactose, protein and total solids) via spectrophotometry, as well as the somatic cell count (SCC) via flow cytometry (NexGen, Bentley Instruments®, Chaska, United States).
Blood analyses
Six blood samples (4 mL) were retrieved per cow by puncturing the coccygeal arteriovenous complex on day-28 and day-14 before expected parturition, on the parturition day (D0), and on days 7, 14, and 21 postpartum. These collections were performed prior to the provision of the morning diet. The samples were kept at room temperature for a maximum of 30 min before processing and centrifuged at 1,800 × g for 15 min. Serum samples were drawn and analyzed for free fatty acids (FFA), beta-hydroxybutyrate (BHB), myeloperoxidase (MPO), paraoxonase (PON-1) and blood cortisol. Plasma (KF-EDTA) was used for glucose analysis. The FFA, BHB and glucose were analyzed using an automatic biochemical analyzer (Labmax Plenno®, LabTest, Lagoa Santa, Minas Gerais, Brazil) with commercial kits (DiaSys Diagnostic Systems kits). Myeloperoxidase was investigated using the enzyme-linked immunosorbent assay (ELISA; ELK Biotechnology CO., LTD, Wuhan, Hubei, China) with an ELISA plate reader at a wavelength of 450 nm (Thermoplate, Palm City, FL, USA). PON-1 activity was assessed using a commercial kit (ZeptoMetrix Corporation®, USA) via kinetic spectrophotometry (T80 UV/VIS, PG Instruments, England) in duplicate. Blood cortisol was analyzed using an immunoassay analyzer (Access 2, Beckman Coulter®, Brea, California, United States) with a commercial kit (Access Cortisol kit). The Metabolism Laboratory, NUPEEC Hub (Federal University of Pelotas, Pelotas, Rio Grande do Sul, Brazil) supplied all the equipment utilized for these tests. Intra- and inter-assay precision was determined by analyzing six samples obtained on the same or different days, and the coefficient of variation remained below 5%.
Clinical and zootechnical evaluations
Clinical examinations of all the animals were performed weekly, and their weight and body condition score (BCS) were recorded. A bovine weighing tape was used to record the weights by positioning it posterior to the scapulohumeral joint to determine the circumference of the thoracic perimeter. Heart rate, respiratory rate, rumen movements, rectal temperature, color of the ocular and vaginal mucous membranes, and capillary refill time were evaluated (Feitosa, Reference Feitosa2020).
Feed efficiency was calculated as total milk production divided by DMI (Blake and Custodio, Reference Blake and Custodio1984). A trained evaluator assessed BCS on a scale of 1 to 5, using 0.25 subdivision points (Edmonson et al., Reference Edmonson, Lean, Weaver, Farver and Webster1989). Energy balance (EB) was calculated for each cow using previously described equations. Net energy intake (NEI) was determined by multiplying daily DMI by the laboratory-calculated net energy for lactation (NEL) density of the diet. Net energy for maintenance was calculated as NEM = 0.10 × BW kgˆ0.75.
Requirements for NEL for milk production were calculated as NEMILK = 9.29 × kg fat/kg milk + 5.5 × kg crude protein/kg milk + 3.95 × kg lactose/kg milk. NEL available (Mcal/kg loss) was calculated as NEL available = 5.6 Mcal NEL/kg BW loss. The equation used to calculate postpartum EB was EBPOST (Mcal/d) = NEI – (NEM + NEMILK + NEL available).
For the equations, milk production and DMI data were obtained daily during the 21 d postpartum; weight data were obtained from the two postpartum weights and averaged over the 21 d. The milk component data were from six postpartum samples and were averaged over the 21 d. Using daily intake and milk production data, milk efficiency (ME) was calculated with the formula ME = Milk Quantity (L)/Dry Matter Intake (kg) (Nasrollahi et al., Reference Nasrollahi, Ghorbani, Zali and Kahyani2017).
Statistical analysis
Statistical analyses were conducted using the JMP Pro 14 software. Analysis of the dependent variables was performed using a mixed analysis of variance by repeated measures (ANOVA) model, adopting the PROC MIXED procedure. The model was constructed with the treatment and time (days) variables, and interactions between variables were treated as fixed effects, while animals were regarded as a random effect. In the randomization process, both the number of lactations and the production in the previous lactation were considered. The Tukey test was used to compare the means between the groups. The covariance structure used was Variance Components, selected for having the lowest value in the Bayesian information criterion (BIC). Data were analyzed for normality and homogeneity of variance through histogram analysis and the Shapiro-Wilk method, with a value above 0.80 considered acceptable. The accepted level of significance was P ≤ 0.05, and trends were recognized if P > 0.05 and P ≤ 0.10.
Results
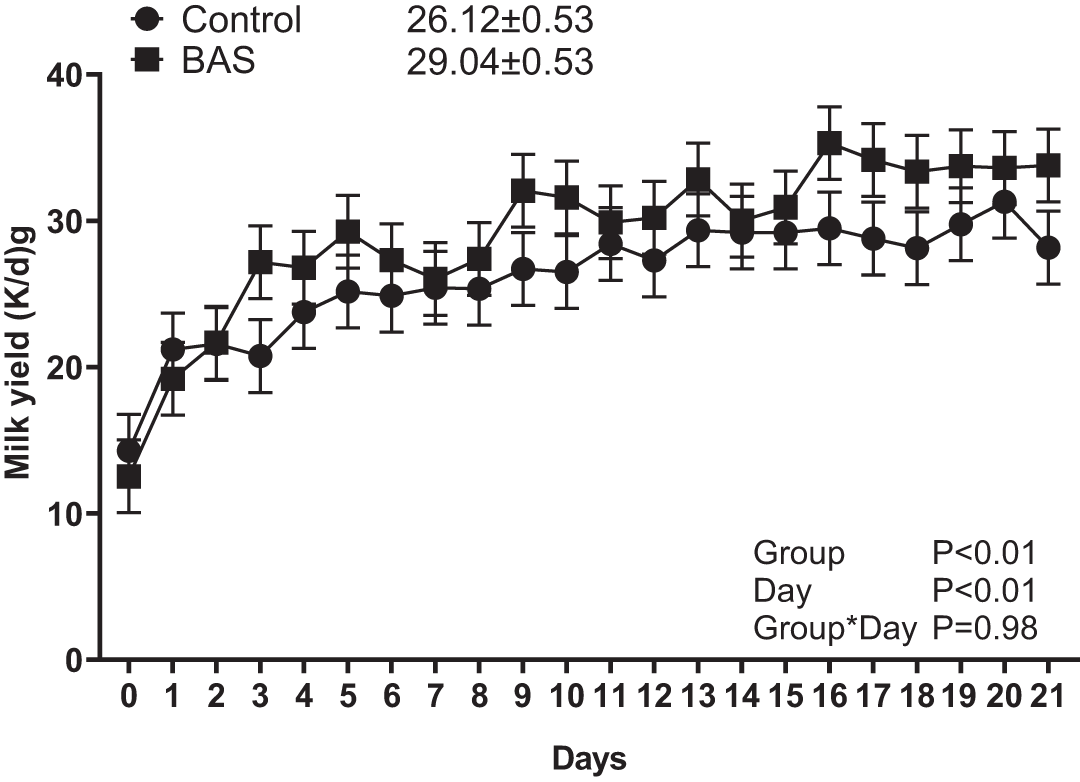
The BAS group produced 29.04 ± 0.53 kg of milk/day, while the control group produced 26.12 ± 0.53 kg milk/day, a difference of 2.92 kg milk/day (P < 0.05) as shown in Fig. 1. Cows in the control group exhibited a DMI of 14.31 ± 0.40 kg/day pre-partum, compared to 10.34 ± 0.34 kg/day for the cows in the BAS group (P < 0.05) (Fig. 2A). Moreover, the control group exhibited a DMI of 16.24 ± 0.44 kg/day postpartum, while the BAS group consumed 12.91 ± 0.41 kg/day (P < 0.05) (Fig. 2B). This indicates that cows in the BAS group produced milk more efficiently despite lower feed consumption (feed efficiency: BAS = 2.21; Control = 1.38; P˂0.01).
Milk yield of multiparous cows in the control and BAS groups over 21 d postpartum (data are shown as mean ± standard error).

Figure 1 Long description
The graph compares milk yield of multiparous cows in Control and BAS groups over 21 days postpartum. The x-axis represents days, ranging from 0 to 21. The y-axis represents milk yield in kilograms per day, ranging from 0 to 40. The Control group is represented by circles, while the BAS group is represented by squares. The BAS group consistently shows higher milk yield, starting at approximately 10 kg/day and reaching around 30 kg/day. The Control group starts similarly but remains slightly lower throughout, peaking at around 28 kg/day. Notable fluctuations occur between days 5 and 10, with the BAS group showing more stability. Statistical significance is indicated with P values: Group P<0.01, Day P<0.01, Group*Day P=0.98. The BAS group averages 29.04 kg/day, while the Control group averages 26.12 kg/day, highlighting a consistent difference in yield.
(A) DMI of multiparous cows in the control and BAS groups over 28 d pre-partum. (B) DMI of multiparous cows in the control and BAS groups over 21 d postpartum excluding calving day. All data are shown as mean ± standard error.

Figure 2 Long description
The image A showing a line graph with two series and error bars. Legend: Control; BAS. Control is shown with circle markers connected by a line. BAS is shown with square markers connected by a line. Text near legend: Control 14.31 plus or minus 0.40; BAS 10.34 plus or minus 0.34. Y-axis label: Dry matter intake (Kg/d). Y-axis range: 0 to 25. X-axis label: Days pre-partum. X-axis range: negative 28 to negative 1. Text block: Group P less than 0.01; Day P less than 0.01; Group times Day P equals 0.94. Series data are shown as points with vertical error bars at each day. Control values are generally higher than BAS across the days shown. Control shows higher points around the mid to late negative 20s and again around the mid negative teens, with several points near the upper teens on the y-axis. BAS points are mostly around the low teens on the y-axis, with a smaller rise around the mid negative 20s and values closer to around 10 to 12 for many days. The image B showing a line graph with two series and error bars. Legend: Control; BAS. Control is shown with circle markers connected by a line. BAS is shown with square markers connected by a line. Text near legend: Control 16.24 plus or minus 0.44; BAS 12.91 plus or minus 0.41. Y-axis label: Dry matter intake (Kg/d). Y-axis range: 0 to 30. X-axis label: Days pos-partum. X-axis range: 0 to 21. Text block: Group P less than 0.01; Day P less than 0.01; Group times Day P equals 0.60. Series data are shown as points with vertical error bars at each day. Control values are generally higher than BAS across the days shown. Control starts in the low to mid teens near day 0, then rises through the mid to late postpartum days, reaching points above 20 near the end of the range. BAS stays lower, with many points around the low to mid teens and a smaller rise in the mid to late postpartum days.
The results of the blood analyses for the control and BAS groups are shown in Table 2. Pre-partum, all parameters for both groups were within the physiological range. Postpartum, the plasma cortisol level was lower in the BAS group (P < 0.05). Cows in the BAS group had an energy balance of − 10.69 ± 0.92 Mcal/day, whereas cows in the control group had 3.01 ± 0.92 Mcal/day (P < 0.01). No differences were found in the parameters of FFA, BHB, MPO, glucose and PON-1 between the groups both prepartum and postpartum (P > 0,05).
Energy balance and blood metabolites analyses of multiparous cows in the control and BAS groups

Table 2 Long description
The table reports mean values with standard errors for blood metabolites and energy balance in multiparous cows assigned to Control or BAS, separated into pre-partum and postpartum periods, with p values for group, day, and their interaction. Pre-partum, group differences were not statistically significant for free fatty acids, beta-hydroxybutyrate, glucose, cortisol, or myeloperoxidase; glucose changed by day. Postpartum, energy balance differed strongly by group, with BAS much more negative than Control, while day and the group-by-day interaction were not significant for energy balance. Postpartum cortisol was lower in BAS than Control, and cortisol also varied by day, with no evidence of a group-by-day interaction. Free fatty acids and glucose showed significant day effects postpartum, but no significant group differences. Beta-hydroxybutyrate, paraoxonase, and myeloperoxidase postpartum did not differ by group and showed no meaningful day or interaction effects. Some pre-partum p values are missing for myeloperoxidase because it was only analyzed once in that period, limiting conclusions about day and interaction effects for that measure.
1BAS: Bovine Appeasing Substance; 2EB: energy balance; The metabolites that have * do not present the P values on the day and group*day because there was only one analysis of this parameter in the pre-partum period. Data are shown as mean ± standard error.
The results for body weight are presented in Table 3 and values did not differ between groups (P > 0.05), with the control and BAS groups presenting mean prepartum body weights of 734 ± 11 kg and 735 ± 11 kg, respectively. However, there was a trend towards lower BCS in the BAS group compared to the control group in the prepartum period (P = 0.07). In the postpartum period, no differences were found in body weight and BCS parameters between the groups, with a mean weight of 705 ± 11 kg observed in the control group and 728 ± 11 kg in the BAS group, and BCS values of 3.56 ± 0.12 and 3.45 ± 0.12, respectively (P > 0,05), as shown in Table 3.
Body weight and body condition score of multiparous cows from the control and BAS groups

Table 3 Long description
The table reports mean body weight and body condition score for multiparous cows in a control group and a BAS-treated group, measured pre-partum and postpartum, along with p values for group, week, and group-by-week effects. Pre-partum body weight is nearly identical between groups, about 734 to 735, with no evidence of group, week, or interaction effects. Pre-partum body condition score is slightly lower in the BAS group, about 3.75 versus 4.06, but the group p value is 0.07, which does not meet a 0.05 threshold. Postpartum body weight is lower in control than BAS, about 705 versus 728, yet the group p value is 0.15 and week and interaction p values also indicate no clear effects. Postpartum body condition score is similar between groups, about 3.56 versus 3.45, with no evidence of group, week, or interaction effects. Overall, the results suggest no statistically clear differences between groups across time for either measure, and values are presented as means with standard errors.
1BAS: Bovine Appeasing Substance; 2BCS: Body Condition Score
Data are shown as mean ± standard error.
Milk composition results for multiparous cows in both groups are shown in Table 4. The BAS group had slightly higher lactose levels and total solids than the control group, (P = 0.10 and P = 0.08, respectively). There were also no significant differences between the groups for fat, protein, and SCC parameters (P = 0.13; P = 0.42 and P = 0.99, respectively; Table 4).
Milk composition and somatic cell count (SCC) of multiparous cows in the control and BAS groups

Table 4 Long description
The table reports milk fat, lactose, protein, total solids, and somatic cell count for multiparous cows in a control group and a BAS group, with mean values and standard errors plus p values for group, days, and their interaction. BAS cows had slightly higher fat (4.43 versus 3.95) and total solids (12.63 versus 11.79) and slightly higher lactose (4.24 versus 4.08) and protein (3.41 versus 3.34) than controls. The group effect was not statistically significant for any component, though total solids and lactose were close to significance and fat was also not significant. Protein and total solids showed a statistically significant effect of days, indicating these measures varied over time regardless of group. Fat, lactose, and somatic cell count did not show a significant days effect. No group by day interaction was significant, suggesting the pattern over time was similar for control and BAS. Somatic cell count was the same in both groups (2.87 in each) with no meaningful differences by group or over days.
1BAS: Bovine Appeasing Substance; 2Somatic Cell Count (SCC): log10/mL; Fat, lactose, protein and total solids: g/100 g.
Data are shown as mean ± standard error.
Discussion
In the present study, the milk yield was 2.92 kg/day (P < 0.05) higher in cows that received BAS than in controls. This is consistent with previous findings showing a benefit of 1.65 kg milk/day in cows receiving BAS during the transition between a confined and a semi-confined system (Osella et al., Reference Osella, Cozzi, Spegis, Turille, Barmaz, Lecuelle, Teruel, Bienboire-Frosini, Chabaud, Bougrat and Pageat2018). The authors attributed this result to the reduced levels of environmental change-related stress. Cortisol can inhibit the production of oxytocin, which controls milk ejection. High output of cortisol can negatively affect prolactin levels which control milk production. Therefore, animals that experience stressful periods show decreased milk production caused by the negative effect that stress exerts on oxytocin and prolactin (Edmonson et al., Reference Edmonson, Lean, Weaver, Farver and Webster1989; Bobić et al., Reference Bobić, Mijić, Knežević, Šperanda, Antunović, Baban, Sakač, Frizon and Koturić2011).
BAS activity can reduce reactivity to neuroendocrine stress (Cappellozza and Cooke, Reference Cappellozza and Cooke2022). This is consistent with our results, which demonstrated a clear BAS-induced reduction in plasma cortisol levels. A drop in serum cortisol following BAS treatment was previously described in Angus steers in a feedlot system for Colombo et al. (Reference Colombo, Cooke, Brandão, Wiegand, Schubach, Duff, Gouvêa and Cappellozza2020) 7 days after BAS application, as well as by Fonseca et al. (Reference Fonseca, Cappellozza, Sousa, Sagawa, Rett, Chizzotti and Cooke2021) when using BAS before transport and upon arrival at the feedlot in Nellore bulls. The pheromone used in this study likely decreased the response of the hypothalamic-pituitary-adrenal axis (Cappellozza and Cooke, Reference Cappellozza and Cooke2022). In contrast, BAS did not reduce cortisol concentrations when administered to Bos indicus calves at weaning, as reported by Cooke et al. (Reference Cooke, Millican, Brandão, Schumaher, de Sousa, Castro, Farias and Cappellozza2020), nor in Nelore calves at weaning (Schubach et al., Reference Schubach, Cooke, Daigle, Brandão, Rett, Ferreira, Scatolin, Colombo, D'souza and Pohler2020). Cortisol concentrations have been extensively used to assess the adrenocortical responses in cattle (Carroll and Forsberg, Reference Carroll and Forsberg2007); however, the outcomes may be affected by stress during sampling (Cooke, Reference Cooke2017; Colombo et al., Reference Colombo, Cooke, Brandão, Wiegand, Schubach, Duff, Gouvêa and Cappellozza2020). Therefore, hair retrieval is suggested to determine hair cortisol, which provides a long-term response (Cooke, Reference Cooke2017). Schubach et al. (Reference Schubach, Cooke, Daigle, Brandão, Rett, Ferreira, Scatolin, Colombo, D'souza and Pohler2020) observed a reduction in hair cortisol in calves at weaning after 14 days of BAS application. More recently, Pickett et al. (Reference Pickett, Cooke, de Souza and Mackey2024) also found lower hair cortisol in Angus calves using a reliever pheromone than in control animals. However, BAS had no effect on hair cortisol in studies by Cooke et al. (Reference Cooke, Millican, Brandão, Schumaher, de Sousa, Castro, Farias and Cappellozza2020) and Schubach et al. (Reference Schubach, Cooke, Daigle, Brandão, Rett, Ferreira, Scatolin, Colombo, D'souza and Pohler2020), suggesting that this substance likely affects metabolism through alternative metabolic pathways.
In this study, the influence exerted by the pheromone on the hypothalamic-pituitary-adrenal pathway partially explains the increased milk production in treated cows. However, the galactopoietic hormones, serotonin and prolactin, can also affect milk production. BAS is a well-known promoter of comfort and well-being with the ability to lower serum cortisol concentrations. Furthermore, serotonin plays fundamental roles in animal metabolism and is also an important hormone produced in the mammary gland to assist in coordinating lactation (Forslund et al., Reference Forslund, Ljungvall and Jones2010). Recently, studies have demonstrated the influence of serotonin on calcium homeostasis during lactation in rodents and dairy cows (Schubach et al., Reference Schubach, Cooke, Brandão, Lippolis, Silva, Marques and Bohnert2017; Connelly et al., Reference Connelly, Weaver, Kuehnl, Fricke, Klister and Hernandez2021), and several studies have demonstrated the relationship between serotonin and prolactin in humans and rodents (Noel et al., Reference Noel, Dimond, Wartofsky, Earll and Frantz1974; Panerai et al., Reference Panerai, Petraglia, Sacerdote and Genazzani1985; Laporta et al., Reference Laporta, Moore, Weaver, Cronick, Olsen, Prichard, Schnell, Crenshaw, Penagaricano, Bruckmaier and Hernandez2015; Slater et al., Reference Slater, Endres, Weaver, Cheng, Lauber, Endres, Olstad, DeBruin, Crump, Block and Hernandez2018). Therefore, we hypothesize that BAS increases serotonin concentrations by reducing cortisol levels, ultimately increasing prolactin secretion and milk production. Nonetheless, prolactin has been scarcely evaluated in studies with cattle. Greater clarity regarding the relationship between prolactin, serotonin, cortisol and peripartum conditions in dairy cows will significantly improve understanding on how well-being enhances milk production.
Cows receiving BAS produced milk more efficiently, with an intake of 3.33 kg of DM/day, which is less than that of cows in the control group. These data are consistent with the mechanism of BAS which includes improved nutrient utilization resulting in in greater feed efficiency (Apfelbaum, Reference Apfelbaum1987; Cappellozza and Cooke, Reference Cappellozza and Cooke2022). Reduced DM intake is a common feature of peripartum cows (Coiro et al., Reference Coiro, Gnudi, Volpi, Marchesi, Salati, Caffarra and Chiodera1987; Marett et al., Reference Marett, Auldist, Moate, Wales, Macmillan, Dunshea and Leury2015) generally exerts harmful effects on animal metabolism. The negative energy balance (NEB) during early lactation results from the gap between the energy needed for maintenance and milk secretion and the energy supply provided by feed intake (Drackley et al., Reference Drackley, Dann, Janovick, Litherland, Underwood and Loor2005). To sustain increasing milk yields during the first weeks of lactation, dairy cows must mobilize body reserves, mainly fat. The release of fatty acids (FA) from adipose depots is reflected in increased circulating FA concentrations (Schoenberg et al., Reference Schoenberg, Ehrhardt and Overton2012). In the present study, reduced feed intake and higher milk production in cows treated with BAS resulted in a NEB. Despite this, no difference was found between the groups in terms of FFA levels. Additionally, the body weight of the animals did not differ pre- and postpartum, and the BCS tended to be higher in the control than in the BAS group pre-partum, which did not occur postpartum.
It was expected that, with reduced intake and higher milk production in the BAS group, the levels of BHB and FFA would increase, indicating mobilization of body reserves to meet energy demand (Grummer, Reference Grummer1995), which was not observed. Furthermore, it was expected that, as the control group had a higher DMI, glucose levels would be higher in these animals compared to the BAS group, which was not demonstrated (Grummer, Reference Grummer1995; Jermann et al., Reference Jermann, Fritsche, Wagner, Wellnitz, Bruckmaier and Gross2022). However, this may have occurred due to the stability of glucose concentrations in cattle resulting from the action of insulin (Grummer, Reference Grummer1995; Fonseca et al., Reference Fonseca, Cappellozza, Sousa, Sagawa, Rett, Chizzotti and Cooke2021). These evaluations aimed to clarify the effect of BAS on the energy metabolism of dairy cows in the transition period, considering its already proven effects on health and welfare parameters. However, as there were no differences between the groups for these parameters, the route of action of this pheromone remains unclear, necessitating further studies focused on this aspect.
In addition, regarding milk composition and quality, it was expected to find effects of BAS mainly in the reduction of SCC in animals, associated with an improvement in the immune response resulting from the reduction of stress levels (Osella et al., Reference Osella, Cozzi, Spegis, Turille, Barmaz, Lecuelle, Teruel, Bienboire-Frosini, Chabaud, Bougrat and Pageat2018). However, this was not demonstrated in our study. It is known that SCC, in addition to being indicative of mammary gland health (Santos and Fonseca, Reference Santos and Fonseca2019), reflects litter and environmental quality in confined animals. Thus, considering that both groups had SCC greater than 200,000, it may be related to the management of bedding and milking (Magalhães et al., Reference Magalhães, El Faro, Cardoso, Paz, Cassoli and Machado2006). Regarding the parameters of fat, protein, lactose and total solids, a difference was expected in the BAS group because it had a higher volume of milk produced, which can change compounds such as fat and total solids (Huhtanen and Rinne, Reference Huhtanen and Rinne2007; Costa et al., Reference Costa, Lopez-Villalobos, Sneddon, Shalloo, Franzoi, De Marchi and Penasa2019), but it was not evidenced. There was a tendency to increase lactose and total solids in animals treated with BAS, indicating possible effects of the soothing pheromone on milk composition that can be better explored in future studies, as indicated by Osella et al. (Reference Osella, Cozzi, Spegis, Turille, Barmaz, Lecuelle, Teruel, Bienboire-Frosini, Chabaud, Bougrat and Pageat2018).
In the parameters related to immunity, we did not find differences between the groups in the serum levels of myeloperoxidase, which is an inflammatory marker with a microbiocidal role, present in immune cells such as neutrophils (Prata et al., Reference Prata, Havt, Bolick, Pinkerton, Lima and Guerrant2016). Addicionally, both groups showed similar levels of PON-1, indicating that the animals in both groups did not display signs of inflammatory processes. PON-1 is an acute-phase negative protein, meaning its values are reduced when there is inflammation (Pezzulo et al., Reference Pezzulo, Hornick, Rector, Estin, Reisetter, Taft, Butcher, Carter, Manak, Stoltz and Zabner2012). In the peripartum period, Bionaz et al. (Reference Bionaz, Trevisi, Calamari, Librandi, Ferrari and Bertoni2007) state that it is common to have a drop in PON-1 levels close to delivery, considering that the event itself involves inflammation to assist in the expulsion of the fetus and placenta (Sheldon et al., Reference Sheldon, Cronin, Healey, Gabler, Heuwieser, Streyl, Bromfield, Miyamoto, Fergani and Dobson2014), however, we did not find a difference between the groups. It was expected that there would be differences in inflammatory markers in the BAS group, as reported by Hervet et al. (Reference Hervet, Bouiller, Guiadeur, Michel, Brun-Lafleur, Aupiais, Zhu, Mounaix, Meurens and Rennois2021), but it is worth noting that the evaluated period may have been too short to verify the effects of BAS on inflammatory responses.
Conclusions
In conclusion, the treatment with BAS during the transition phase significantly reduced plasma cortisol levels, leading to increased milk production while simultaneously decreasing dry matter intake (DMI). This outcome reflects an improvement in feed efficiency among multiparous Holstein cows. These findings suggest that BAS not only promotes animal welfare by mitigating stress but also enhances productivity, indicating its potential as an effective management tool in dairy farming.
Acknowledgements
We would like to express our sincere gratitude to Quatro Irmãos Farm and its collaborators for their invaluable contributions to the success of the trial. We also acknowledge the support provided through research fellowships from Brazilian funding agencies, including the National Council for Scientific and Technological Development (CNPq) and Coordination for the Improvement of Higher Education Personnel (CAPES).
Competing interests
The authors declare no conflicts of interest.
Disclosure of AI Use
During the preparation of this work, the authors used ChatGPT to assist in translating the text into English. After using this tool, the authors reviewed and edited the content as needed and take full responsibility for the final version of the publication.