

Introduction
A salient feature of Chinese labour market is the fundamental segmentation into two distinct economies: urban and rural (Meng Reference Meng2012). This segmentation is intricately associated with a unique discriminatory policy in China known as the Household Registration System or ‘the Hukou System’. The Hukou system categorises residents into rural and urban areas and imposes strict controls on labour mobility, resulting in rural Hukou holders being treated as second-class citizens and facing overt discrimination. In response to these challenges, the Chinese government sought to deregulate labour markets and reform the Hukou system in the 1980s to facilitate rural residents’ ability to seek economic opportunities in major cities. This has resulted in a significant demographic shift, with a sizable section of rural residents now being urban migrants who hold rural Hukou but live in cities. However, unlike local citizens with urban Hukou, urban migrants still do not have equal access to state-sponsored benefits, including healthcare, education, and the labour market. The considerable costs associated with migration, exacerbated by the Hukou system, significantly impede the welfare and socio-economic stability of urban migrants.
Previous studies have examined the negative outcome of Hukou restriction. Most papers pay attention to the adverse impact of Hukou system on residential income (Démurger et al Reference Démurger, Gurgand, Li and Yue2009; Meng and Zhang Reference Meng and Zhang2001; Whalley and Zhang Reference Whalley and Zhang2007). These studies have consistently highlighted that urban migrants, burdened by their unfavourable position in the Chinese labour market, tend to earn significantly less than urban citizens. However, while income difference provides valuable insights into the impact of Hukou restrictions, it is important to recognise that the income difference may not capture the whole consequence imposed by the Hukou system. This is because Hukou restrictions have also precipitated various hidden forms of discrimination that extend beyond mere income disparities. In labour markets, it is significant for individuals to make decisions about their working type since it allows individuals to consider their skills, interests, and economic prospects, and exercise control over their career path. To comprehensively assess the ramifications of Hukou restriction, we focus on the impact of Hukou system on urban migrants’ work decision, especially the self-employment decision.
This paper investigates the impact of the Hukou system on self-employment decisions, paying most attention to the labour transition patterns in China. The study finds that, after controlling for individual characteristics, urban migrants are more likely to be self-employed than local citizens. The paper also examines a potential explanation for this positive relationship. The possible explanation posits that urban migrants’ pivot towards self-employment as a reactive measure against the discriminatory practices entrenched in labour markets (Meng Reference Meng2012). Specifically, their Hukou status subjects them to exclusion from formal contractual employment opportunities, which are predominantly reserved for holders of local urban Hukou. As a direct consequence of these systemic barriers, urban migrants often find themselves unable to secure stable, formal employment. This predicament forces many to resort to self-employment opportunities, such as opening grocery stores or small restaurants, as a means of sustaining their livelihoods. Thus, it can be argued that the Hukou system’s restrictions push urban migrants towards self-employment. To examine this explanation, we provide supportive evidence following the Hukou reform in 2014. We find that the change of urban migrants’ Hukou status as a result of external policy intervention can facilitate their access to find jobs in formal sectors. This finding implies that the preference for self-employment among urban migrants may not be intrinsic but rather a response to systemic exclusions. Consequently, upon acquiring urban Hukou status, these individuals are more likely to abandon self-employment in favour of seeking stable, contractual employment within formal sectors. This shift underscores the profound impact of policy reforms on the employment trajectories of urban migrants and highlights the potential for inclusive policies to integrate this demographic into the formal labour market.
In addition, our further heterogenous analysis indicates the different motivation of self-employment within high-income and low-income urban migrant groups, particularly in response to the 2014 Hukou reform. We find that high-income migrants are not as sensitive as low-income migrants to the 2014 Hukou reform. High-income migrants may expect that self-employment can yield higher returns, motivating their willingness to pursue entrepreneurial endeavours. Conversely, low-income migrants are more prone to resorting to self-employment as Hukou restrictions impede their ability to secure formal employment opportunities. The rest of the paper is structured as follows. The next section explains the background on the Hukou system and the Hukou reform followed by a discussion of related literature. Next, the China Family Panel Studies (CFPS) dataset and our empirical strategy is described after which we present evidence of the self-employment decision. We then consider an alternative concern in addition to our main finding, followed by our conclusions and policy considerations.
Institutional background
The officially restrictive Hukou system was enforced in 1958. This system was perceived as a dominant strategy aimed at maintaining population imbalances between rural and urban areas to foster industrialisation (Wang et al Reference Wang, Milner and Scheffel2021). In 1952, China had adopted a central strategy that prioritised heavy industry which was capital-intensive and so required a relatively smaller workforce. Most heavy industrial factories were concentrated in urban areas, so the labour mobility between urban and rural areas was restricted to reinforce the priority of industrial development. At that time, the Hukou system was launched to prevent rural-to-urban migration. During this period, state welfare programmes were tied to Hukou status, so rural residents became victims of Hukou restriction. For instance, rural peasants were excluded from the Chinese rationing system, where only urban citizens were allocated grain coupons to purchase staple food at a state-regulated price. In contrast, rural citizens were left to rely on self-sufficiency without any form of insurance or social support (Liu Reference Liu2005). Furthermore, other manifestations of inequality were evident in terms of educational opportunities, employment prospects, and welfare coverage.
Since the 1980s, in a strategic shift from a centrally planned to a market-oriented economy, the Chinese government has embraced open-market principles, spurring unprecedented growth in various industries. Various industries experienced remarkable growth during this period. Given the expanding amount of business, high labour liquidity between rural areas and urban areas is required to satisfy the surging demand for labour. To this end, a series of Hukou reforms were implemented to promote labour mobility. One such attempt was the introduction of the Temporary Residence Permit in Shenzhen city in 1984. This official population registration issued by local authorities allowed outside workers to conduct business or seek jobs in the city. Not surprisingly, since the late 1990s the Hukou reform emerged as a prominent focal point for policymakers. For example, in June 1997, the State Council started to conduct a pilot scheme for the reform of the Hukou system in small towns. This initiative provided urban migrants who found jobs or acquired real estate with the chance to apply for a regular permanent Hukou in these small towns. Subsequently, in March 2001, the State Council no longer imposed a quota on the allocation of non-agricultural Hukou to individuals with permanent residence in small cities and towns (Chen Reference Chen2019). Table 1, compiled by Chan (Reference Chan2012) from Chinese Statistical Yearbook and China Population Statistical Yearbook, provides supporting evidence regarding the background of the Hukou system. Overall, the table demonstrates that the percentage of urban migrants remained relatively stable before 1980 but increased rapidly from 1980 to 2000. Prior to 1980, the ratio of migrants in urban areas experienced slight fluctuations, declining from 12.21% in 1970 to 10.92% in 1975 but subsequently returned to 12.23% in 1980. It suggests limited population movement from urban to rural areas due to the Hukou restriction. However, between 1980 and 2000, the figure had a substantial increase, reaching 29.75% in 2000. It indicates that the relaxed Hukou system during that period allowed more people to migrate from rural to urban areas. Additionally, the highest growth rate of the migrant population in urban areas occurred from 1995 to 2000, with a rate of 10.02%.
China’s urban migrants percentage various year

Despite significant efforts by policymakers to establish an equitable labour environment, the division between urban and rural households entrenched by the Hukou system has persisted. Discriminatory policies against migrants, including wage discrimination and changes in residents’ employment decisions, continue to be prevalent (Meng Reference Meng2012). Since the 2000s, the Hukou reform that aimed to relax the stringent Hukou restrictions has been initiated and implemented in small cities, but the scope of this reform was limited. In 2014, comprehensive and far-reaching Hukou reform was introduced and implemented nationwide in China. The Chinese government announced an official document named Opinions on Further Promoting Reforms of The Household Registration System in July 2014 (State Council of China 2014). It marked a significant shift in Chinese labour market. The objective of the reform was to relax Hukou restrictions in order to finally narrow the gap between urban migrants and urban citizens. In this official document, the state provided urban migrants with a series of opportunities to settle down in cities and convert their Hukou. For instance, people whose spouse or children have an urban Hukou can also apply for the urban Hukou in the same region to reunite with their families. So, the Hukou reform made it easier for urban migrants to acquire an urban Hukou. On a national scale, approximately 179 million urban migrants have been directly impacted by this reform (An et al Reference An, Qin, Wu and You2024). Plenty of anecdotal evidence can also confirm the substantial impact of the 2014 Hukou reform. In an interview on 17 December 2014, Mr. Jiang Li, a 48-year-old Police Officer at the Household Registration and Certification Centre of the Public Security Bureau in Urumqi City, noted he has been engaged in household registration management for over two decades. He has witnessed a remarkable change after the 2014 Hukou reform, as the number of urban Hukou applicants processed per day has increased significantly from just one applicant every 45 days to now approximately 700 applicants per day. Mr. Jiang Li’s experience provides a micro-level perspective that highlights the positive outcome of the 2014 Hukou reform, reflecting the broader success of the reform in facilitating urban Hukou acquisition for a larger number of urban migrants.Footnote 1
From the unique context of the Hukou system and Hukou reform, this study aims to explore the decision patterns of urban migrants and the labour allocation affected by these discriminative policies. By examining the labour market dynamics, we aim to gain a deeper understanding of how urban migrants make their employment choices under Hukou system.
Literature review
The Hukou system and social development
The first related strand of literature is the relationship of Chinese segregated labour market and social development, including large studies which have examined the impact of the Hukou policy on labour market outcomes. Based on Shanghai microdata, the wage gap between urban residents and urban migrants caused by discrimination is approximately 50.82% (Meng and Zhang Reference Meng and Zhang2001). Whalley and Zhang (Reference Whalley and Zhang2007) argue that the labour restrictions by the Hukou system block the optimal allocation of resource in China. Chen (Reference Chen2019) argues that Hukou system is in fact a neutral system that has boosted the urban–rural inequality in the market economy period, although it had lessened inequality during the central planned economy period. Wang et al (Reference Wang, Milner and Scheffel2021) draw on land expropriation as a quasi-experiment to examine the impact of Hukou change from rural to urban areas on wage difference. Other scholars hold a different view about the Hukou system. Liao and Zhang (Reference Liao and Zhang2021) estimate that household heads who hold rural Hukou are approximately 20 percentage points less likely to own housing units in cities compared to household heads who hold local urban Hukou. Yang and Guo (Reference Yang and Guo2022) emphasise that the impact of employment sectors (formal sector or informal sector) on migrants’ decision to settle down has become less significant.
Our paper contributes to the existing literature on the impact of the Hukou system on the labour market in China by focusing on the specific labour transition process from contractual work to self-employment. By examining this transition pattern, we shed light on the dynamics and implications of the Hukou system on employment outcomes. Our findings indicate that the Hukou system has had a significant impact on employment choices, leading to a higher proportion of self-employed among urban migrants. We also provide evidence that the Hukou reform has played a role in attenuating this labour transition pattern. Following the enactment of the Hukou reform in 2014, there has been a noticeable shift among urban migrants towards employment in formal sectors, facilitated by their acquisition of urban Hukou. By focusing on the labour transition process under the Hukou system, our study expands the scope of labour market outcomes beyond wage considerations. We highlight the importance of considering employment type decisions in order to better understand the broader labour market dynamics in China.
The Hukou system and migrants’ welfare
Previous works have emphasised the adverse impact of the Hukou system on urban migrants’ welfare. The rural–urban comparison demonstrates that access to education and returns to education are unequal between rural and urban residents (Liu Reference Liu2005). Afridi et al (Reference Afridi, Li and Ren2015) estimate the impact of Hukou status on urban migrants’ performance of tasks by conducting a field experiment. They found that the relative performance of migrant students is worse than that of their local counterparts when their Hukou identification is evident. Chen et al (Reference Chen, Lu and Zhong2015) suggest that the Hukou system leads to a low consumption rate in China, since it distorts urban migrants’ consumption structure. Long et al (Reference Long, Han and Liu2020) find that the initial health advantage among urban migrants is attributed to self-selection instead of the migration effect, and urban migrants are more likely to return after their health deteriorates.
In addition, several studies focus on the rural-to-urban migration in China, reflecting migrants’ rights to pursue their desired life. Zhao (Reference Zhao1999) establishes a theoretical model to explain the determinants of rural-to-urban migration including the shortage of farmland and rural taxation. Zhao (Reference Zhao1999) also suggests that income for migrants is transient and temporary for migrants. Zhang & Song (Reference Zhang and Song2003) find rural-to-urban migration is motivated by the income gap, as the prospect of higher wages in urban regions served as an incentive for migrants. Conversely, some migrants are prevented by the geographic distance from their intended destinations. Dustmann et al (Reference Dustmann, Fasani, Meng and Minale2023) suggest that decisions regarding rural-to-urban migration are made at the household level in China, and the distribution of risk attitudes within households can play a significant role in shaping these migration decisions. Garriga et al (Reference Garriga, Hedlund, Tang and Wang2023) suggest that the increasing house prices restrict rural–urban migration and further hinder China’s transition process.
Our article provides insight into the employment decision-making processes of urban migrants, highlighting their inherent rights to choose their own careers. Our paper finds that the Hukou system poses barriers for urban migrants in attaining formal sector employment, which often drives them towards self-employment as an alternative. The barrier is due to the difference between rural and urban Hukou statuses, which results in unequal access to employment benefits.
Hukou reform and migration cost
This work also builds on a new but growing literature that studies the Hukou reform and the reduction in migration costs in China. Kinnan et al (Reference Kinnan, Wang and Wang2018) compare the time-varying Hukou reform with a Chinese historic event., ‘the sent-down movement’, in order to rule out time-invariant shocks; they find that access to migration can lower migrants’ consumption volatility and asset holdings. Tombe and Zhu (Reference Tombe and Zhu2019) suggest that reduction in migration costs is responsible for nearly two-fifths of the overall improvement in labour productivity in China. Hao et al (Reference Hao, Sun, Tombe and Zhu2020) find that the reduction of internal migration costs caused by Hukou reform in China substantially contributes to economic growth, labour reallocation, and income convergence among provinces. Wang et al (Reference Wang, Milner and Scheffel2021) argue that the Hukou reform makes the Chinese labour market less rigid, causing a higher employment adjustment based on firm-level data. One closely related work is Li (Reference Li2022), which also examines the Hukou reform of 2014 as a policy-induced shock. Li’s study investigates the impact of the 2014 Hukou reform on return migration to rural origins, finding a more rapid decrease of migrants’ return migration in major cities (population above 5 million) compared to smaller cities (population below 5 million). Our study also takes advantage of the 2014 Hukou reform and shares a focus on individual-level data. But there are several differences between Li’s work and ours. First, the aim of Li’s work is to assess the effectiveness of the 2014 Hukou reform, but our intention is to employ the reform as an external shock to show the high self-employment rate among urban migrants is due to the Hukou restriction. Second, Li’s work exclusively targets urban migrants, whereas our study focuses on comparing urban migrants with local citizens. Finally, Li’s study employs city-level fixed effects, whereas our paper uses county-level fixed effects, drawing from the availability of detailed CFPS microdata.
Our study seeks to advance the understanding of Hukou reform and migration costs. Most urban migrants face obstacles in accessing state sectors or other high-income industries due to high migration costs. Hukou reform plays a pivotal role in reducing migration costs and expanding work opportunities for urban migrants. Our findings show that the 2014 Hukou reform provided a wider range of work opportunities for urban migrants, who also have tended to work in formal sectors rather than continue their self-employment after the 2014 Hukou reform.
Migrants’ self-employment choice
Our study aligns with an emerging strand of literature that highlights urban migrants’ self-employment choices in China. Several works use datasets of urban migrants, shedding light on how the characteristics of urban migrants, including working experience, training, and education, affect their decisions to engage in self-employment (Meng and Zhang Reference Meng and Zhang2001; Wang et al Reference Wang, Milner and Scheffel2021). We add to this literature by comparing urban migrants and urban citizens, a departure from the previous focus only within the urban migrants group.
In addition, Djankov et al (Reference Djankov, Qian, Roland and Zhuravskaya2006) distinguish two types of self-employment by their incentive called self-employment by opportunity and self-employment by needs in China. The former strives for potential business opportunities, but the latter one is passive due to the labour market imperfection in developing nations. Mohapatra et al (Reference Mohapatra, Rozelle and Goodhue2007) further find that the rise of self-employment in China’s rural economy reflects a development of entrepreneurship rather than less productive informal employment by analysing the occupational trajectories. We instead find that the rise of self-employment is mainly driven by the discriminatory labour markets in China, by studying the Hukou reform in 2014.
Such findings are not limited to the labour market in China. Another close work by Borjas (Reference Borjas1986) finds that international immigrant cohorts in the United States are more likely to be self-employed than native-born workers with similar working skills. However, Borjas (Reference Borjas1986) also highlights geographic enclaves of immigrants as the mechanism for the positive relationship. Given several similarities between international immigrant cohorts in the United States and urban migrants in China, we establish a novel mechanism to link this relationship with the discriminatory labour market.
Data and methodology
Dataset
This paper relies on the CFPS dataset funded by Peking University. The CFPS dataset tracks 16000 recorded families from 162 counties in 25 provinces in 2010, 2012, 2014, 2016, and 2018, and it covers ample information of urban and rural populations in vast domains including education, employment, social network, and health status. By multistage stratified cluster sampling design, the CFPS dataset is representative of the changes in Chinese society. This research data contains the whole waves of CFPS from 2010 to 2018. Because this article focuses on the labour transition from rural to urban areas, we exclude data regarding those who remain in rural areas.
Our dataset has two primary merits. First, the CFPS dataset provides comprehensive data on various dimensions of individuals in China. This rich dataset contains social-economic background information, Hukou status, marriage status, health condition, and social coverages. We can take advantage of the extensive data to conduct a series of tests to gain insights into our research objectives. Second, the CFPS dataset is an ongoing project that spans five years: 2010, 2012, 2014, 2016, and 2018. The panel design provides dynamic individual information and household information, so we can capture the self-employment difference before and after 2014 Hukou reform. Moreover, the longitudinal nature of the CFPS data allows us to include both time fixed effects and county effects to control potential time-invariant confounding factors, including the initial investment of self-employment and network spillover effect.
Hukou status
The CFPS categorises Hukou status into two distinct classifications: agricultural Hukou (Rural Hukou) and non-agricultural Hukou (Urban Hukou). The CFPS systematically documents the Hukou status of each individual in 2010, 2012, 2014, 2016, and 2018. Specifically, we assign a value of 1 to the Hukou status of individual i if the CFPS records that i possesses an agricultural Hukou and a value of 0 otherwise.
Self-employment choice
The key explanation variable is self-employment choice, derived from a set of self-reported questions about the employment status in CFPS. The CFPS reports the employment status in two dimensions: (1) agricultural or non-agricultural employment, (2) working for himself/herself or employed by others/organisations. Broadly, both agricultural and non-agricultural work for himself/herself can be considered as self-employment. However, our focus is specifically on non-agricultural self-employment in urban areas, excluding agricultural work in rural regions. So, our self-employment variable is based on the second category. If individual i works for himself/herself at time t, we treat this person as self-employed (
 $SEm{p_{i,t}}$
= 1). If one individual i works for others/organisations at time t, we treat this person as employed (
 $SEm{p_{i,t}}$
= 0). Formally, we define self-employment in this study as an individual engaged in non-agriculture business without an employer. For individuals not classified as self-employed, they work for employers or private organisations.
Control variables
We add several individual characteristic controls including gender, age, education, health, marriage, and party. Gender is represented as a dummy variable with male coded as 1 and female coded as 0. Education denotes the number of years of formal education received by the individual. Health is a self-reported score ranging from 1 to 5, reflecting the current health condition from weak to strong. Party represents political identity, where 1 indicates membership of the Chinese Communist Party (CCP).
Statistical description
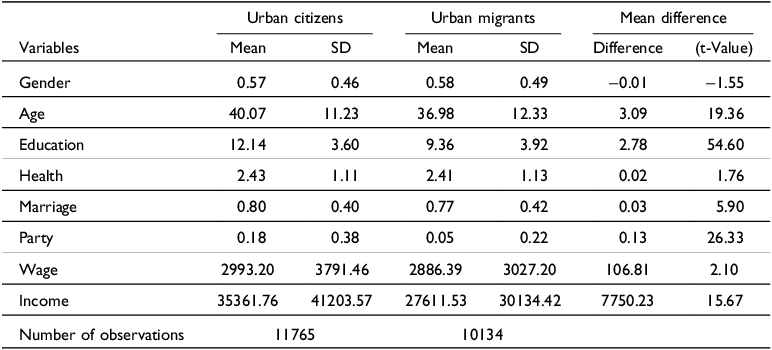
Table 2 presents the mean value and standard deviation of variables for urban citizens and urban migrants. The results show that gender is evenly distributed across both groups, suggesting the sample’s representativeness. Education, measured by schooling years, shows that urban citizens have a higher average education level than urban migrants, which is consistent with the limited educational resources available to migrants. The difference of Party reflects the low political participation rate of urban migrants, with only 4% joining the CCP, is noteworthy. As expected, the monthly wage and annual income differences show that urban citizens earn more on average than urban migrants.
Descriptive statistics
Specification
To examine the impact of Hukou policy on self-employment decisions, we first construct the model (1):
 $$P(SEm{p_{i,t}}) = \phi \left( {{\beta _0} + {\beta _1}Migran{t_{i,t}} + {\beta _2}{\boldsymbol X_i} + {\beta _3}{\boldsymbol Z_{i.t}} + {\mu _c} + {\gamma _t} + {\varepsilon _{i,t}}} \right)$$
where P(
 $SEm{p_{i,t}})$
is the probability of individual i being self-employed by individuals based on the Probit model. In this paper, self-employment is defined as an individual non-agricultural business without an employer.
 $Migran{t_{i,t}}$
is a dummy variable to show the status of Hukou, taking 1 for agriculture Hukou (urban migrants) and 0 for non-agriculture Hukou (urban local citizens).
 ${\beta _1}$
represents the interest of parameter.
The Probit model is well suited for our paper as it is specifically designed to study binary outcomes, including our self-employment decision variable. By using the Probit model, we explore how the Hukou status affects the probability of self-employment. In addition, the Probit model allows for capturing nonlinear relationships, providing a more flexible and accurate estimation of the impact.
A major challenge in identifying the impact of Hukou status on self-employment decisions is the potential confounding effect of education level. Previous studies suggest that urban migrants generally receive less education (Liu Reference Liu2005), which is supported by Table 2. It is likely that contractual work with higher entry barriers may be less accessible to urban migrants due to their lower educational attainment, rather than their Hukou status. Consequently, urban migrants may be compelled to pursue self-employment, leading to a spurious association between Hukou status and self-employment decisions. To mitigate this potential bias, we control the education year
 $\boldsymbol{Ed{u_{i.t}}}$
of the sample in the regression. In addition, the coefficient of urban migrants should be lower if the education level is excluded from the specification.
We also control for individual variables including
 $\boldsymbol{X_i}\;$
and
 $\boldsymbol{Z_{i.t}}$
.
 $\boldsymbol{X_i}\;$
is time-invariant and contains gender in this paper.
 $\boldsymbol{Z_{i.t}}\;$
is a set of time-variant demographic controls including age, marriage status, party, and health condition. Age can either positively or negatively affect self-employment decisions. On the one hand, greater working experience associated with ageing may increase the likelihood of entering self-employment (Kidd Reference Kidd1993). On the other hand, older people are generally described as more risk-averse and preferring stable contractual work. Consequently, both the linear and quadratic terms of age should be controlled. We also add
 ${\mu _c}$
and
 ${\gamma _t}$
as county fixed effects and year fixed effects, respectively, where c represents the county. The inclusion of county fixed effect allows for the control of all county-level time-invariant variables to mitigate the potential endogeneity.
In addition, we control county fixed effects rather than individual fixed effects. Chinese residents do not change their Hukou status frequently, implying no Hukou variance for an individual over years. If we control the individual fixed effect, it is likely that the relationship between Hukou status and self-employment decisions may not be observable due to the limited variation in Hukou status.
Empirical results
Baseline results
Table 3 depicts some preliminary evidence on the effect of Hukou status on self-employment decisions. We find that the urban migrants’ variable is robustly and positively associated with self-employment decision. Column (1) of Table 3 presents Probit model results without controlling education year. The coefficient of Migrants is positive and statistically significant, suggesting that urban migrants are more likely to be self-employed. In column (2), the result shows the change of coefficient of Migrants after adding the education control. The coefficient of Migrants reduces from 0.0462 to 0.0314, which suggests that lower education level is a heavy barrier for urban migrants to obtain a contractual job. Moreover, a significantly negative link between education year and self-employment in China implies that self-employment might not be considered as a high-ranked job class; hence, well-educated people are less willing to be self-employed.
Primary regression results
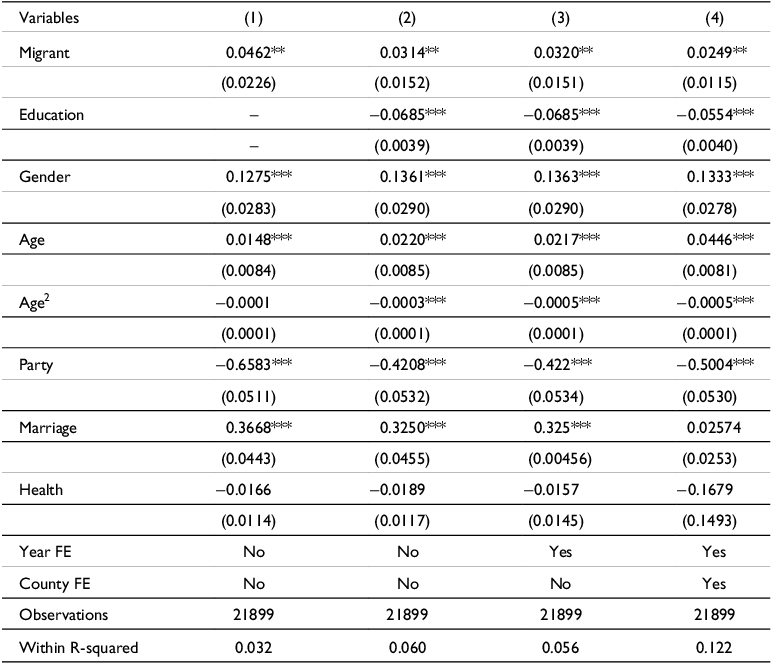
Note. The figures in brackets are standard errors clustering at the individual level, *, **, and *** indicate the significance level at 10%, 5%, and 1%, respectively.
In all columns, we keep demographic controls other than education level. We add year fixed effects and county fixed effects in column (3) and column (4), respectively. The positive relationship between Hukou and self-employment persists. The age term follows an inverted ‘U’ shape that is consistent with our expectations. In addition, after controlling the county fixed effect, the coefficient on Hukou declines drastically, which captures the potential network spillovers.
Hukou reform
The previous Probit model shows a positive relationship between Hukou status and self-employment. Following Zhang et al (Reference Zhang, Wang and Lu2019) and Li (Reference Li2022), we take advantage of the 2014 Hukou reform to further estimate the causal impact of Hukou restriction on self-employment. In this subsection, we aim to investigate the explanation that the positive relationship is driven by urban migrants’ negative response to Hukou restriction. The Hukou reform setting has two advantages. First, the reform is not motivated by changing urban migrants’ self-employment decisions. The objective of the Hukou reform is to mitigate inequality between urban citizens and urban migrants by granting local urban Hukou to eligible migrants. Hence, it can be treated as an external shock that is independent of individual characteristics, including personal preferences for self-employment. In addition, the Hukou reform has yielded significant outcomes. By 2016, the government had granted 28.9 million urban residency permits to migrants.Footnote 2 This achievement demonstrates significant progress facilitating the integration of migrants into urban areas.
The hypothesis of urban migrants’ negative response to Hukou restriction is that the Hukou system restricts urban migrants from finding jobs in formal sectors, so they are forced to be self-employed to survive. If this hypothesis holds, one would expect that contractual work will be a favourable alternative to self-employment for urban migrants. In other words, we can expect a negative impact on self-employment after the Hukou reform.
We establish the following difference-in-difference model to explore the impact of Hukou reform on self-employment:
 $$SEm{p_{i,t}} = {\alpha _0} + {\alpha _1}Migran{t_{i,t}} + {\alpha _2}Migran{t_{i,t}} \cdot Refor{m_t} + {\alpha _3}{\boldsymbol X_i} + {\alpha _4}{\boldsymbol Z_{i.t}} + {\mu _c} + {\gamma _t} + {\varepsilon _{i,t}}$$
where Reformt = 1 if the year t is after 2014. Given that the reform was initiated in July 2014, it is impossible to observe the immediate impact of such a reform within the same year. Thus, we treat the Reform in 2014 as 0. We focus on the interaction term
 $Migran{t_{i,t}} \cdot Refor{m_i}$
; this paper uses the linear model rather than the Probit model since the coefficient
 ${\alpha _2}$
can be explained more reasonably.
Panel A of Table 4 presents the DID results. In column (1) of Table 4, we keep the whole sample. The result shows the significantly negative reform effect on self-employment. More specifically, we find an approximately 5.98% decline in the self-employment decision among urban migrants compared to local citizens after the Hukou reform in 2014. The finding suggests that the state gave urban Hukou to urban migrants in the reform, making it easier for urban migrants to find contractual works in formal sectors. In addition, it is still hard to acquire the urban Hukou in megacities as the Chinese government often pays attention to population pressure in megacities. Thus, the Hukou reform was mainly implemented in small and medium cities. In order to concentrate on the impact in small and medium cities, we exclude the samples in megacities, including Beijing city, Shanghai city, and Guangdong province, and construct a subsample in column (2) of Table 4. The DID results remain consistent with the results in column (1) after removing megacities. It shows that our result is robust, and provides evidence that the Hukou reform performed well in small and medium cities in China.
DID estimation and common trend test

Note. The figures in brackets are standard errors clustering at the individual level, *, **, and *** indicate the significance level at 10%, 5%, and 1%, respectively.
The parallel trend is the key assumption in DID analysis. The average trends of self-employment before the Hukou reform ought to be parallel between urban citizens and urban migrants. In Panel B of Table 4, we interact the year dummy with the migrant variable and regress it on the dependent variable. The pre-reform coefficient is indistinguishable from zero, which shows no heterogeneous trend prior to the Hukou reform. The insignificant coefficient in the year 2016 implies the existence of a lagged effect resulting from the reform. The significantly negative impact of Hukou reform on self-employment is shown in 2018. The test results in column (2) when removing megacities also support the common trend assumption.
In addition, since the Hukou reform was executed at city level, we are concerned about the confounding effect from macro-level factors. We then introduce the city-year interactive fixed effects to better mitigate possible endogeneity. The results are detailed in Table 4. We find a significantly negative impact of the 2014 Hukou reform on self-employment choices for urban migrants. The absolute values of coefficients increase when we gradually add controls for city fixed effect and city-year fixed effect. The robustness check results confirm our results after the inclusion of city fixed effect and city-year fixed effect.
Possible threats to DID identification
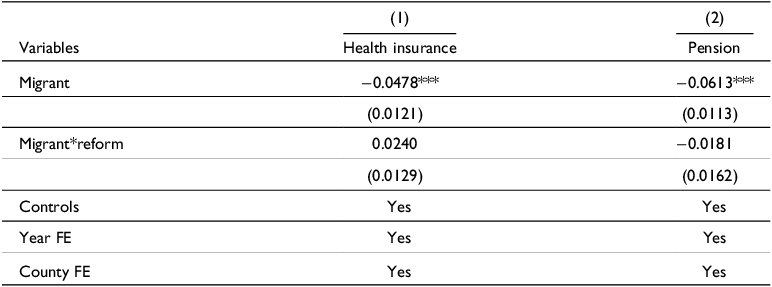
The 2014 Hukou reform expanded the coverage of public service to urban migrants in order to reduce the gap between urban citizens and urban migrants. Opinions on Further Promoting Reforms of The Household Registration System (2014) specified that the reform would grant urban migrants access to health insurance and pension benefits. One concern is that the results only reflect that urban migrants are less likely to be self-employed because the safety net can cover some of their life expenses; hence, their motivation to work decreases. To deal with this concern, we change the outcome variable from self-employment to health insurance and pension to examine the effect of Hukou reform on urban migrants’ safety net. Column (1) and Column (2) of Table 5 report the results. We do not find significant improvements in the safety net after 2014, as seen in the insignificant interaction term coefficients in Column (1) and Column (2). Thus, the concern that the observed effect of the safety net on self-employment is due to the Hukou reform can be ruled out.
Additional DID results
Further analysis
Quantile regression
Our previous results show that Hukou restriction confines urban migrants in the self-employment sectors. However, an important question remains: are all urban migrants equally constrained by the Hukou system, or does it yield varying effects? In this section, we focus on the income differences among urban migrants and investigate the heterogeneous effect of Hukou restrictions. We first concentrate on the subsample of urban migrants and conduct quantile regression to examine the relationship between wage and self-employment across different income classes of migrants:
 $$Ln{\left( {Income} \right)_{i,t}} = {\rm{\;}}{\delta _0} + {\delta _1}SEm{p_{i,t}} + {\delta _2}{\rm{\;}}{\boldsymbol X_i} + {\delta _3}{\boldsymbol Z_{i.t}} + {\mu _c} + {\gamma _t} + {\varepsilon _{i,t}}$$
where the dependent variable
 $Ln{\left( {Income} \right)_{i,t}}$
refers to the logarithm of average monthly individual income for urban migrants i in year t. If this explanation is accurate, we will expect
 ${\delta _1}$
is positive, which means urban migrants can earn more from self-employment compared with contractual work. Our sample size decreases to 3655 observations, since our focus is solely on the migrant group and the availability of wage data for migrants is limited.
Table 6 shows the wage difference between contractual work and self-employment by subsample of urban migrants. We adopt the logarithm of monthly wage to measure labour return as the dependent variable. Column (1) reports the results of the linear regression model. To show wage distribution and heterogeneity, the quantile regression model is also employed in columns (2) to (4). The quantile regression model enables the identification of varying wage differences resulting from different job classes at different wage levels.
Wage difference results

From column (1), the coefficient of self-employment in the linear regression estimation is significantly positive, which implies that self-employed people can earn a significantly higher amount of return than wage earners. The result supports the hypothesis that urban migrants’ desire to gain more money drives them to turn to self-employment. The results in columns (2) to (6) from the quantile regression model provide more detailed information about wage differences. It is notable that the coefficients of self-employment in column (2) and column (3) (10% and 25%, respectively, to show the low-level wage group) are negative and not significant. The results suggest that poorer people recognise that a change to self-employment cannot bring substantially higher earnings. Column (4) to (6) show a stepwise rise of the coefficients on the self-employment term, which suggests that middle-level and high-level income groups are more likely to earn more through self-employment.
The results show that wage-level urban migrant groups turn to self-employment for different reasons. High income drives middle-level and high-level income groups to turn to self-employment as the results in columns (4) to (6) show. However, poor people, who are sensitive to money, cannot gain higher income from self-employment. Hence, the evidence shows the possible different reasons for different groups to enter self-employment. Hukou restriction coerces the poor group to turn to self-employment passively. However, middle-level and high-level income groups actively decide to enter self-employment because they can possibly earn higher incomes from self-employment. Overall, poor people are often treated as second-tier citizens who are more likely to experience Hukou discrimination.
One may argue that the income structure of wage earners and self-employed persons is different, so they are not comparable. Labour is the only source of the return of wage earners, while the return of self-employment is obtained from their own labour and capital. Working capital in daily operation also contributes to the self-employed group’s profits. In order to ensure comparability, this paper also uses another measurement of return in CFPS as a robustness check: the annual income that includes property income. The annual income incorporates both labour income and property income, so the comparison of income is more reasonable. We replicate the model by using the annual income including property income and report the results in Table 6. Overall, the robustness check, using annual income that includes property income, provides additional evidence to support the main conclusion of the paper.
DID estimation of different income groups
To further investigate the heterogeneous impact of Hukou restrictions, we compare the reactions of different-income-level migrants to the Hukou reform. If a specific group of migrants turn to self-employment as a result of the Hukou restrictions while others turn to self-employment voluntarily, it is likely that each group responds to Hukou reform differently. In our context, we expect that low-income migrants are more sensitive to the Hukou reform compared with high-income counterparts, since we have shown the difficulty for the low-income group to achieve substantial earnings from self-employment. For migrants who engage in self-employment voluntarily, they may be less likely to quit self-employment after the Hukou reform, given their potential for significantly increased earnings through active pursuit of self-employment opportunities.
To estimate the heterogeneous effect of Hukou reform, we divide our sample into two groups: high-income class if their income is higher than the mean income and low-income class if their income is lower than the mean income. We then conduct the DID similar to the previous section to study the possible different reactions of Hukou reform.
Table 7 presents the results of the 2014 reform effect within high-income and low-income classes. Column 1 and column 2 in Table 7 report the results of the DID estimation for high-income and low-income migrants, respectively. We find that the interaction coefficient in Column 1 is negative but not statistically significant, whereas in Column 2, the coefficient is significantly negative. This result implies that the low-income urban migrants were more likely to exit self-employment after the 2014 Hukou reform, while the high-income migrants were not sensitive to the reform. These findings align with the results of the earlier quantile regression, indicating the different motivations for self-employment among high-income and low-income migrants.
DID estimation for subgroups

The different reaction could be attributed to rising incidence of entrepreneurs in China. High-income migrants, likely including entrepreneurs who are inherently more risk-taking, may engage in self-employment voluntarily to pursue higher returns through risky business ventures. This contrasts with low-income migrants who, constrained by Hukou restrictions, are unable to find a formal job and have to turn to self-employment as a mean for living.
Conclusion and policy implication
The Hukou system has played a pivotal role in shaping the Chinese labour market segmentation:, the Hukou system has also exerted a profound influence on labour market outcomes. This study examines the impact of Hukou policy on self-employment decisions using data from the CFPS dataset. Of particular interest are urban migrants who lack the urban Hukou but reside in urban areas. The findings show they are more prone to self-employment than urban citizens in the same area. This study then identifies an important mechanism to account for the higher self-employment rate among urban migrants. This paper uses the 2014 Hukou reform to show that the relaxation of Hukou restrictions leads fewer urban migrants to pursue self-employment. Indeed, the Hukou system erects substantial barriers for urban migrants in accessing contractual work, effectively compelling them to pursue self-employment as a viable alternative. In addition, higher income prospects from self-employment to motivate urban migrants to turn to self-employment; hence, they are not sensitive to the 2014 Hukou reform.
The self-employment caused by the Hukou system raises several important policy implications. We show that the Hukou system has squeezed migrant workers out of the formal employment sectors and pushed them towards self-employment. Future Hukou reforms are expected to strive to create equitable job opportunities and public service for both local citizens and urban migrants. For migrants who are involuntarily pushed into self-employment, it is crucial to ensure that employment in the formal sector is available since they still prefer such stable employment. In addition, we also find a difference in educational opportunities between urban migrants and local citizens, with urban migrants generally having lower education levels. This difference reveals the importance of addressing the skill gap and providing educational opportunities for urban migrants who intend to transition into formal sectors. For migrants who choose self-employment driven by its higher income, their self-employment decision should not be discouraged since they are more likely to engage in self-employment voluntarily. To provide a supportive and inclusive employment environment for this group of urban migrants, one approach is to provide them with stable residency. This would give them the assurance that they can reside in cities for an extended period, allowing their employment decisions to be based on factors beyond immediate returns.
Appendix
DID estimation with interactive fixed effect
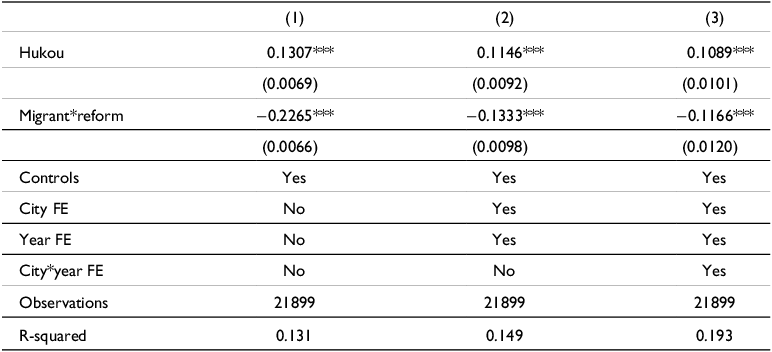
Note. The figures in brackets are standard errors clustering at the individual level, *, **, and *** indicate the significance level at 10%, 5%, and 1%, respectively.
Income difference results

Note. The figures in brackets are clustering at the individual level, *, **, and *** indicate the significance level at 10%, 5%, and 1%, respectively.
Chunyang Huang is a PhD student in Economics at University of Colorado, Boulder. His research interests include development economics, international trade and labour economics. His research mainly focuses on the causes and economic consequences of institutional change in emerging economies.
Wenxiu Ke is a Professor of Economics in the School of Marxism at Central South University. Her primary research area is national defense economics, with a particular focus on the connection between human capital investment, property rights theory and negotiation power.



