Premature culling remains a major challenge in the global dairy industry, leading to considerable financial losses, reduced genetic selection opportunities and heightened consumer concern over animal welfare, all of which can negatively affect the demand for dairy products (Miglior et al., Reference Miglior, Muir and van Doormaal2005). Longevity is a key performance trait of economic importance and is widely recognized as a global indicator of animal welfare (Pritchard et al., Reference Pritchard, Coffey, Mrode and Wall2013; Thomsen and Houe, Reference Thomsen and Houe2018; Adamie et al., Reference Adamie, Owusu-Sekyere, Lindberg, Agenäs, Nyman and Hansson2023; Akhtar et al., Reference Akhtar, Mehmood, Aziz, Andrabi and Riaz2023). By appropriately extending the productive lifespan, profitability can be increased by 10–15% (Gazzarin et al., Reference Gazzarin, Schmid and Bieber2025).
True longevity in dairy cows is generally defined as the animal’s ability to remain in the herd and avoid culling, regardless of the underlying reason. Longevity is a complex trait influenced by numerous factors, including milk yield, health status, reproductive performance, temperament and overall productive performance. Economic variables such as milk and carcass prices, feed costs, veterinary and breeding expenses, as well as the availability of replacement heifers, also play a critical role in determining a cow’s productive lifespan (Bascom and Young, Reference Bascom and Young1998; De Vries, Reference De Vries2013).
As a result, numerous definitions and methodologies have been developed to measure longevity. The definition and measurement of longevity vary among countries involved in dairy cattle genetic improvement programmes. Common indicators include age at last calving, number of lactations (NL) and length of productive life (LPL), which refers to the time from first calving to culling. Longevity may also be defined as herd life (HL), representing the duration from birth to culling or death. Additional measures include stayability (STAY), which reflects a cow’s ability to avoid culling, and survivability (SR), which describes the proportion of cows surviving to a specific point in time. SR is typically calculated by dividing the number of cows that have survived to a given time point by the number of cows in the opportunity group (Ducrocq et al., Reference Ducrocq, Quaas, Pollak and Casella1988; Yazdi et al., Reference Yazdi, Thompson, Ducrocq and Visscher1999; Brickell and Wathes, Reference Brickell and Wathes2011; Sasaki et al., Reference Sasaki, Takeda and Nishiura2018; Dallago et al., Reference Dallago, Wade, Cue, McClure, Lacroix, Pellerin and Vasseur2021).
In practice, genetic evaluations for longevity are routinely conducted in various countries using different definitions and methodologies. For example, in several European countries such as France, the Netherlands, Germany, Denmark, the Czech Republic and Italy, longevity is measured as length of productive life (der Linde C and de Jong, Reference der Linde C and de Jong2003). In the United States, productive life is defined as months in milk, recorded up to a maximum of 84 months but counted only up to 10 months per lactation, since records longer than 305 days are not stored (VanRaden and Wiggans, Reference VanRaden and Wiggans1995). In Canada, cow survival is recorded as binary traits at multiple time points: from first calving to 120 days in milk (DIM), 120 to 240 DIM, 240 DIM to second calving, survival to third calving and survival to fourth calving. These traits are evaluated using a multiple-trait linear animal model to account for genetic differences across these periods (Sewalem et al., Reference Sewalem, Miglior, Kistemaker, Sullivan, Huapaya and van Doormaal2007). In New Zealand and Australia, longevity is defined as the percentage of cows surviving from one lactation to the next (Schuster et al., Reference Schuster, Barkema, De Vries, Kelton and Orsel2020). Longevity as a genetic trait is generally considered to have low heritability worldwide. Heritability estimates for longevity traits range from 0.03 to 0.15 (Madgwick and Goddard, Reference Madgwick and Goddard1989; Vollema and Groen, Reference Vollema and Groen1997; Van Pelt et al., Reference Van Pelt, Meuwissen, De Jong and Veerkamp2015; Nejad et al., Reference Nejad, Kashan, Rokouei, Aminafshar and Faraji-Arough2021). Genetic correlations between longevity and other traits, such as production, conformation, health and fertility, are typically low to moderate (Zavadilova and Stipkova, Reference Zavadilova and Stipkova2012; Kern et al., Reference Kern, Cobuci, Costa, McManus and Braccini2015; Hu et al., Reference Hu, Mu, Ma, Wang and Ma2021). Given the low heritability of longevity and the fact that realized longevity, without the use of predictive or genomic information, becomes available only at the end of a cow's life, direct selection for these traits results in slow genetic progress (Cassell, Reference Cassell2009). Therefore, direct selection for longevity may in some situations be less effective than selecting for more heritable traits. Consequently, type traits, including conformation, health and reproduction-related traits, have been used as indirect indicators for longevity (Essl, Reference Essl1998; Sewalem et al., Reference Sewalem, Kistemaker and Van Doormaal2005; Miglior et al., Reference Miglior, Fleming, Malchiodi, Brito, Martin and Baes2017). This approach has led to multitrait evaluations that combine both direct and indirect measures, improving the effectiveness of genetic selection for longevity (Miglior et al., Reference Miglior, Fleming, Malchiodi, Brito, Martin and Baes2017).
In animal breeding, the genetic merit of future generations must be improved to achieve efficient production under evolving economic, environmental and social conditions (Groen et al., Reference Groen, Steine, Colleau, Pedersen, Pribyl and Reinsch1997). The economics of dairy cattle production require that the breeding objective facilitates optimal genetic progress toward a clearly defined economic goal. To establish a breeding goal, it is essential to know individual breeding values, their reliabilities, genetic correlations and economic values (EVs; Hazel and Lush, Reference Hazel and Lush1942). Therefore, an EV for survival is necessary to determine the optimal emphasis on this trait in selection relative to others, and to quantify the economic benefits of including survival in breeding programmes. EV, as defined by Hazel (Reference Hazel1943), represents the value of a one-unit improvement in a trait while keeping all other traits in the breeding goal constant. Previous studies have derived relative EVs for survival traits using bioeconomic modelling or through the first derivative of profit function methodologies (e.g. Van Arendonk, Reference Van Arendonk1991; VanRaden and Wiggans, Reference VanRaden and Wiggans1995; Wolfova et al., Reference Wolfova, Wolf, Kvapilik and Kica2007; Sadeghi-Sefidmazgi et al., Reference Sadeghi-Sefidmazgi, Moradi-Shahrbabak, Nejati-Javaremi, Miraei-Ashtiani and Amer2012; De Vries, Reference De Vries2017).
The simplicity and limitations of applied profit functions, combined with the complexity of bioeconomic models and differences in trait definitions, make it challenging to compare the economic importance of survival across countries. Therefore, the objective of this study was to describe a general and flexible approach for deriving EVs for survival to be used in selection indices. This approach can easily accommodate alternative definitions of survival traits and be applied across a wide range of production systems. As a case study, Iranian production and economic data were used to illustrate the calculations.
Materials and methods
This research investigated longevity using four major and practical definitions (LPL, HL, NL and SR) that are commonly employed in breeding programmes across various countries. Different strategies were designed and implemented to improve longevity.
Economic weights
This study analysed data on production, reproduction, lifespan and somatic cell score (SCS) collected between 2011 and 2021 from six dairy herds in two provinces (Isfahan and Chahar Mahaal en Bakhtiari) in Iran. Herds were selected based on their use of an accurate recording system (Livestock Management Software, Modiran). All farms participate in a systematic recording programme managed by the Animal Breeding Centre of Iran. Descriptive statistics summarized the production data and economic factors used here to derive EVs for the traits under consideration. Data extracted from the farm databases for each individual cow were: herd and cow identification, sire identification, lactation period, calving date, age at first calving (AFC), dry period length, 305-day milk yield, fat and protein percentage of milk. Data editing was performed to ensure reliability and consistency; hence, records with parity >7, AFC outside 19–38 months, dry period length outside 30–160 days, pregnancy period outside 240–295 days, and 305-d milk yield, fat and protein of milk outside three standard deviations from the mean were excluded from the analysis. Finally, after data editing, a total of 131,688 cows were used to calculate survival rates and estimate EVs. The parity structure of the herds showed that 35% of the cows were in first parity, 25% were in second parity, and 40% were in their third or more lactation periods.
The calculations accounted for current economic conditions, including an inflation rate of 46% and an interest rate of 24%. To ensure consistency, all prices and costs were converted from Iranian Rial (IRR) to US dollars using a conversion rate of 1 USD = 500,000 IRR. The mean values of production data, prices, and unit costs used for estimating EVs, along with the herd structure input parameters before and after the improvement in cow survival, are summarized in Tables 1 and 2, respectively.
Average biological and economic parameters used in the economic value calculations

Table 1 Long description
Biological and economic inputs used for economic value calculations are listed, grouped into biological and economic parameters. Milk production over 305 days increases by parity: 11,589 kg for parity 1, 13,122 kg for parity 2, and 13,639 kg for parity 3 plus. Live weight of culled cows also rises with parity, from 560.0 kg at parity 1 to 620.0 kg at parity 2 and 720.0 kg at parity 3 plus. Additional biological assumptions include a 420-day calving interval and 0.10 percent cows dying on farm. Economic assumptions include milk payment of 0.30 dollars per kg, NEL priced at 0.22 dollars per Mcal, MP priced at 0.62 dollars per kg, and cull cow price of 2.58 dollars per kg live weight. Replacement heifer cost is 797.03 dollars per heifer, average Breeding Worth trend is 15.00 dollars per year, and the interest rate is 0.24. Values are fixed averages intended as model inputs and may differ by herd, region, and time period.
Herd structure input parameters before and after improvement in cow survival

Table 2 Long description
Herd structure parameters are listed by parity one through six for a base herd and a herd with survival improved by one percentage point. Survival rate increases by 0.01 at every parity, from 0.700 to 0.710 in parity 1 and from 0.461 to 0.471 in parity 6. Lactation frequency is slightly lower in early parities with improvement, dropping from 0.364 to 0.357 in parity 1 and from 0.255 to 0.253 in parity 2, then slightly higher from parity 3 onward, rising from 0.181 to 0.182 in parity 3 and from 0.030 to 0.031 in parity 6. Lactation culling rate is generally reduced in the improved herd, for example 0.300 to 0.290 in parity 1 and 0.203 to 0.199 in parity 2, while parity 3 remains essentially unchanged at about 0.193. Salvage lactation culling rate follows the same pattern as culling, decreasing in parities 1 and 2, staying about the same in parity 3, and increasing slightly in later parities such as 0.083 to 0.087 in parity 5 and 0.081 to 0.088 in parity 6. Across both herds, survival rate and lactation frequency decline with increasing parity, while culling and salvage rates are lower in later parities than in parity 1. Values are rounded to three decimals, so very small differences may reflect rounding rather than meaningful change.
a Survival rate,
b lactation frequency,
c lactation culling rate, and
d lactation salvage rate.
Economic values of longevity traits
Approach overview
This method uses an economic model that characterizes the population structure of a dairy herd, establishing a close link between farm performance and profitability, both before and after genetic improvements in survival across successive parities. A general and adaptable framework is used here for estimating the EV of survival, suitable for incorporation into selection indexes. The approach has been widely used in commercial selection indexes for dairy cattle, beef cattle and sheep (Amer et al., Reference Amer, Simm, Keane, Diskin and Wickham2001, Reference Amer, Ludemann and Hermesch2014; Byrne et al., Reference Byrne, Santos, Amer, Martin-Collado, Pryce and Axford2017; Kerslake et al., Reference Kerslake, Amer, ONeill, Wong, Roche and Phyn2018), but the methodology has not previously been fully described in the scientific literature. Here it is shown that this approach can readily accommodate various definitions of survival traits and is applicable across diverse production systems. The model’s application is demonstrated through the estimation of EVs for multiple, interrelated definitions of cow longevity traits within Iranian dairy production systems. Unlike complex bioeconomic models or profit function derivative approaches, which have been commonly used in previous studies (e.g., Van Arendonk, Reference Van Arendonk1991; VanRaden and Wiggans, Reference VanRaden and Wiggans1995; Sadeghi-Sefidmazgi et al., Reference Sadeghi-Sefidmazgi, Moradi-Shahrbabak, Nejati-Javaremi, Miraei-Ashtiani and Amer2012; De Vries, Reference De Vries2017), the methodology presented here offers a novel and more flexible alternative.
Model description
Economic value of longevity traits
The EV of cow longevity (aL) was defined as the marginal change in herd profitability divided by the expected increase in a reference longevity trait, resulting from a specified percentage increase in survival probabilities across one or more parities. That is,
 \begin{equation}{{\text{a}}_{\text{L}}} = \frac{{\bar {\text{M}} * - {\bar {\text{M}}} }}{{\bar {\text{L}} * - {\text{L}}}}\end{equation}
where  $\bar {\text{M}} $ and
 ${\bar {\text{M}} ^*}$ are modelled herd average profitability per cow before and after genetic improvement in longevity, respectively. L and
 ${\bar {\text{L}} ^*}$ are the herd averages of any longevity or survival trait phenotype definitions before and after genetic improvement, respectively. Both profitability and survival are functionally dependent on herd structure before (h) and after (h*) genetic improvement. We first describe herd profitability as a general function of herd structure
 $\bar {\text{M}} {(h)^{}}$ as follows.
 \begin{equation}{\text{M}}\!\left( {\text{h}} \right){ } = \mathop \sum \nolimits_{{\text{i}} = 1}^{\text{n}} ({{\text{p}}_{\text{i}}}{{{\unicode{x03C0} }}_{\text{i}}} + {{\text{q}}_{\text{i}}}{{{\unicode{x03C9} }}_{\text{i}}}){\text{ - }}{{\text{p}}_1}{\text{RC}}\end{equation}
where  ${{\text{p}}_{\text{i}}}$ is the proportion of the breeding herd by parity i such that
 ${{\text{p}}_1}$ is the number of calving replacements required to maintain the herd at an equilibrium level,
 ${{{\unicode{x03C0} }}_{_{\text{i}}}}$ is the milk income after subtraction of variable per animal production costs in parity i. Variables
 ${{\text{q}}_{\text{i}}}$ and
 ${{{\unicode{x03C9} }}_{\text{i}}}$ are the proportion of the breeding herd that are culled and their average salvage value after accounting for on farm deaths respectively at the end of parity i, and RC is the total pre-calving cost to add a replacement first calving cow to the herd. Milk revenues, feed costs, and genetic merit, are the main factors that should be accounted for in the definition of
 ${{{\unicode{x03C0} }}_{_{\text{i}}}}$. In addition, nonfeed costs including mastitis, lameness, rebreeding and calving difficulty may also differ significantly between parities. These components can have partially offsetting effects on the overall benefits of having an older herd. Thus, the term
 $\mathop \sum \nolimits_{{\text{i}} = 1}^{\text{n}} {{\text{p}}_{\text{i}}}{{{\unicode{x03C0} }}_{\text{i}}}$ in equation 1 accounts for the net benefits accrued from having an increased average age in the herd as survival rate improves, but before any consideration of changes in herd replacement costs is made.
To calculate the marginal profit associated with cow survival, we derive the long-term equilibrium herd structure as a function of survival rates, following the approach of Amer et al. (Reference Amer, Simm, Keane, Diskin and Wickham2001). Industry-average survival rates (SR) from parity i to i + 1, up to a maximum of n parities, serve as the primary inputs for the herd structure model. For the purpose of this model, the survival rate at first (SR0) is defined as 1, reflecting that survival is modelled for cows that successfully begin their first lactation. These survival rates determine the equilibrium lactation frequency (LFi), which represents the age distribution of the milking herd across parities, as follows
 \begin{equation}{\text{L}}{{\text{F}}_i} = \frac{{\mathop \prod \nolimits_{j = 1}^i S{R_{j - 1}}}}{{\mathop \sum \nolimits_{{\text{i = 1}}}^n \left( {\mathop \prod \nolimits_{j = 1}^i S{R_{j - 1}}} \right)}}\end{equation}
which in turn drives, lactation culling rate (LCR) i.e. the proportion of cows in the average herd that exit from the herd after parity i,
 \begin{equation}{\text{LC}}{{\text{R}}_{\text{i}}} = { }\frac{{{\text{L}}{{\text{F}}_{\text{i}}} - {\text{L}}{{\text{F}}_{{\text{i}} + 1}}}}{{{\text{L}}{{\text{F}}_1}}}\end{equation}
The lactation salvage rate (SLCR) accounts for the proportion of exiting cows that die at each parity on farm as opposed to reaching slaughter (FD) (Farm Death) as follows;
 \begin{equation}{\text{SLC}}{{\text{R}}_{\text{i}}} = {\text{ LC}}{{\text{R}}_{\text{i}}}{ }\left( {1 - {\text{F}}{{\text{D}}_{\text{i}}}} \right)\end{equation}
The marginal increase in herd profit was calculated by comparing the above revenue and cost components for a herd with average industry survival rates (base herd before genetic improvement, SR) and a herd with improved survival rates (after genetic improvement SR* = SR + θ). The variables of LFi, LCRi and SLCRi are functions of survival rates and after genetic improvement can be shown as  ${\text{LF}}_{\text{i}}^{\text{*}}{\text{ = L}}{{\text{F}}_{\text{i}}}{ }\left( {{{\rm {SR}}, \theta}} \right)$,
 ${\text{LCR}}_{\text{i}}^{\text{*}}{\text{ = LC}}{{\text{R}}_{\text{i}}}{ }\left( {{{\rm {SR}}, \theta}} \right)$ and
 ${\text{SLCR}}_{\text{i}}^{\text{*}}{\text{ = SLC}}{{\text{R}}_{\text{i}}}{ }\left( {{{\rm {SR}}, \theta}} \right)$ which means they are a function of both base survival rates, SR, and the amount of genetic improvement in survival modelled (
 ${{\theta}}$). Using the above-mentioned variables, changes in the equilibrium herd age structure as a result of a genetic change in any survival trait of interest can be calculated and accounted for in the breeding objective.
Due to the flexibility of the proposed approach and depending on the cow survival definitions, it is possible to derive appropriate EVs for construction of economic selection indices. If the cow longevity trait is defined as lifetime (e.g. HL, productive life) in a breeding objective so that it is a trait expressed only once in the animals life, then the EV for the trait ( ${{\text{a}}_{\text{L}}}$) can be calculated as
 \begin{equation}{{\text{a}}_{\text{L}}} = \frac{{\sum\nolimits_{{\text{i = 1}}}^{\text{n}} {({\bar {\text{M}}} * - {\bar {\text{M}}} )} }}{{\bar {\text{P}} * - \bar {\text{P}} }}\end{equation}
Here, the EV, ${{\text{a}}_{\text{L}}}$, is in terms of the change in $ per cow per year from a 1 unit change in the per lifetime longevity trait, the breeding value for which might be expressed in days, months, or years so that
 ${\bar{P}^{*}}$ and P would correspondingly computed in days, months or years. Alternatively, if the longevity trait is expressed once per parity (e.g. survival rate to the next parity), then the EV for a 1% increase in cow survival (
 ${{\text{a}}_{{\text{SR}}}}$) can be calculated as
 \begin{equation}{{\text{a}}_{{\text{SR}}}} = \left[ {\bar {\text{P}} \times \frac{{\sum\nolimits_{{\text{i = 1}}}^{\text{n}} {({\bar {\text{M}}} * - {\bar {\text{M}}} )} }}{{\bar {\text{P}} * - \bar {\text{P}} }}} \right] - {{\text{R}}_{{\text{Adj}}}}\end{equation}
where  $\bar {\text{P}} $ and
 ${\bar {\text{P}} ^*}$ are average number of parities per cow in the base and survival-improved herd, respectively. The symbol n indicates the parity numbers over which profits are summed.
 ${{\text{R}}_{{\text{Adj}}}}$ is an optional rescaling adjustment to account for the fact that EVs are not always derived based on a fixed number of animals (e.g. Smith et al., Reference Smith, James and Brascamp1986). In the situation where feed energy available for dairy cows within the farm is limited, this rescaling adjustment could take the form of
 \begin{equation}{{\text{R}}_{{\text{Adj}}}} = \left( {\frac{{{{\text{E}}_{{\text{day}}}}}}{{{{\text{E}}_{\text{T}}}}}} \right) {\times {\text{wi}}}{{\text{r}}_{\text{\$ }}}\end{equation}
where  ${{\text{E}}_{\text{T}}}$ is average energy for cows during lactation weighted by parity across herd (Mcal);
 ${{\text{E}}_{{\text{day}}}}$is the per cow change in energy required across a weighted (by parity) herd after herd survival has been increased by 1 day (Mcal) and
 $wi{r_\$ }$ is weighted average Iran's net revenue over variable costs ($/cow).
If the cow survival trait is defined as the cow's ability to be retained within the herd, from parity 1 to 2 ( ${{\text{S}}_{{\text{12}}}}$), from parity 2 to 3 (
 ${{\text{S}}_{23}}$), from parity 3 to 4 (
 ${{\text{S}}_{24}}$), or from parity 4 to 5 (
 ${{\text{S}}_{45}}$) as five separate traits in the breeding objective, in this case, the EV for each trait (
 ${{\text{a}}_{{{\text{s}}_{{\text{ij}}}}}}$) can be calculated using equation 8 with a few changes. First, in the survival-improved herd, just for the trait of interest (
 ${{\text{S}}_{{\text{ij}}}}$), average industry survival rates will be improved by 5% (
 ${\text{SR}}_{{\text{ij}}}^{\text{*}}\,{\text{ = }}\,{\text{S}}{{\text{R}}_{{\text{ij}}}}{\text{ + }}{\text{5\% }}$) instead of 1% to avoid rounding error. Then, profit change per cow on a herd when survival ith to i + 1st lactation is improved by 1% per parity 1 cow (
 $\Delta {P_{{{\text{s}}_{{\text{ij}}}}}}$) should be calculated as
 \begin{equation}\Delta {{\text{P}}_{{\text{Sij}}}} = \frac{{0.01}}{{0.05}} \times \left[ {\mathop {\text{a}}\limits^ \circ \mathop {_{{\text{i}} = 1}^{\text{n}}({\bar {\text{M}}} * - {\bar {\text{M}}} )/L{F_1}}\limits^{} } \right]\end{equation}
where  ${\text{L}}{{\text{F}}_1}$ is proportion of cows exiting the herd from first parity which is equal to the herd annual replacement rate and the multiplication of 0.01/0.05 is needed to express profit change per 1% increase in the
 ${{\text{S}}_{{\text{ij}}}}$ trait. And finally, EV for each successive survival traits (
 ${{\text{a}}_{{{\text{s}}_{{\text{ij}}}}}}$) can be separately calculated as
 \begin{equation}{a_{{S_{{\text{ij}}}}}}{{ = \Delta }}{{\text{P}}_{{S_{{\text{ij}}}}}}{\text{ - }}{{\text{R}}_{{\text{Adj}}}}\end{equation}
Economic value of other traits
The bioeconomic model given in (Sadeghi-Sefidmazgi et al., Reference Sadeghi-Sefidmazgi, Moradi-Shahrbabak, Nejati-Javaremi, Miraei-Ashtiani and Amer2012) was used to estimate the EVs of the other traits, including production, reproduction and SCS. Probability of survival increased by a specified percentage across one or more parities. i.e.
 \begin{equation}{{\text{a}}_{\text{T}}} = \frac{{{{{\bar {\text{M}}} }^*} - {\bar {\text{M}}} }}{{{{\bar T }^*} - {\text{T}}}}\end{equation}
where  $\bar {\text{M}}\ $and
 $\bar {\text{M}} *$ are marginal herd profitability before and after genetic improvement in trait i, respectively. T and
 ${\bar {\text{T}} ^*}$ are the value of trait i before and after genetic improvement, respectively. The economic weights (EWs) of the traits were determined by multiplying the EV of each trait with cumulative discounted expression terms (CDEs) which adjust for difference in the timing of expression and the numbers of animals expressing different traits (e.g. Berry et al., Reference Berry, Madalena, Cromie and Amer2006).
Breeding objectives
To examine five alternative breeding goals (H) in the breeding programme of Iranian dairy cows, important economic traits milk yield (MY), fat yield (FY), protein yield (PY), days open (DO), SCS, productive life (PL), HL, number of lactation (NL) and survival rate (SR) were defined. H1 did not include any longevity trait; H2 included PL; H3 included HL; H4 included SR; and H5 included NL.
The aggregate genotype was defined for each of these breeding goals as follows:
 \begin{align*}
{\text{ }}{{\text{H}}_1} & = {\text{E}}{{\text{W}}_{{\text{MY}}}}{ }\left( {{\text{EB}}{{\text{V}}_{{\text{MY}}}}} \right) + {\text{E}}{{\text{W}}_{{\text{FY}}}}{ }\left( {{\text{EB}}{{\text{V}}_{{\text{FY}}}}} \right) + {\text{E}}{{\text{W}}_{{\text{PY}}}}{ }\left( {{\text{EB}}{{\text{V}}_{{\text{PY}}}}} \right)\\
& \quad + {\text{ E}}{{\text{W}}_{{\text{SCS}}}}{ }\left( {{\text{EB}}{{\text{V}}_{{\text{SCS}}}}} \right) + {\text{E}}{{\text{W}}_{{\text{DO}}}}{ }\left( {{\text{EB}}{{\text{V}}_{{\text{DO}}}}} \right)\\
{{\text{H}}_2}{ } & = {\text{E}}{{\text{W}}_{{\text{MY}}}}{ }\left( {{\text{EB}}{{\text{V}}_{{\text{MY}}}}} \right) + {\text{E}}{{\text{W}}_{{\text{FY}}}}{ }\left( {{\text{EB}}{{\text{V}}_{{\text{FY}}}}} \right) + {\text{E}}{{\text{W}}_{{\text{PY}}}}{ }\left( {{\text{EB}}{{\text{V}}_{{\text{PY}}}}} \right)\\
& \quad + {\text{ E}}{{\text{W}}_{{\text{SCS}}}}{ }\left( {{\text{EB}}{{\text{V}}_{{\text{SCS}}}}} \right) + {\text{E}}{{\text{W}}_{{\text{DO}}}}{ }\left( {{\text{EB}}{{\text{V}}_{{\text{DO}}}}} \right) + {\text{ E}}{{\text{W}}_{{\text{PL}}}}{ }\left( {{\text{EB}}{{\text{V}}_{{\text{PL}}}}} \right)\\
{{\text{H}}_3}{ } & = {\text{E}}{{\text{W}}_{{\text{MY}}}}{ }\left( {{\text{EB}}{{\text{V}}_{{\text{MY}}}}} \right) + {\text{E}}{{\text{W}}_{{\text{FY}}}}{ }\left( {{\text{EB}}{{\text{V}}_{{\text{FY}}}}} \right) + {\text{E}}{{\text{W}}_{{\text{PY}}}}{ }\left( {{\text{EB}}{{\text{V}}_{{\text{PY}}}}} \right)\\
& \quad + {\text{ E}}{{\text{W}}_{{\text{SCS}}}}{ }\left( {{\text{EB}}{{\text{V}}_{{\text{SCS}}}}} \right) + {\text{E}}{{\text{W}}_{{\text{DO}}}}{ }\left( {{\text{EB}}{{\text{V}}_{{\text{DO}}}}} \right) + {\text{ E}}{{\text{W}}_{{\text{HL}}}}{ }\left( {{\text{EB}}{{\text{V}}_{{\text{HL}}}}} \right)\\
{{\text{H}}_4}{ } & = {\text{E}}{{\text{W}}_{{\text{MY}}}}{ }\left( {{\text{EB}}{{\text{V}}_{{\text{MY}}}}} \right) + {\text{E}}{{\text{W}}_{{\text{FY}}}}{ }\left( {{\text{EB}}{{\text{V}}_{{\text{FY}}}}} \right) + {\text{E}}{{\text{W}}_{{\text{PY}}}}{ }\left( {{\text{EB}}{{\text{V}}_{{\text{PY}}}}} \right)\\
& \quad + {\text{ E}}{{\text{W}}_{{\text{SCS}}}}{ }\left( {{\text{EB}}{{\text{V}}_{{\text{SCS}}}}} \right) + {\text{E}}{{\text{W}}_{{\text{DO}}}}{ }\left( {{\text{EB}}{{\text{V}}_{{\text{DO}}}}} \right) + {\text{ E}}{{\text{W}}_{{\text{SR}}}}{ }\left( {{\text{EB}}{{\text{V}}_{{\text{SR}}}}} \right)\\
{{\text{H}}_5}{ } & = {\text{E}}{{\text{W}}_{{\text{MY}}}}{ }\left( {{\text{EB}}{{\text{V}}_{{\text{MY}}}}} \right) + {\text{E}}{{\text{W}}_{{\text{FY}}}}{ }\left( {{\text{EB}}{{\text{V}}_{{\text{FY}}}}} \right) + {\text{E}}{{\text{W}}_{{\text{PY}}}}{ }\left( {{\text{EB}}{{\text{V}}_{{\text{PY}}}}} \right)\\
& \quad + {\text{ E}}{{\text{W}}_{{\text{SCS}}}}{ }\left( {{\text{EB}}{{\text{V}}_{{\text{SCS}}}}} \right) + {\text{E}}{{\text{W}}_{{\text{DO}}}}{ }\left( {{\text{EB}}{{\text{V}}_{{\text{DO}}}}} \right) + {\text{ E}}{{\text{W}}_{{\text{NL}}}}{ }\left( {{\text{EB}}{{\text{V}}_{{\text{NL}}}}} \right)\end{align*}
Selection index scenarios
Different selection strategies incorporating the contrast breeding goals were compared for their ability to improve longevity in Iranian Holstein dairy cows. The selection indices used for these strategies were various combinations of production traits, reproduction, body cell score, lifespan and type traits. In order to determine the selection criteria for each index scenario, we modelled phenotypic recording scenarios of MY, FY, PY, SCS, DO, PL, PL, HL, SR and NL for bulls with 60 daughters using selection index theory. A total of 7 selection indices were considered to evaluate the effect of different longevity traits on the response to selection through indirect or direct selection based on heritabilities and their genetic correlations (Tables 3 and 4) used from a meta-analysis study of genetic parameters for longevity traits (Shokri Sangari et al., Reference Shokri Sangari, Sadeghi-Sefidmazgi and Ansari Mahyari2025).
The heritabilities of and production, longevity, type, somatic cell score and fertility traitsa

Table 3 Long description
Heritability estimates are listed for production traits, longevity traits, type traits, somatic cell score, and fertility traits. Production traits are moderate and similar: milk yield 0.23, fat yield 0.22, and protein yield 0.22. Longevity traits are lower, with PL 0.10, HL 0.08, SR 0.04, and NL 0.07. Somatic cell score is 0.11, between the production and most longevity values. Fertility-related measures vary widely: DO is the lowest in the table at 0.03, UD is 0.18, and DF is the highest overall at 0.27. Overall, most traits show low to moderate heritability, suggesting genetic selection may be more effective for DF and production yields than for DO. Values are single-point estimates and do not show uncertainty or differences by population or environment.
a Shokri Sangari et al. (Reference Shokri Sangari, Sadeghi-Sefidmazgi and Ansari Mahyari2025).
The genetic correlations between longevity traits and production, type, somatic cell score and fertilitya

Table 4 Long description
Genetic correlations are reported between three longevity traits and seven production, health, and fertility traits. Productive life has moderate positive correlations with milk, fat, and protein yields, and a negative correlation with somatic cell score and days open; it is also positively related to udder depth, while the value for dairy form is not reported. Herd life shows positive correlations with milk yield and especially protein yield, and it is positively related to days open and dairy form; values for somatic cell score and udder depth are not reported. Survival rate has small to moderate positive correlations with milk, fat, and protein yields and a negative correlation with somatic cell score; values for days open, udder depth, and dairy form are not reported. Overall, higher longevity tends to align with higher production, but some longevity measures also align with less favorable fertility as indicated by longer days open. Dashes indicate missing or unreported correlations, so comparisons are limited where values are absent.
a (Shokri et al., Reference Shokri Sangari, Sadeghi-Sefidmazgi and Ansari Mahyari2025)
In the first scenario, five different selection indices for longevity traits were developed based on direct selection on longevity traits assuming 60 daughters recorded and these were then compared based on genetic and economic selection differentials for the corresoinding aggregate genotypes predicted using selection index theory.
 \begin{align*}
{{\text{I}}_1} & = {{\text{b}}_{{\text{MY}}}}.{\text{MY}} + {{\text{b}}_{{\text{FY}}}}{\text{.FY}} + {{\text{b}}_{{\text{PY}}}}.{\text{PY}} + {{\text{b}}_{{\text{DO}}}}.{\text{DO}} + {{\text{b}}_{{\text{SCS }}}}.{\text{ SCS}}\\
{{\text{I}}_2} & = {{\text{I}}_1} + {{\text{b}}_{{\text{PL}}}}.{\text{ PL}}\\
{{\text{I}}_3} & = {{\text{I}}_1} + {{\text{b}}_{{\text{HL}}}}.{\text{ HL}}\\
{{\text{I}}_4} & = {{\text{I}}_1} + {{\text{b}}_{{\text{SR}}}}.{\text{SR}}\\
{{\text{I}}_5} & = {{\text{I}}_1} + {{\text{b}}_{{\text{NL}}}}.{\text{ NL}}
\end{align*}
For the second scenario, indicator traits were considered as selection criteria for improving longevity. Type traits (e.g., conformation, udder traits) have historically been used as indicators for longevity. Studies show that certain type traits correlate positively with longevity, although the relationships can be complex and sometimes nonlinear (Vollema and Groen, Reference Vollema and Groen1997; Strapák et al., Reference Strapák, Candrák and Aumann2005). type traits related to udder characteristics are the most important indicators of productive longevity in dairy cows. These traits show moderately to highly positive correlations with longevity, which increase as the cow ages. Cows with better udders and teats have a greater chance of avoiding early culling due to poor udder conformation or issues such as mastitis or injury (Vukašinović et al., Reference Vukašinović, Moll and Künzi1995). Therefore, type traits that are more heritable and easier to measure than longevity traits were examined using meta-analysis to determine the genetic correlation between existing type traits and longevity traits (Shokri Sangari et al., Reference Shokri Sangari, Sadeghi-Sefidmazgi and Ansari Mahyari2025). Two type traits with the highest genetic correlation with longevity traits are: fore udder (FU) with productive life and dairy form (DF) with the HL. These correlated type traits were taken into consideration as indirect selection criteria in indices I6 and I7:
 \begin{align*}
{{\text{I}}_6} & = {{\text{I}}_1} + {{\text{b}}_{{\text{FU}}}}.{\text{ FU}}\\
{{\text{I}}_7} & = {{\text{I}}_1} + {{\text{b}}_{{\text{DF}}}}.{\text{ DF}}\end{align*}
The values of b were derived from the formula  ${\mathbf{b}} = {{\mathbf{P}}^{ - 1}}{\mathbf{G}}\,{\mathbf{a}}$, where P is a t × t phenotypic (co)variance matrix of correlated traits where phenotypic variances and covariances based on the assumption of 60 daughter records per candidate sire, G is a t × m genetic covariance matrix for m traits in the breeding goal with t correlated traits in the selection index incorporating the additive genetic relationships between sources of information, and a is a m × 1 vector of relative economic weights for traits in the breeding goal. The predicted selection differential (SD) for a specific trait in the breeding goal was determined using standard selection index methods as outlined by (Dekkers, Reference Dekkers2003).
 \begin{equation*}{\text{P = }}\,{\mathbf{Record}}{\text{ }}{\mathbf{traits}}\,\,\mathop {\left[ \begin{gathered}
{{\sigma }}_{{\text{p1}}}^{\text{2}}\,\,\,{{{\sigma }}_{{\text{p}}\,\,{\text{1,2}}}}\,\,\ldots\,\,{{{\sigma }}_{{\text{p}}\,\,{\text{1,t}}}} \hfill \\
{{{\sigma }}_{{\text{p}}\,{\text{2,1}}}}\,{{\sigma }}_{{\text{p2}}\,}^{\text{2}}\,\,\,\,\ldots\,\,\,{{{\sigma }}_{{\text{p}}\,{\text{2,t}}}} \hfill \\
\,\,\ldots\,\,\,\,\,\,\ldots\,\,\,\,\,\,\,\ldots\,\,\,\,\ldots \hfill \\
{{{\sigma }}_{{\text{p}}\,{\text{t,1}}}}\,\,{{{\sigma }}_{{\text{p}}\,{\text{t,2}}\,\,}}\,\,\ldots\,\,\,{{\sigma }}_{{\text{p}}\,{\text{t,t}}}^{\text{2}} \hfill \\
\end{gathered} \right]}\limits^{{\mathbf{Record}}{\text{ }}{\mathbf{traits}}} \end{equation*}
 \begin{equation*}{\text{G }} = {\mathbf{Record}}{\text{ }}{\mathbf{traits}}{\text{ }}\mathop {\left[ {\begin{array}{*{20}{c}}
{{{{\sigma }}_{{\text{g}}1,1}}}&{{{{\sigma }}_{{\text{g}}1,2}}}&{\ldots}&{{{{\sigma }}_{{\text{g}}1,{\text{m}}}}} \\
{{{{\sigma }}_{{\text{g}}2,1}}}&{{{{\sigma }}_{{\text{g}}2,2}}}&{\ldots}&{{{{\sigma }}_{{\text{g}}2,{\text{m}}}}} \\
{\ldots}&{\ldots}&{\ldots}&{\ldots} \\
{{\text{ }}{{{\sigma }}_{{\text{g t}},1}}}&{{{{\sigma }}_{{\text{g t}},2{\text{ }}}}}&{\ldots}&{{{{\sigma }}_{{\text{g t}},{\text{m}}}}}
\end{array}} \right]}\limits^{{\mathbf{Profit}}{\text{ }}{\mathbf{traits}}} \end{equation*}
 \begin{equation*}{\text{C }} = {\mathbf{Profit}}{\text{ }}{\mathbf{traits}}{\text{ }}\mathop {\left[ {\begin{array}{*{20}{c}}
{{{{\sigma }}_{{\text{g}}1,1}}}&{{{{\sigma }}_{{\text{g}}1,2}}}&{\ldots}&{{{{\sigma }}_{{\text{g}}1,{\text{m}}}}} \\
{{{{\sigma }}_{{\text{g}}2,1}}}&{{{{\sigma }}_{{\text{g}}2,2}}}&{\ldots}&{{{{\sigma }}_{{\text{g}}2,{\text{m}}}}} \\
{\ldots}&{\ldots}&{\ldots}&{\ldots} \\
{{\text{ }}{{{\sigma }}_{{\text{g m}},1}}}&{{{{\sigma }}_{{\text{g m}},2{\text{ }}}}}&{\ldots}&{{{{\sigma }}_{{\text{g m}},{\text{m}}}}}
\end{array}} \right]}\limits^{{\mathbf{Profit}}{\text{ }}{\mathbf{traits}}} \end{equation*}
Here, the symbol σ2 denotes the variance of each trait, whereas σ represents the covariance between pairs of traits.
 \begin{equation*}{\mathbf{s}}\left( {{\boldsymbol{b'}}{\mathbf{G}}} \right)/\sqrt {{\mathbf{b}}'{\mathbf{Ga}}} \end{equation*}
where s is the selection intensity, assumed to be 1.4 (corresponding to the top 20% of selected sires), and b′ is the transpose of the selection index weight vector. The accuracy of a selection index was also calculated as described in (Dekkers JC, Reference Dekkers2003).
 \begin{equation*}\sqrt{{\mathbf{b}}'{\mathbf{Ga}}/{\mathbf{a}}'{\mathbf{Ca}}} \end{equation*}
Where a is a vector of economic weight for m traits in a breeding goal and C is a m × m genetic (co)variance matrix among the traits in the breeding goal.
Results
Economic values
EVs, genetic expressions and estimated EWs for each breeding objective trait are in Table 5. The CDE genetic expression for longevity traits was set at 0.13, a factor that significantly modulated their economic weights relative to their intrinsic EVs.
Economic values, genetic expressions and estimated economic weights for each breeding objective trait

Table 5 Long description
Breeding objective traits are listed with economic value per unit per cow per year, genetic expression, and the resulting economic weight per unit of trait. Milk yield has a small positive weight of 0.12 per kilogram, while fat and protein have much larger positive weights at 5.56 and 5.50 per kilogram. Fertility and health penalties are evident: days open is negative at minus 3.84 per day, and somatic cell score is the largest negative at minus 122.87 per unit. Longevity-related traits use a genetic expression of 0.13, reducing their economic weights relative to their economic values: productive life is 2.73 per month and herd life is 22.66 per year. Survival rate has a small positive weight of 0.18 per percent, and number of lactations is 37.59 per lactation. Comparisons across traits should consider that units differ and that genetic expression scales the economic value into the economic weight.
Longevity traits
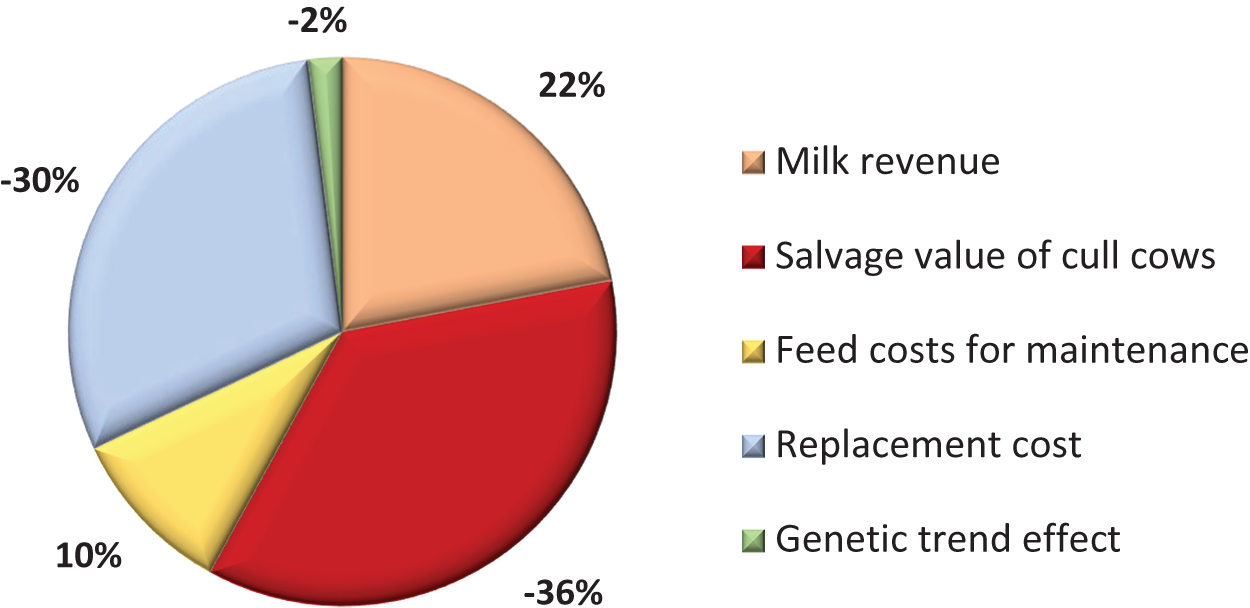
Change in key revenue and cost components in a herd before and after genetic improvement in cow survival rate across parities applicable to the estimation of EVs of longevity traits are presented in Table 6. Average profit per parity for longevity traits increased from \$1206.81 to \$1208.31 per cow per lactation when survival increased by 1% which finally led to a marginal change of \$1.50 per cow per lactation when each cow was expected to live 0.04 parities longer in the herd with improved survival. The economic weight for longevity traits (PL, HL, SR and NL) were \$2.73 month/cow/year, \$22.6 year/cow/year, \$0.18 percentage/cow/year and \$37.59 number/cow/year, respectively (Table 5). This contributed to the \$8.12 lower replacement costs per parity when survival increased. In addition, as shown in Table 6, when cow survival improved, it is expected to cause a reduction in the salvage value of cull cows and in the genetic trend effect while revenue from sales of milk, along with feed costs, would be increased. Relative contribution of different components to estimate EV for cow longevity traits under Iranian production systems are shown in Figure 1. Accordingly, the most important factor affecting the EV of longevity traits was the salvage value of cull cows (−36%). Replacement costs (−30%) and milk revenue (22%) were the next most important economic components related to cow longevity. The relative contribution of different components to estimate the EV for cow longevity is represented in Figure 1.
The relative contribution of different components to estimate economic value for cow survival under the Iranian production system.

Average biological and economic parity parameters in a herd before and after genetic improvement in cow survival rate across parities used in the economic value calculations

Table 6 Long description
Comparison of biological and economic parameters per cow per lactation for a base herd versus a herd improved for cow survival. Replacement rate decreases from 48.80 percent to 47.80 percent, and average parity rises from 2.05 to 2.09 lactations per cow. Milk revenue increases slightly from 3814.65 to 3825.49 dollars per cow per lactation. Salvage value of cull cows declines from 771.90 to 760 dollars per cow per lactation. Feed costs rise slightly from 2973.41 to 2978.44 dollars per cow per lactation, while replacement cost drops from 389.12 to 381.04 dollars per cow per lactation. The genetic trend effect is negative in both herds and becomes slightly more negative, moving from minus 17.21 to minus 17.70 dollars per cow per lactation. Differences are small overall, so interpretation should focus on the direction of change rather than large magnitude shifts.
Other traits
The EWs of MY, FY and PY were 0.12, 5.56 and 5.5 $/day/cow/year, respectively. The average EWs for DO and SCS were $-3.84 days/cow/year and $-122.87 units/cow/year (Table 5).
Selection index scenarios
As a result, in this study, the inclusion of four important traits of longevity (HL, PL, SR, NL) in the improvement goals was investigated and compared. This study explored the impact of selecting for different longevity traits in dairy cows, aiming to optimize both economic and genetic gains. Therefore, seven separate indices were designed, each of which focuses on a specific longevity attribute. The expected genetic and economic gains for each breeding objective trait using different selection indices are presented in Tables 7 and 8. Among the evaluated indices, I6 produced the most pronounced improvements. In particular, this index generated the highest expected genetic gains for milk yield (1202.86 kg) and protein yield (40.78 kg), together with the largest corresponding economic gains for the same traits. Furthermore, I6 achieved the greatest index accuracy (0.96), representing a marked improvement compared with the baseline index (I1), and yielded the highest total selection index response ($570 per unit gain). Regardless of direct or indirect selection for longevity, the total selection index response was generally higher if PL rather than other longevity traits was used in the selection index.
Expected genetic gains for breeding objective traits based on 7 selection indices, index accuracy,and total index response

Table 7 Long description
Expected genetic gains are listed for multiple breeding traits under seven selection indices labeled I1 through I7. Milk yield gains are similar for I1 to I5 and I7, ranging from 915.70 to 928.67 kg, but I6 is notably higher at 1202.86 kg. Fat yield gains are tightly grouped from 35.90 to 37.03 kg, with the highest value under I6. Protein yield gains range from 33.17 to 40.78 kg, again peaking under I6 and lowest under I2. Somatic cell score gains are small across all indices, from 0.03 to 0.06 units, with I6 lowest at 0.03. Days open gains range from 3.20 to 5.37 days, lowest under I2 and highest under I6. Additional longevity and fitness traits appear only in specific indices: productive life is reported for I2 at 4.07 months and I6 at 4.30 months; herd life is reported for I3 at 0.39 years and I7 at 0.36 years; survival rate appears only for I4 at 0.04 percent; number of lactations appears only for I5 at 0.10. Comparisons should be made within each trait because units differ by trait, and dashes indicate traits not included or not reported for that index.
a Traits included in indices: I1 (milk yield, fat yield, protein yield, somatic cell score and days open), I2 (milk yield, fat yield, protein yield, somatic cell score, days open and productive life), I3 (milk yield, fat yield, protein yield, somatic cell score, days open and herd life), I4 (milk yield, fat yield, protein yield, somatic cell score, days open and survival rate), I5 (milk yield, fat yield, protein yield, somatic cell score, days open, and number of lactations, lactation), I6 (milk yield, fat yield, protein yield, somatic cell score, days open and fore udder) and I7 (milk yield, fat yield, protein yield, somatic cell score, days open and dairy form).
Expected economic gains for breeding objective traits based on 7 selection indices, index accuracy and total index response

Table 8 Long description
Economic gains per unit change are listed for multiple breeding traits across seven selection indices, along with each index’s accuracy and total index response. For milk yield, gains are about 110 for indices I1 to I5 and I7, but rise to 144.30 for I6. Fat yield gains range from 200.60 in I1 to 209.20 in I6, and protein yield gains range from 182.40 in I2 to 224.30 in I6. Somatic cell score and days open show negative gains in every index, with somatic cell score from about minus 4.25 in I6 to about minus 7.23 in I4, and days open from about minus 11.12 in I2 to about minus 18.67 in I6. Additional traits appear only in specific indices: productive life is listed for I2 at 11.12 and I6 at 11.75; herd life is listed for I3 at 8.74 and I7 at 0.98; survival rate appears only in I4 at 0.01; number of lactations appears only in I5 at 3.76. Index accuracy is 0.89 for I1, I3, I4, I5, and I7, 0.90 for I2, and highest for I6 at 0.96. Total index response is lowest for I1 at 470, is 480 for I4, I5, and I7, is 490 for I2 and I3, and is highest for I6 at 570. Values are reported per unit trait change, so comparisons reflect relative weighting and included traits rather than direct predicted performance in a specific herd.
a Traits included in indices: I1 (milk yield, fat yield, protein yield, somatic cell score and days open), I2 (milk yield, fat yield, protein yield, somatic cell score, days open and productive life), I3 (milk yield, fat yield, protein yield, somatic cell score, days open and herd life), I4 (milk yield, fat yield, protein yield, somatic cell score, days open, and survival rate), I5 (milk yield, fat yield, protein yield, somatic cell score, days open, and number of lactations, lactation), I6 (milk yield, fat yield, protein yield, somatic cell score, days open and fore udder) and I7 (milk yield, fat yield, protein yield, somatic cell score, days open and dairy form).
Discussion
Economic weights
In designing a breeding strategy, it is important to clearly define traits and assign appropriate EVs to them. The EV of a trait refers to the contribution it has to the change in profit per unit change of that trait, assuming no changes in any other traits (Hazel and Lush, Reference Hazel and Lush1942). In practice, estimating the EV of longevity is challenging due to the influence of several factors and the absence of a universally accepted definition. As described by Rendel and Robertson (Reference Rendel and Robertson1950) and used by many researchers (e.g., Van Arendonk, Reference Van Arendonk1991; VanRaden and Wiggans, Reference VanRaden and Wiggans1995; Groen et al., Reference Groen, Steine, Colleau, Pedersen, Pribyl and Reinsch1997), improvement in cow longevity can enhance the profitability of a dairy farm by (a) decreasing annual costs for replacement of cows, (b) increasing the average milk production of the farm through an increase in the proportion of cows in the higher producing age group, (c) reducing the number of replacements to be reared and therefore allowing an increase in size of the milking farm for a given acreage.
The large variety of environmental, management and marketing circumstances for dairy farming have made it impossible to consider a unique definition for cow survival in selection indexes across the major countries undertaking dairy cattle genetic improvement. In such situations, complex bioeconomic models or first derivatives of profit function approaches have been widely applied (e.g., Van Arendonk, Reference Van Arendonk1991; VanRaden and Wiggans, Reference VanRaden and Wiggans1995; Sadeghi-Sefidmazgi et al., Reference Sadeghi-Sefidmazgi, Moradi-Shahrbabak, Nejati-Javaremi, Miraei-Ashtiani and Amer2012; De Vries, Reference De Vries2017). These approaches typically generate EVs specific to a country and for a single survival trait definition and are not capable of calculating EVs for longevity according to different definitions. This is important because genetic evaluation system research and development is increasingly testing reductionist definitions of longevity, whereby survival phenotypes are separated according to lactation number, stage of lactation and removal reasons (Veerkamp and van Pelt, Reference Veerkamp and van Pelt2019). The present proposed approach, focusing on herd structure, offers a flexible method for estimating the EV of various longevity traits, applicable not only to dairy cows but also to other production systems, incorporating different longevity traits. The main advantage of this approach is its flexibility in defining and calculating the EV of longevity based on various criteria. The EV of longevity can be calculated for cow survival traits defined explicitly according to lactation number, stage of lactation and even specific to removal reasons.
The average estimated EV for PL was $21/month/cow/year. This was adjusted using a CDE genetic expression coefficient of 0.13 to get an EW of $2.73/month/cow/year. In previous studies, Sadeghi-Sefidmazgi et al. (Reference Sadeghi-Sefidmazgi, Moradi-Shahrbabak, Nejati-Javaremi, Miraei-Ashtiani and Amer2012) reported an EV of $10.13/month for PL, and Nadri et al. (Reference Nadri, Sadeghi-Sefidmazgi, Zamani, Ghorbani and Toghiani2023) reported an EV of $2.77/month for PL, which was lower than the EV reported in this study. Komlosi et al. (Reference Komlosi, Wolfova, Wolf, Farkas, Szendrei and Beri2010) reported that the amounts varied between $0.12 and $1.52 per day across European nations. According to Cole and Van Raden (Reference Cole and Van Raden2010), the estimated EV for a productive life in the United States is $35 per month. (Sasaki et al., Reference Sasaki, Takeda and Nishiura2018) reported that the EW of PL ranged from $0.57 to $0.61 each day. The EW of SR was calculated by Byrne et al. to be $7.92/percentage/cow/year. For Japanese Holstein cattle, (Sasaki et al., Reference Sasaki, Takeda and Nishiura2018) reported an EW of SR ranging from $12.40 to $15.15 percentage/cow/year. The EW of SR in this study was 0.18 percentage/cow/year, which was significantly different from that in other investigations. These discrepancies can be attributed to the model that was used, changes in the management system assumptions, and different economic conditions around the world.
The estimated EVs for production traits in this study differed from those in prior investigations (Sadeghi-Sefidmazgi et al., Reference Sadeghi-Sefidmazgi, Moradi-Shahrbabak, Nejati-Javaremi, Miraei-Ashtiani and Amer2012; Ghiasi et al., Reference Ghiasi, Nejati-Javaremi, Pakdel and González-Recio2013; Nadri et al., Reference Nadri, Sadeghi-Sefidmazgi, Zamani, Ghorbani and Toghiani2023), even though the definition of the trait and the pricing method for milk yield were the same. Ghiasi et al. (Reference Ghiasi, Nejati-Javaremi, Pakdel and González-Recio2013) reported an EW for MY of $0.193/kg/cow/year; Sadeghi-Sefidmazgi et al. (Reference Sadeghi-Sefidmazgi, Moradi-Shahrbabak, Nejati-Javaremi, Miraei-Ashtiani and Amer2012) reported EVs of $0.15/kg/cow/year for MY, $1.36/kg/cow/year for FY and $−1.02/kg/cow/year for PY. Nadri et al. (Reference Nadri, Sadeghi-Sefidmazgi, Zamani, Ghorbani and Toghiani2023) reported EVs of $0.34/kg/cow/year for MY, $6.93/kg/cow/year for FY and $5.53/kg/cow/year for PY, in comparison with $0.12, $5.56 and $5.50, respectively. Variations in the price at which milk is sold as well as production expenses, such as labour and feed, account for the fluctuation in MY's EVs.
An EV of $-105.67/units/cow/year for SCS was reported by Sadeghi-Sefidmazgi et al. (Reference Sadeghi-Sefidmazgi, Moradi-Shahrbabak, Nejati-Javaremi, Miraei-Ashtiani and Amer2012) which is lower than the EV of $-122.87/units/cow/year found in this study. This discrepancy may be caused by the difference in the mean of the studied populations, because the EV of the SCS is strongly influenced by it. Compared to the EV of DO reported in this study ($-3.84/days/cow/year), Nadri et al. (Reference Nadri, Sadeghi-Sefidmazgi, Zamani, Ghorbani and Toghiani2023) reported an EV of DO of $-2.71/days/cow/year. The EV of DO was assessed from $3.59 to $7.72 in one Japanese study (Sasaki et al., Reference Sasaki, Takeda and Nishiura2020), which was very different from this study.
Selection index scenarios
The goal of dairy cattle breeding programmes worldwide was to increase milk yield over a long time. Dairy cattle breeding programmes focus has expanded over the last 20 years to include a greater variety of traits, such as longevity, reproductive efficiency, general health and functional traits (Miglior et al., Reference Miglior, Muir and van Doormaal2005; Kargo et al., Reference Kargo, Hjorto, Toivonen, Eriksson, Aamand and Pedersen2014). Longevity traits have many definitions. The challenge that exists is which of the traits describing lifespan as the basis of selection is more beneficial and useful. The analysis revealed a clear trend: the inclusion of any longevity trait into the breeding objectives improved the overall response compared to a baseline scenario that completely disregarded longevity. This points to the great economic and genetic gains to be realized with the selection of cows with longer longevity. In direct selection, I2 and I3 were the most interesting scenarios. These scenarios focused on directly selecting cows with a longer PL or HL. Both options resulted in favorable economic and genetic gains, which suggested that selection for these traits for longevity compared to selection for NL and SR traits allows achieving more genetic progress and is a good way to improve longevity. Direct selection for PL (I2) yields the highest genetic gain for MY, SCS and DO, and the greatest economic gain for MY compared to selection for HL, SR and NL. Selection based on HL (I3) provided superior economic and genetic improvement in terms of PY and highest economic gain for DO, Selection based on NL (I5) resulted in the highest genetic and economic gain for FY, and selection based on SR (I4) had the greatest genetic gain for SCS.
The direct selection for longevity is not common because realized longevity only becomes available at the end of the cow's life. An alternative to direct selection for longevity in dairy cattle is the use of indirect traits such as type traits and reproductive traits, which can serve as effective indicators for improving longevity (Essl, Reference Essl1998; Sewalem et al., Reference Sewalem, Kistemaker and Van Doormaal2005, Reference Sewalem, Miglior, Kistemaker, Sullivan and van Doormaal2008; Miglior et al., Reference Miglior, Fleming, Malchiodi, Brito, Martin and Baes2017; Hu et al., Reference Hu, Mu, Ma, Wang and Ma2021). Indirect selection on longevity traits was examined using I6 and I7. Scenario I6 employing indirect selection based on fore udder (FU) traits indicated the best response rate with high accuracy. This scenario focuses on productive life (PL) in the breeding target. Genetic and economic gains for traits in the breeding objectives were generally higher for I6 than I7. This scenario (I6) has been found to be the most economically beneficial strategy. Scenario I6, which includes fore udder (FU) data in the selection index and focuses on productive life (PL), resulted in the greatest overall improvement. This approach yielded desirable genetic gains for MY, FY, PY, PL and SCS, and desirable economic gains for MY, FY, PY, PL and DO. Our results support the relationship between udder structure and longevity observed in previous studies. Research consistently demonstrates positive and good correlations between specific udder traits and dairy cattle longevity. Specifically, fore udder length, rear udder attachment and the strength of the central ligament have been identified as key indicators of increased lifespan (Vukašinović et al., Reference Vukašinović, Moll and Künzi1995; Vacek et al., Reference Vacek, Stipkova, Nemcová and Bouska2006; Zavadilova and Stipkova, Reference Zavadilova and Stipkova2012). Cows with appropriate udder structure (strong fore udder attachments, high rear udder attachments and well-defined central ligaments) tend to have extended productive lives (Vacek et al., Reference Vacek, Stipkova, Nemcová and Bouska2006). Cows with shallower udders and stronger fore udder were more resistant to mastitis and thus were more easily able to avoid culling then these cows are more than survive (Gibson and Dechow, Reference Gibson and Dechow2018). These findings suggest that selection for these udder traits could contribute to improved longevity in dairy herds. this is probably because a proper udder structure leads to better udder function in milk production and greater resistance to diseases, which ultimately leads to increased longevity.
Conclusions
In this study: firstly describes a general flexible approach for the derivation of EV of cow survival with different definitions under a wide range of production systems not only for dairy enterprises but also for other livestock production worldwide., secondly It was shown that among the various definitions of longevity presented in this study, selection for productive life, especially indirect selection of the fore udder, in addition to improving longevity, also significantly improved production traits and SCS.
Acknowledgements
The authors would like to acknowledge the farm managers for generously providing us with the data for this study and Alireza Aghatehrani (Fodeh Sepahan Agriculture and Animal Husbandry, Isfahan, Iran) for their assistance in helping collect data from the farms. The authors gratefully acknowledge Peter Amer (AbacusBio Limited, Cargill House, 333 Princes Street, Dunedin 9016, New Zealand) for his valuable and helpful comments on the statistical analyses and assistance in editing the manuscript.