


Introduction
Insulin prices in the U.S. have increased dramatically over time; for example, prices more than doubled from the early 2010s to the late 2010s (Dickson et al. Reference Dickson, Gabriel, Gellad and Hernandez2023; Tseng et al. Reference Tseng, Masuda, Chen and Hartung2020). Price shocks of a lifesaving pharmaceutical have led to calls for innovation in production and delivery systems. Currently, in the U.S., almost all insulin is produced using recombinant DNA technology. Recombinant DNA technology involves combining genetic material from different sources to create new DNA sequences, which are then inserted into an organism to produce a genetically modified organism (GMO). While some studies indicate growing openness to biopharmaceuticals, others reveal ongoing hesitancy toward GMOs (Abdullah et al. Reference Abdullah, Laily and Othman2018; Liopa et al. Reference Liopa, Mankad and Stoneham2023; Parker et al. Reference Parker, Baxter and Boon2021).
Gene editing enables precise alterations to genetic material and may reduce unintended changes associated with earlier biotechnology approaches (Casacuberta and Puigdomènech Reference Casacuberta and Puigdomènech2018; Hendel and Bak Reference Hendel and Bak2023). A growing body of research suggests that gene editing, particularly CRISPR-Cas9, is often viewed more favorably than traditional GMO technologies, especially when consumers perceive direct benefits and limited risks (Farid et al. Reference Farid, Cao, Lim, Arato and Kodama2020; Meerza et al. Reference Meerza, Dsouza, Ahamed and Mottaleb2024; Paudel et al. Reference Paudel, Kolady, Just and Sluis2023; Son and Lim Reference Son and Lim2021; Vasquez et al. Reference Vasquez, Hesseln and Smyth2022; Yunes et al. Reference Yunes, Osório-Santos, Keyserlingk and Hötzel2021). Acceptance is also shaped by trust, scientific literacy, technology neophobia, and perceptions of naturalness (Critchley et al. Reference Critchley, Nicol, Bruce, Walshe, Treleaven and Tuch2019; Dawson et al. Reference Dawson, Paintsil, Bingaman and Brewer2022; Howell et al. Reference Howell, Wolfe and Scheufele2020; McCaughey et al. Reference McCaughey, Budden, Sanfilippo, Gooden, Li, Fenwick and Hewitt2019; Muringai et al. Reference Muringai, Fan and Goddard2020). These findings underscore the importance of communication and information framing in shaping public attitudes toward biotechnology (Krasovskaia et al. Reference Krasovskaia, Rickard, Ellison, McFadden and Wilson2024; Lukasiewicz et al. Reference Lukasiewicz, Wiel, Lotz and Smulders2024).
For clarity, the terms gene-edited (GE) and genetically modified (GM) are used throughout this study as they were presented to respondents in the survey instrument. Respondents were provided standardized descriptions of two insulin production systems prior to the choice experiment: insulin produced from transgenic dairy cattle and insulin produced using GM yeast or bacteria. The focus of this study is consumer acceptance of these alternative biotechnology-based production methods rather than the technical classification of the underlying genetic technologies.
In agriculture, GE technologies have gained attention for their potential benefits for animal welfare and sustainability. Kilders and Caputo (Reference Kilders and Caputo2021) found that consumers were more supportive of milk from GE cows when the technology was framed as promoting animal well-being. Similarly, McCluskey et al. (Reference McCluskey, Gallardo and Ma2025) reported that consumer responses were influenced by animal welfare considerations and the availability of information. These findings suggest that consumer acceptance depends not only on the technology itself but also on how its benefits are communicated (Halstead et al. Reference Halstead, Boehnke and Lewis2022; Leibrock et al. Reference Leibrock, Santegoets, Mooijman, Yusuf, Zuijdgeest, Zutt and Schaart2022; McFadden et al. Reference McFadden, Rumble, Stofer, Folta, Turner and Pollack2021).
Monzani et al. (Reference Monzani, Sangalli, Sampaio, Guemra, Zanin, Adona, Berlingieri, Cunha-Filho, Mora-Ocampo, Pirovani, Meirelles, Wheeler and Ohashi2024) demonstrated that transgenic cattle can produce human proinsulin and insulin in milk, providing a potential alternative pathway for insulin production. Proinsulin is the precursor molecule to insulin; it is synthesized in the pancreas and subsequently cleaved to form active insulin, which regulates blood glucose levels. However, as with all biotechnology innovations, consumer acceptance plays a pivotal role in determining market viability. Studies exploring consumer acceptance of GE insulin point to the importance of perceived safety, trust in regulatory institutions, and clear communication of therapeutic benefits (Cummings and Peters Reference Cummings and Peters2022; Ortega Reference Ortega2023; Shigi and Seo Reference Shigi and Seo2022). Additionally, cultural worldviews have been shown to shape consumer attitudes toward food technologies, including perceived risks and benefits of genetic modification (Kemper Reference Kemper2025; Kemper et al. Reference Kemper, Popp, Nayga and Kerr2018), underscoring the importance of perceived safety in shaping acceptance of GE pharmaceuticals.
This study compares consumer preferences for insulin produced using GE and GM production systems, focusing on willingness to pay, perceived safety, and affordability. As a lifesaving medication with no close substitute, insulin presents a unique setting in which affordability, accessibility, and acceptance of biotechnology intersect. While insulin derived from transgenic cow milk may reduce production costs, consumers may still express concerns regarding safety, ethics, and animal welfare (Delhove et al. Reference Delhove, Malard and Van Wonterghem2020; Halstead and Lewis Reference Halstead and Lewis2020).
This study contributes to the literature in three ways. First, it extends prior research on gene editing beyond agricultural food products by examining a high-salience pharmaceutical application in the U.S. healthcare context. Second, it isolates the relative roles of affordability and perceived safety in shaping acceptance of GE biotechnology. Third, directly comparing GE and GM insulin within the same experimental framework provides new evidence on how consumers differentiate between closely related biotechnology platforms. Because acceptance of biotechnology varies across regulatory and cultural contexts, evidence from U.S. consumers remains particularly important as gene-editing technologies expand into pharmaceutical applications (Farid et al. Reference Farid, Cao, Lim, Arato and Kodama2020; Son and Lim Reference Son and Lim2021; Vásquez et al. 2022). Results indicate that affordability is the dominant driver of consumer choice, while perceived safety helps explain heterogeneity in willingness to pay across respondents.
Data and methods
Survey design and data collection
The study protocol was reviewed and approved by the University of Arkansas Institutional Review Board (IRB# 2404536398), and informed consent was obtained from all respondents prior to survey participation. The data collected for this study were designed to approximate the demographic composition of U.S. adults diagnosed with diabetes (N = 395). The survey was administered via a professional consumer panel service. Quotas were applied for age, gender, and geographic region to better align the sample with the demographic characteristics of the U.S. diabetic population. The survey consisted of two components: a discrete choice experiment (DCE) to elicit preferences and estimate WTP, and follow-up questions to assess perceived safety, various attitudinal measures, and insulin use.
Because respondents were screened to include only individuals diagnosed with diabetes, the sample reflects the demographic composition of U.S. adults with diabetes rather than the general population. National statistics indicate that approximately 90–95% of U.S. diabetes cases are Type II, with prevalence increasing with age and being particularly high in the Southern United States (Centers for Disease Control and Prevention (CDC 2026). In our sample, 80.5% of respondents report Type II diabetes and 19.5% report Type I diabetes. The age distribution is concentrated among middle-aged and older adults, and 44% of respondents reside in the South. While Type I diabetes is somewhat overrepresented relative to national prevalence estimates, the sample broadly reflects several key characteristics of the U.S. diabetic population, including age distribution and regional concentration. Almost 40 million adults in the U.S. are diagnosed with diabetes. A sample size of 395 provides a margin of error of plus or minus 5% (CDC 2026).
Because insulin prices in the United States vary substantially by insurance coverage and co-pay structures, the price attribute in the discrete choice experiment was framed as the respondent’s out-of-pocket cost. Respondents were instructed to assume that the displayed price reflected the amount they would personally pay. While insurance type and coverage may influence real-world price exposure, the experimental design isolates stated sensitivity to out-of-pocket cost, allowing for consistent comparison across respondents.
Discrete choice experiment and survey
All respondents were presented with brief background information on current insulin production methods using GM yeast or bacteria, as well as the GE technology described in Monzani et al. (Reference Monzani, Sangalli, Sampaio, Guemra, Zanin, Adona, Berlingieri, Cunha-Filho, Mora-Ocampo, Pirovani, Meirelles, Wheeler and Ohashi2024). Each respondent completed a series of nine hypothetical choice sets (example choice task in Figure 1). Each set included two insulin product alternatives that varied by biotechnology method and price, and respondents were also provided with an “I would choose neither” opt-out option. The attributes were: 1) technology: GE or GM and 2) price per unit of insulin: $0.10, $0.25, $0.40, or $0.55. Price levels were selected to reflect a plausible range of out-of-pocket monthly insulin costs observed in the U.S. market, while maintaining sufficient variation to identify price sensitivity. The range spans commonly cited co-pay and discounted retail levels to ensure behavioral relevance for respondents managing diabetes. Respondents were instructed to assume that the product represented a standard U-100 insulin formulation commonly prescribed for diabetes management. The experimental manipulation varied only the production technology and price, holding dosage and efficacy constant. The full survey, including information presented to respondents, can be requested from the authors.
Sample choice set, technology information provided and “cheap talk” script.
Note: Respondents were first shown a cheap talk script and a brief prompt before beginning the choice experiment.
Information on Technology Production: Researchers have inserted a segment of human DNA coding for proinsulin – the protein precursor of the active form of insulin – into cell nuclei of cow embryos to produce a transgenic cow. The lactation from this cow yielded milk, human proinsulin and insulin. A system to collect and purify insulin products is still needed, as well as FDA approval, before transgenic cows could supply insulin. Currently, insulin is produced by genetically modified, transgenic yeast and bacteria.
Cheap Talk Script: Studies show that people tend to act differently when they face hypothetical decisions. In other words, they say one thing in a lab setting and do something different in a real-world setting. For example, some people would say they would choose an item in a hypothetical situation, but when faced with non-hypothetical or real choices (e.g., in a pharmacy), they will not actually choose the item that they said they would choose. We want you to behave the way you would if you had to choose between products in a retail pharmacy store.
Prompt: Now, imagine you are at your local pharmacy where you would normally have prescriptions filled. The price shown for each option represents the amount you would personally pay out-of-pocket at the pharmacy for that insulin.

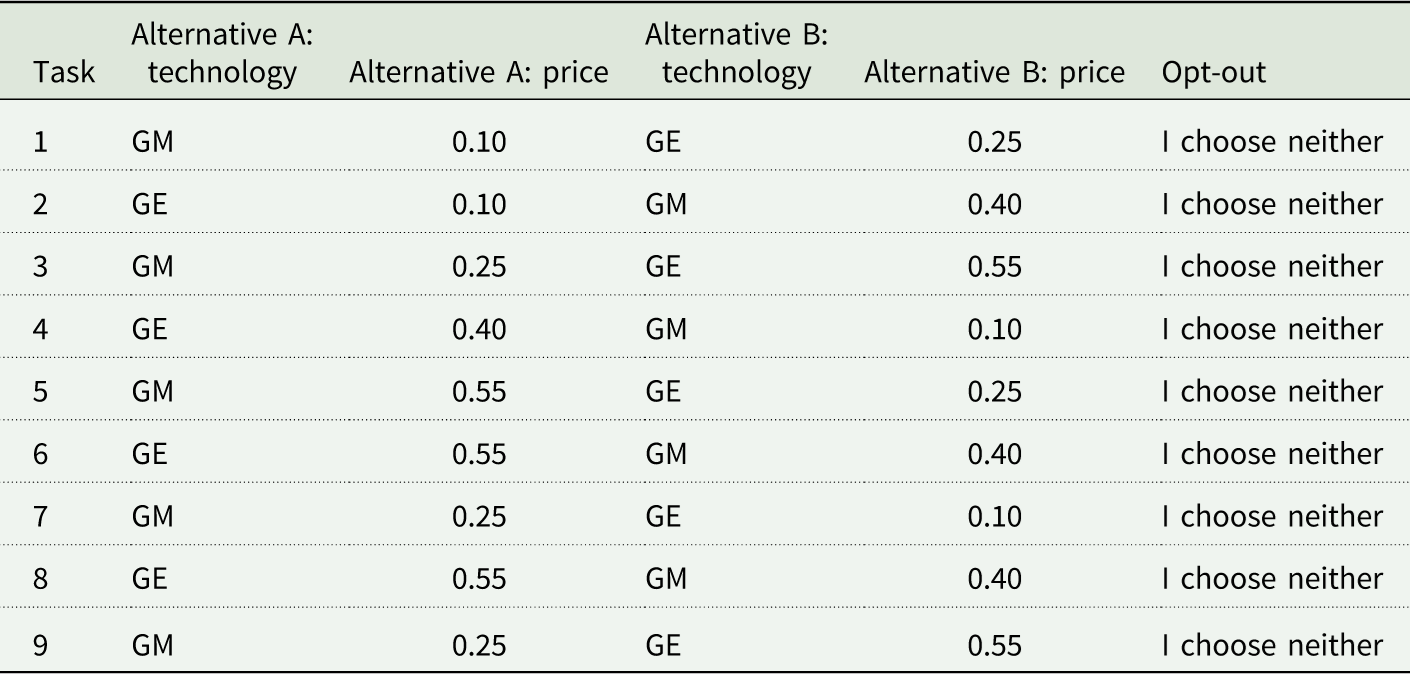
The choice sets were constructed using a full factorial design with evenly distributed attribute levels across tasks. For the implemented paired-choice design, we evaluated statistical efficiency under a utility-neutral (β = 0) multinomial logit main-effects specification that includes price (continuous) and an effects-coded technology attribute. Under this criterion, the design yields a D-error of 0.709. The full design matrix is provided in Appendix Table 2. The design allowed each respondent to observe a diverse set of technology-price combinations while maintaining orthogonality and level balance across the candidate set. To reduce hypothetical bias, all respondents were shown a cheap talk script before beginning the choice tasks (Lusk Reference Lusk2003). The script reminded respondents that people sometimes respond differently in hypothetical situations and encouraged them to make selections as if they were choosing insulin in a real pharmacy setting. A full version of the survey, including the script, an example choice task, and the information presented to respondents, is provided in an online Appendix.
The number of attributes and choice tasks was intentionally limited to preserve parsimony and reduce cognitive burden. The primary objective of the experiment was to isolate the tradeoff between production technology (GE versus GM) and price. Including additional attributes such as trust, labeling, or regulatory information within the choice tasks would have altered the interpretation of the core comparison and introduced additional sources of preference heterogeneity beyond the study’s central research question. Instead, attitudinal and perception-based measures were collected separately in the survey instrument and incorporated in subsequent regression analyses. Limiting the number of attributes also improves statistical efficiency in smaller-profile designs and enhances internal validity by focusing respondents’ attention on the key experimental dimensions.
While U.S. labeling regulations (e.g., the National Bioengineered Food Disclosure Standard) apply to foods rather than pharmaceutical products, the experimental design intentionally presented information on the insulin production method (GE versus GM) in a hypothetical transparency scenario. The purpose of this design was not to replicate current pharmaceutical labeling practice, but rather to isolate consumer preferences conditional on the explicit disclosure of the type of biotechnology. This approach allows for evaluating how technological framing may influence acceptance if such information were voluntarily disclosed or made salient in future regulatory or marketing contexts.
In addition to the choice experiment, the survey included a series of follow-up questions designed to capture factors that may influence consumer preferences. These included a question measuring relative perceived safety, asking respondents whether they viewed GE insulin as safer, less safe, or about the same as GM insulin. Respondents also responded to the question, “If U.S. regulators approved insulin produced by a gene-edited dairy cow, what would be your reasons for purchasing this product?” by completing a multiple-response item identifying motivations for purchasing GE insulin. Motivations included lower insulin prices, economic development potential for rural communities, potential to help rural agricultural producers, belief that gene editing is safer than genetic modification, gene editing represents an overall good for society, trust in the agriculture industry, and trust in the pharmaceutical industry. Additional questions gathered demographic and insulin-use characteristics, including diabetes type (Type 1 or Type 2), frequency of insulin use, household income, educational attainment, age, and gender. These variables were used as covariates in regression models to help explain variation in both willingness to pay and perceived safety. The survey collected information on diabetes type and insulin usage but did not gather detailed information on alternative diabetes management strategies. The study focused specifically on preferences for insulin production technology rather than broader disease management decisions. The same informational statement was presented to all respondents; no experimental information treatments were implemented. The complete wording is provided in the online appendix.
As a validity check, we examined response patterns for potential dominance behavior and attribute non-attendance. Prior to estimation, 24 respondents were removed for invalid response patterns, including selecting the same alternative across all nine tasks regardless of price or technology trade-offs. Among the retained sample, respondents exhibited meaningful variation in their selections, and we did not observe systematic evidence that individuals universally selected the lowest-priced alternative or a single technology option. The consistently negative and statistically significant price coefficient across model specifications further indicates that respondents were attentive to the experimental attributes. Eligibility required a self-reported diagnosis of Type I or Type II diabetes. Additional exclusions were limited to standard data-quality procedures applied uniformly across respondents. Specifically, incomplete surveys and responses failing internal consistency checks were removed prior to analysis. No further demographic or behavioral exclusion restrictions were imposed.
The two safety perception questions were designed to capture product-specific safety perceptions within a standardized informational framing, rather than to measure a broader, multidimensional trust construct. While not derived from a formal multi-item psychometric scale, single-item measures of perceived safety or risk are common in biotechnology acceptance research where the construct is narrowly defined and scenario-specific (e.g., Cummings and Peters Reference Cummings and Peters2022; Muringai et al. Reference Muringai, Fan and Goddard2020). The objective was to elicit respondents’ immediate safety evaluations of the two production methods relevant to the choice experiment. Additional survey items related to institutional trust were collected for descriptive purposes but were not included in the regression models.
Estimating individual-level WTP
DCE data were used to analyze consumer preferences and estimate respondents’ valuations using a framework consistent with random utility theory (McFadden Reference McFadden and Zarembka1974) and Lancaster’s consumer theory (Lancaster Reference Lancaster1966). To account for consumer heterogeneity in preferences across individuals in the sample, we estimate a mixed logit model. The model accounts for both random taste variation and correlation between the utilities of the two product options (Scarpa et al. Reference Scarpa, Ferrini, Willis, Scarpa and Alberini2005). The utility function for individual i, alternative j, and choice situation t is specified as:
 $U_{jit} = \beta_0{\rm None} + \beta_1 {\rm Price}_{jit} + \beta_2 {\rm GE}_{jit} + \eta_{jit} + \varepsilon_{jit}$
where Ujit is the utility of alternative j to individual i in choice situation t. The alternative-specific constant (None) was dummy-coded, taking the value of 1 for the choose-neither alternative and a 0 otherwise. Price is treated as a continuous variable represented by four experimentally designed price levels. The technology attribute is represented by the term GE with GM serving as the base. The GE variable takes a value of 1 if the product employs the respective technology and −1 in the absence of the technology (presence of GM, the base) and a 0 for the no-buy option. Because effects coding imposes a zero-sum restriction across product alternatives and the opt-out alternative is coded 0 on these attributes, one technology level is implicitly treated as the reference category. As a result, the inclusion of the alternative-specific constant for “None” does not induce perfect collinearity, and the model remains properly identified. Under effects coding, the technology coefficients represent deviations from the overall mean utility of the attribute levels rather than comparisons to a single omitted reference category. The opt-out alternative is captured through an alternative-specific constant, which serves as the baseline for the participation decision relative to the two product alternatives. Thus, the interpretation of GE and GM parameters reflects relative preference within the technology attribute, conditional on participation in the choice set.
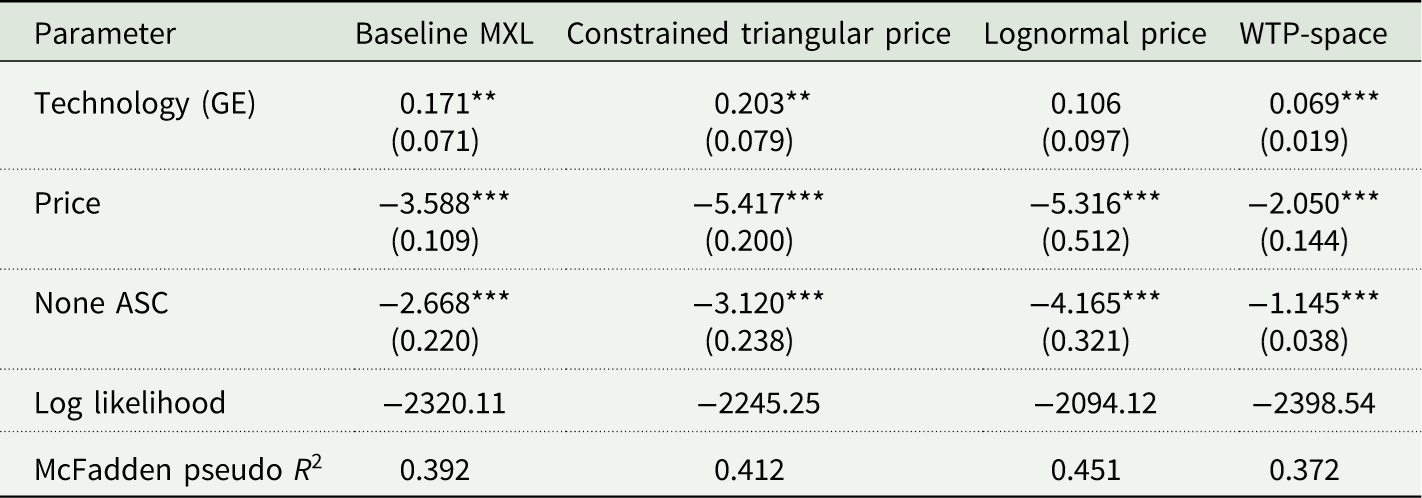
The primary model was estimated in preference space with a fixed price coefficient to support stable estimation of individual-level WTP and avoid instability associated with ratios involving highly dispersed price parameters. As robustness checks, we estimated models with lognormal and constrained triangular price distributions and an alternative specification in WTP space. Models were evaluated using 1,000, 2,000, and 5,000 simulation draws, with no material changes in parameter estimates or inference. Results from the alternative specifications are reported in Appendix Table 3.
All scenarios implicitly referred to a standard U-100 insulin formulation commonly prescribed for diabetes management (American Diabetes Association 2024). Dosage and therapeutic efficacy were held constant across alternatives, and only the production method and price varied experimentally. Price was presented in dollar terms to reflect standardized out-of-pocket cost comparisons per unit of insulin (U-100 equivalent), rather than varying insulin concentration or formulation type. This approach abstracts from heterogeneous insurance arrangements to isolate the marginal tradeoff between production technology and consumer cost. Preference space estimation also allows direct interpretation of marginal utility coefficients.
Technology parameters were assumed to have a random, normal distribution. ηjit is an error component that is normally distributed, with a mean of zero, and ϵjit is an unobserved random error term, assumed to follow an i.i.d. extreme value distribution. The model was estimated using NLOGIT 6 with 1,000 Halton draws for simulated maximum likelihood and panel specification to account for repeated choices per respondent. WTP for GE insulin was computed using coefficient estimates from Equation (1), at the individual level:
 ${WTP}_i =-\left({\mathit{\beta}{i}\ {\rm Gene{-}Edited} \over \mathit{\beta }\ {\rm Price}}\right)$
Individual-level WTP estimates were derived from the conditional posterior means of the random-parameter distributions obtained from the mixed logit model. Following the approach described by Revelt and Train (Reference Revelt and Train1998), individual-specific parameters were computed for each respondent based on their sequence of choices across the nine tasks. WTP for GE insulin was then calculated as the negative ratio of the technology coefficient to the price coefficient for each respondent. WTP estimates were converted from a per-unit basis to U-100 equivalents for interpretation and regression analysis. In the U.S., all insulins are available at a concentration of 100 units/ml (U-100) (Donnor and Sarkar Reference Donnor, Sarkar, Feingold, Ahmed and Anawalt2023). Nearly 38 percent of our sample reported U-100 as their insulin dosage strength, 19 percent U-200, 22 percent U-300, 6 percent U-500, and 16 percent reported they were unsure which concentration they take.
Prior to the choice experiment, all respondents were provided with standardized, non-technical definitions of GM and GE insulin. These descriptions were presented in plain language and remained accessible during the survey. While a formal comprehension quiz was not administered, respondents were subsequently asked to rate the perceived safety of each technology separately. The presence of meaningful variation in these safety ratings, along with statistically significant associations between perceived safety and WTP, suggests that respondents consistently differentiated between the technologies. The heterogeneity observed in safety perceptions further indicates that respondents did not treat the technologies as equivalent.
Perceived safety was measured independently through survey questions administered outside the discrete choice tasks and was not included as an attribute in the choice experiment itself. Consequently, perceived safety does not enter the utility function used to estimate individual-level WTP. Following standard practice in mixed logit applications (Train Reference Train2009), individual-level posterior means were recovered and used to explore observable correlates of preference heterogeneity. While perceived safety and WTP may reflect related attitudes toward biotechnology, the subsequent regression analysis examines associations between ex-ante safety perceptions and estimated WTP rather than asserting a causal relationship. As discussed in the discrete choice literature, such second-stage analyses are interpreted as associational and treated as observable correlates of preference heterogeneity rather than endogenous determinants of utility (Hess and Daly Reference Hess and Daly2014).
Regression analysis
Individual-level WTP for U-100 (equivalent) GE insulin was then used as the dependent variable in three regression models to assess the influence of: 1) perceived safety of GE insulin (relative to GM insulin), 2) demographic predictors, and 3) insulin-use characteristics on WTP for GE insulin. The regression model estimated can generally be specified as:
 ${\rm{WT}}{{\rm{P}}_i} = \alpha + \beta '{X_i} + {\varepsilon _i}$
where WTPi is the respondent’s estimated premium from Equation (2) and Xi is a matrix of independent variables. The three regression models were estimated in STATA 19 using heteroskedasticity-robust standard errors. Because individual-level WTP estimates are derived from the mixed logit model, the second-stage regression treats estimated parameters as dependent variables. Recovering posterior means of individual-specific parameters from mixed logit models to examine preference heterogeneity is common in the discrete choice literature (Revelt and Train Reference Revelt and Train1998; Train Reference Train2009). While this two-step approach does not fully account for the uncertainty associated with first-stage parameter estimation, it provides a useful descriptive framework for examining systematic variation in preferences across respondents. Accordingly, the regression results are interpreted as associational rather than causal estimates and should be viewed as evidence of preference heterogeneity rather than formal structural relationships.
Model 1 includes a single variable for perceived safety. Relative perceived safety is a continuous variable created by combining respondents’ ratings on two questions relating to GM and GE insulin on a 5-point Likert scale: 0 = Not at all safe, 1 = Slightly safe, 2 = Moderately safe, 3 = Very safe, 4 = Extremely safe. Respondents were asked how strongly they agree or disagree with the following: 1) I would feel safe taking insulin produced by transgenic yeast and bacteria, and 2) I would feel safe taking insulin produced by a transgenic cow. To capture the relative perceived safety of GE insulin compared to GM insulin, we took the difference between individual responses for these two questions and created the new continuous variable relative perceived safety, which ranges from −4 to +4, where a −4 represents GM perceived as much safer and +4 represents GE perceived as much safer. This novel approach allows us to isolate the relative safety perception between the technologies, reduce multicollinearity between responses to the two safety questions, and aligns with our analysis examining the WTP for GE relative to the base or status quo of GM insulin.
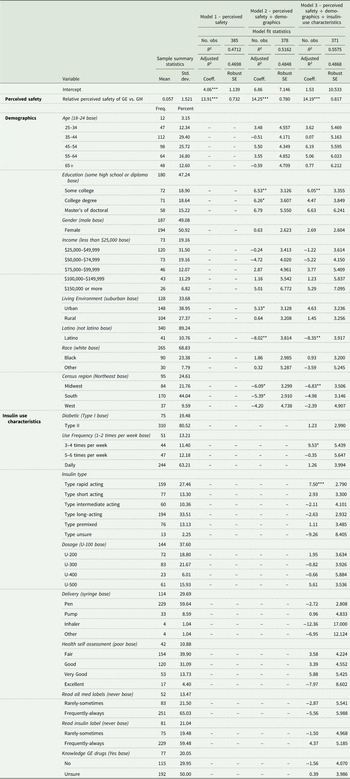
Model 2 includes relative perceived safety and adds a set of categorical demographic predictors described in Appendix Table 1, including age group, education level, income bracket, gender, self-reported living environment (urban, suburban, or rural), Latino, race, and census region. These variables are included to explore how socioeconomic and geographic characteristics shape consumer preferences and to account for heterogeneity in attitudes toward biotechnology across demographic groups.
Model 3 again includes relative perceived safety and demographic predictors and adds categorical variables related to insulin-use characteristics, including type of diabetes, insulin-use frequency, insulin type, dosage, delivery method, health self-assessment, reading medicine labels, reading insulin labels, and knowledge of taking any GE pharmaceuticals. These additions allow us to test whether personal experience with insulin, health awareness, and familiarity with biotechnology further explain variation in WTP for GE insulin. Appendix Table 1 provides the specific scales (and corresponding base categories) for all included variables. ϵn is a normally distributed error term in Equation (2).
Results
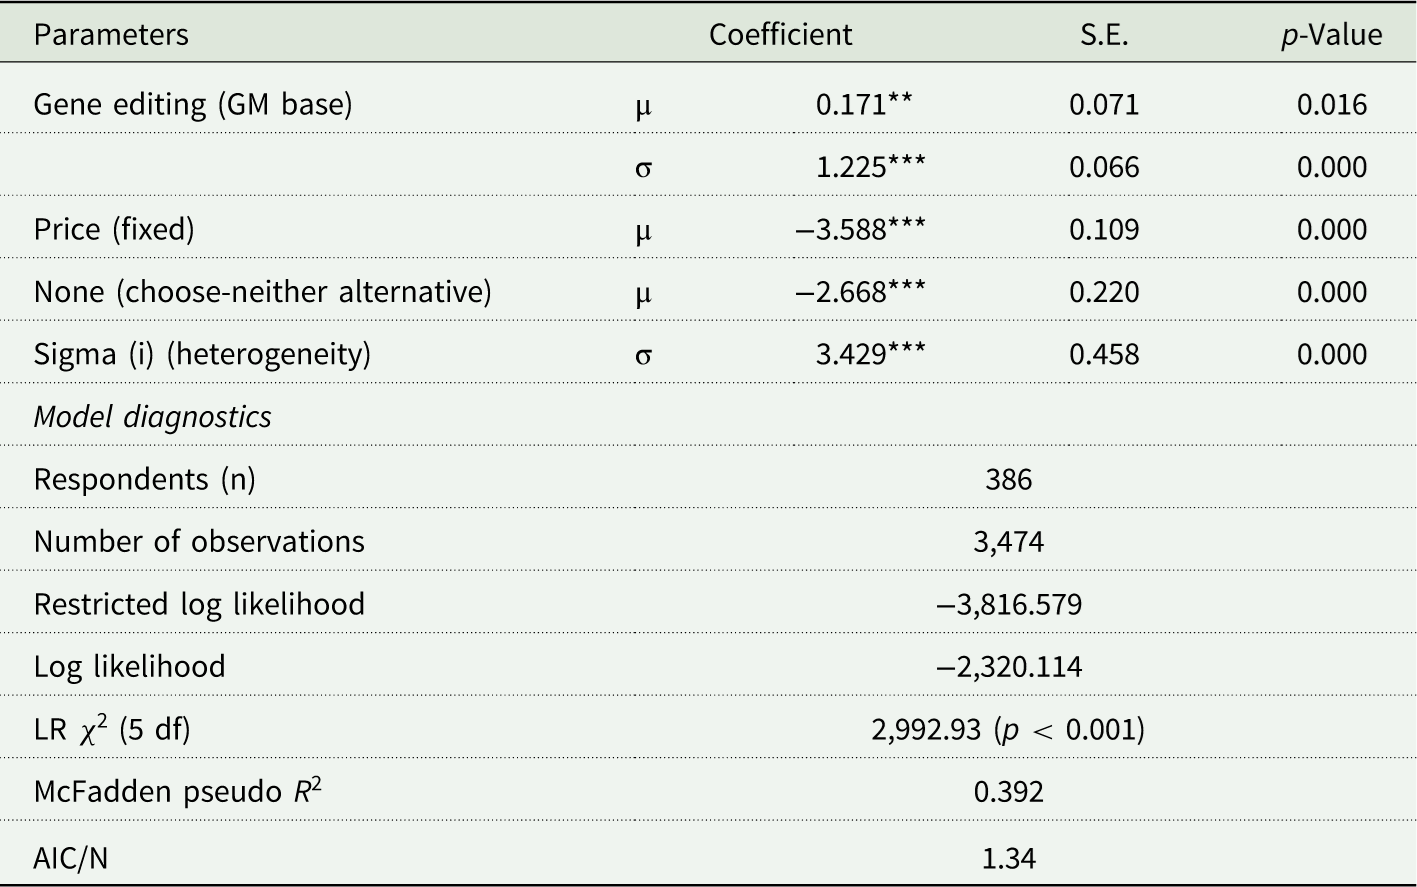
Model diagnostics indicate strong overall fit (Table 1). The mixed logit specification significantly improves model performance relative to the restricted model (LR χ 2 = 2992.93, df = 5, p < 0.001). McFadden’s pseudo-R 2 is 0.392, indicating substantial explanatory power for a discrete choice model. The model converged normally after 11 iterations using 1,000 Halton draws. The panel specification accounts for repeated choices (nine tasks per respondent; 386 respondents, 3,474 observations). The estimated standard deviation of the random technology parameter is statistically significant (p < 0.001), indicating preference heterogeneity.
Consumer preferences for GE vs. GM insulin: mixed logit model results

Table 1. Long description
A table with 7 rows and 4 columns. The columns are labeled Parameters, Coefficient, S.E., and p-Value. The table presents data on various parameters related to gene editing, price, and none (choose-neither alternative), along with model diagnostics. Each row lists the parameter name, its coefficient value, standard error, and p-value. Notable parameters include gene editing (GM base) with coefficients 0.171 and 1.225, price (fixed) with a coefficient of -3.588, and none (choose-neither alternative) with a coefficient of -2.668. Model diagnostics include 386 respondents, 3,474 observations, a restricted log likelihood of -3,816.579, a log likelihood of -2,320.114, LR χ2 (5 df) of 2,992.93 (p < 0.001), McFadden pseudo R² of 0.392, and AIC/N of 1.34.
Note: The model includes a random parameter for technology choice and a fixed price coefficient. Estimation was conducted using simulated maximum likelihood with 1,000 Halton draws and a panel specification to account for repeated choices per respondent (nine tasks per individual; 386 respondents; 3,474 observations). Model fit statistics indicate strong performance (restricted log-likelihood = −3816.579; final log-likelihood = −2,320.114; LR χ 2 (5) = 2,992.93, p < 0.001; McFadden pseudo R 2 = 0.392). The statistically significant standard deviation of the technology parameter confirms the presence of preference heterogeneity across respondents.
Consumer preferences for GE insulin
Table 1 summarizes the mixed logit model results, estimated to evaluate consumer preferences for U-100 (equivalent) insulin, using GM insulin as the base (status quo) and GE as the alternative production method. Results indicate the gene-editing attribute had a positive and statistically significant coefficient (β = 0.171, p = 0.016), indicating that, on average, respondents were more likely to prefer insulin produced through GE over GM. Although statistically significant, the relatively small magnitude of the coefficient compared to the price coefficient (β = −3.588, p < 0.001) suggests that price may be the primary driver in selecting an insulin product. The relatively large negative price coefficient confirms that cost remains a critical determinant of insulin selection. Additionally, the choose-neither alternative was significantly less preferred (β = −2.668, p < 0.001), indicating that most respondents preferred some form of insulin treatment over none, reinforcing the necessity of the product. The significant standard deviation of the error component (σ = 3.429, p < 0.001) highlights further variation in individual decision-making that may not be fully explained by the observed attributes included in the DCE. These findings suggest a favorable view of GE insulin among consumers but also highlight price sensitivity and substantial variation in preferences, warranting further investigation of factors influencing preferences for GE insulin.
To assess robustness, we estimated alternative specifications that relax the fixed-price assumption and model preferences in the willingness-to-pay (WTP) space. First, we estimated a WTP-space generalized mixed logit model. Second, we estimated a mixed logit model with a constrained triangular distribution for the price parameter. Across specifications, the price coefficient remained large, negative, and highly statistically significant. In contrast, the estimated preference for GE insulin was small in magnitude and sensitive to distributional assumptions. In WTP space, the mean WTP for GE insulin relative to GM insulin was close to zero and only marginally significant. These findings reinforce the central result that affordability, rather than the type of technology, is the primary driver of insulin choice in this sample. The primary findings were qualitatively consistent across alternative model specifications, providing additional confidence in the stability of the estimated preferences (Appendix Table 3).
Relative perceived safety, demographic, and use characteristics
Table 2 presents results from three regression models examining associations between relative perceived safety, other respondent characteristics, and WTP for U-100 GE insulin. Across all three models, relative perceived safety showed a large, consistently positive association with WTP. The estimated coefficient remained stable across specifications (β ≈ 14), indicating that respondents who perceived GE insulin as safer relative to GM insulin tended to report higher WTP for GE insulin. Model 1 explained a substantial share of the observed variation in WTP (R 2 = 0.47), suggesting that relative safety perceptions are an important source of preference heterogeneity.
Regression results: relative perceived safety and covariates on willingness to pay for GE insulin
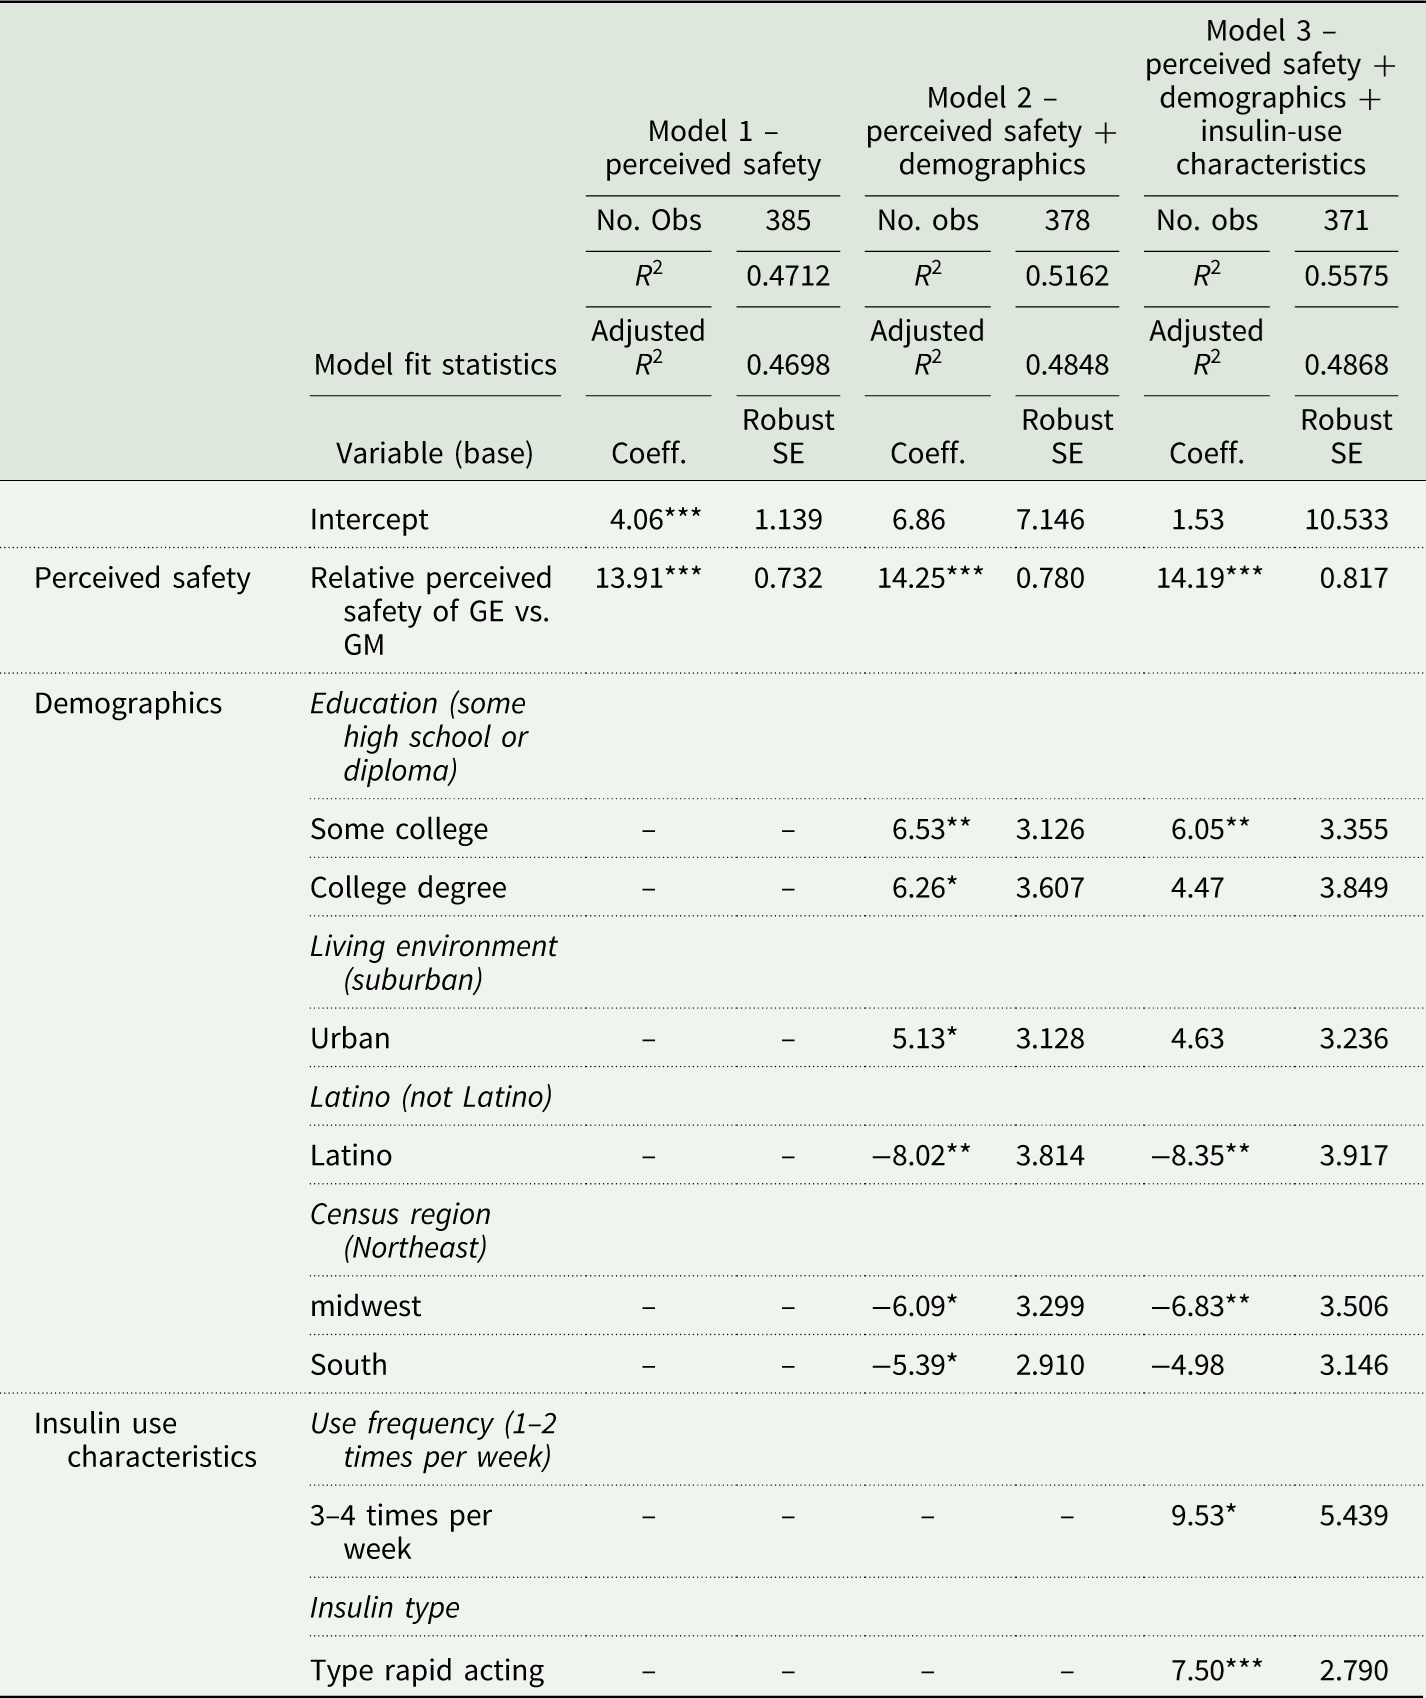
Table 2. Long description
A table with three columns and multiple rows comparing regression results for perceived safety and covariates on willingness to pay for GE insulin. The columns are labeled Model 1, Model 2, and Model 3, each with different variables and coefficients. Row 1: No. Obs, 385, 378, 371. Row 2: R^2, 0.4712, 0.5162, 0.5575. Row 3: Adjusted R^2, 0.4698, 0.4848, 0.4868. Row 4: Robust SE, blank, blank, blank. Row 5: Variable (base), Coeff., SE, Coeff., SE, Coeff., SE. Row 6: Intercept, 4.06***, 1.139, 6.86, 7.146, 1.53, 10.533. Row 7: Relative perceived safety of GE vs. GM, 13.91***, 0.732, 14.25***, 0.780, 14.19***, 0.817. Row 8: Some college, blank, blank, 6.53**, 3.126, 6.05**, 3.355. Row 9: College degree, blank, blank, 6.26*, 3.607, 4.47, 3.849. Row 10: Urban, blank, blank, 5.13*, 3.128, 4.63, 3.236. Row 11: Latino, blank, blank, -8.02**, 3.814, -8.35**, 3.917. Row 12: Midwest, blank, blank, -6.09*, 3.299, -6.83**, 3.506. Row 13: South, blank, blank, -5.39*, 2.910, -4.98, 3.146. Row 14: 3-4 times per week, blank, blank, blank, blank, 9.53*, 5.439. Row 15: Type rapid acting, blank, blank, blank, blank, 7.50***, 2.790.
Note: *,**, and *** indicate statistical significance at the p < 0.10, 0.05, and 0.01 levels, respectively. Variables not found to be significant have been removed from the table for presentation: Age, Gender, Income, Race, Diabetic (Type I or II), Dosage, Delivery, Health Self-Assessment, Read All Med Labels, Read Insulin Label, and Knowledge of GE Drugs. Full regression results are available in the Appendix. Models 2 and 3 include additional attitudinal and demographic covariates. Observations with missing data on these variables were excluded via listwise deletion, resulting in reduced sample sizes relative to Model 1.
Model 2 added demographic characteristics and increased model fit (R 2 = 0.52). Respondents with some college or a college degree tended to report higher WTP than those with only a high school diploma. Urban respondents generally reported higher WTP than suburban respondents, whereas respondents identifying as Latino or residing in the Midwest or South tended to report lower WTP. Model 3 incorporated insulin-use characteristics and further increased model fit (R 2 = 0.56). Respondents who reported using insulin 3–4 times per week and those using rapid-acting insulin generally reported higher WTP than their respective reference groups.
These results suggest that both demographic characteristics and insulin-use experiences are associated with variation in WTP for GE insulin. Relative perceived safety remained a robust correlate of WTP across specifications; however, because safety perceptions may be correlated with demographic and behavioral characteristics, the models should not be interpreted as establishing the relative importance of these factors. Rather, the findings indicate that perceptions of safety, demographic characteristics, and insulin-use experiences collectively contribute to observed heterogeneity in consumer preferences for GE insulin. For stakeholders and policymakers, the results highlight the potential importance of communicating information related to the safety of emerging insulin production technologies while recognizing that consumer responses may also vary across demographic and user groups.
Motivations for choosing GE insulin
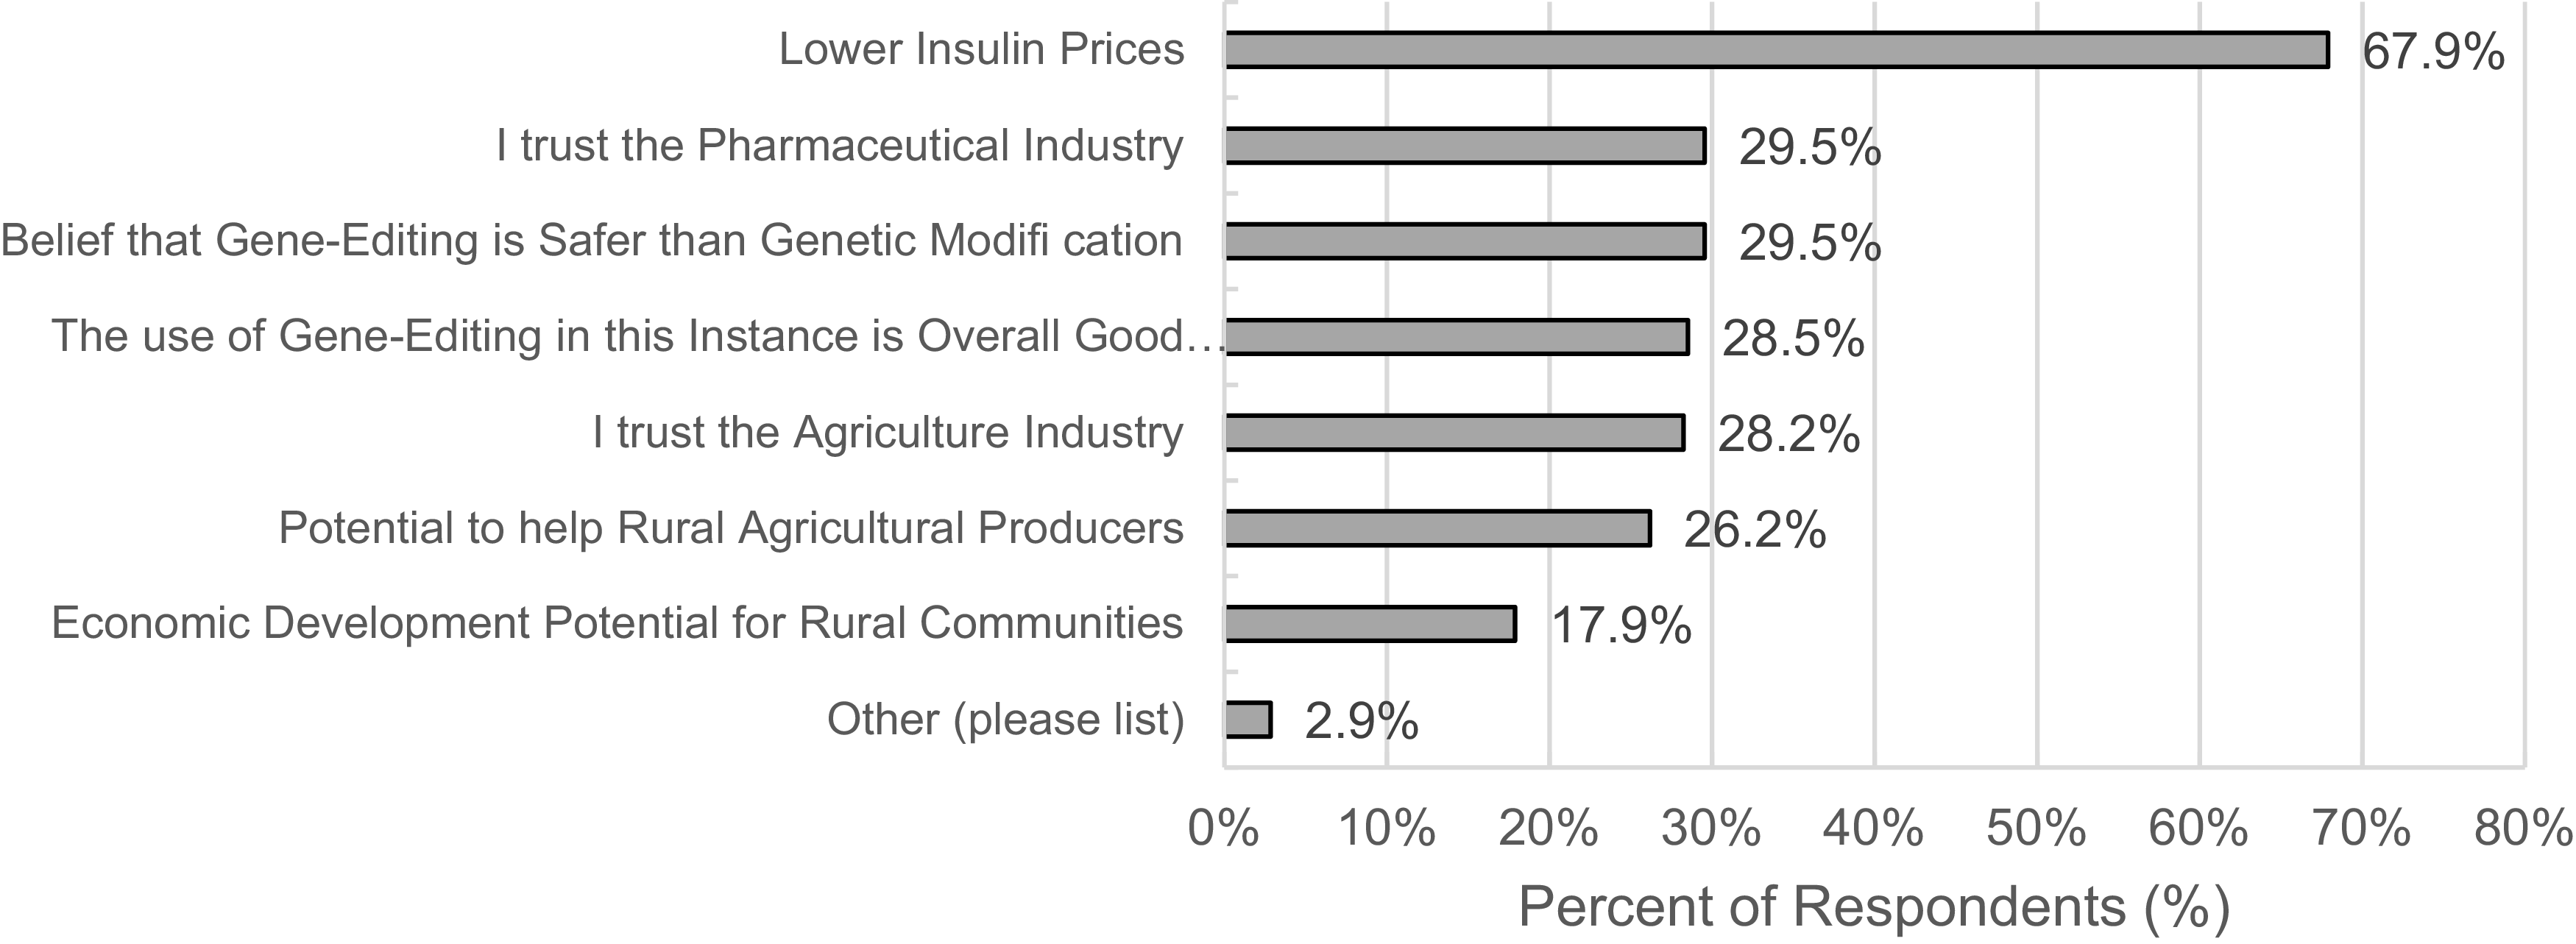
Figure 2 summarizes responses to the question, “If U.S. regulators approved insulin produced by a gene-edited dairy cow, what would be your reasons for purchasing this product?” The most commonly selected reason, by a substantial margin, was “Lower insulin prices,” chosen by 67.9% of respondents. This finding reinforces the dominant role of cost considerations observed in the discrete choice model (Consumer preferences for GE insulin) and confirms that affordability is the primary driver of consumer interest in GE insulin. This also aligns with prior research showing that genetically engineered products offering direct consumer benefits, such as lower cost or improved nutrition, tend to garner higher public acceptance (Lusk et al. Reference Lusk, McFadden and Rickard2015). Following price, several motivations clustered in the 28–30% range. 29.5% of respondents reported trust in the pharmaceutical industry. At the same time, an equal share cited the belief that gene editing is safer than genetic modification, underscoring the importance of relative perceived safety explored in Relative perceived safety, demographic, and use characteristics. Additionally, 28.5% indicated that using GE in this instance is good for society overall, and 28.2% expressed trust in the agricultural industry. Together, these responses suggest that institutional trust and broader societal values influence consumer motivations beyond individual benefits. Motivations tied to rural or agricultural outcomes were somewhat less common but still notable. 26.2% selected the potential to help rural agricultural producers, and 17.9% cited the economic development potential for rural communities. While these figures are lower than those for safety and trust, they demonstrate that roughly one in four consumers perceives GE insulin as having positive implications for rural America. These responses indicate a potential opportunity for strategic communication that links GE biopharmaceuticals to rural development and agricultural sustainability. Only 2.9% selected “Other,” suggesting that the listed motivations captured the key dimensions of consumer interest. Overall, the figure highlights that affordability, trust in institutions, and perceptions of societal benefit are central to understanding consumers’ motivations for adopting GE insulin.
Motivations for choosing GE insulin.

Discussion
This study examines consumer acceptance of insulin produced by transgenic dairy cows. Across both the DCE and the regression analyses, two themes emerged consistently: 1) price remains a dominant driver of choice, and 2) relative perceived safety of GE insulin is the strongest predictor of WTP. While preference was found for GE insulin over the GM status quo, the mixed logit model confirmed that cost was the most influential factor in shaping product selection. This aligns with a broader public concern over insulin affordability in the U.S. and positions price as a key determinant in future commercialization strategies.
Our WTP analysis revealed that consumers who perceive GE insulin as safer than GM insulin are substantially more willing to pay a premium of approximately $14 per U-100 equivalent insulin product. This magnitude dwarfs the effects of demographic and behavioral covariates. Consistent with prior biotechnology research, confidence in the perceived safety of GE technology appears to distinguish it from older GM applications. These results suggest that successful adoption of GE insulin will depend not only on cost competitiveness but also on effective communication regarding safety and therapeutic benefits.
The motivations identified in Figure 2 reinforce these findings. Nearly 68% of respondents selected lower insulin prices as a reason they would consider purchasing GE insulin, reflecting the price sensitivity observed in Consumer preferences for GE insulin. However, motivations extended beyond affordability: roughly 30% of respondents cited trust in pharmaceutical or agricultural institutions, belief that GE is safer than GM, or a sense that GE insulin would benefit society more broadly. These findings suggest that institutional trust and social values play a significant role in shaping consumer openness to biotechnology in medicine. Robustness checks suggest that technology-related preferences are sensitive to modeling assumptions, whereas the influence of price remains stable across specifications. This reinforces the conclusion that affordability is the primary driver of insulin choice, even when respondents express favorable attitudes toward GE insulin.
These findings should be interpreted within the broader context of ongoing debates surrounding insulin affordability and pharmaceutical pricing in the United States. Insulin prices have been the subject of sustained policy scrutiny due to concerns about access, insurance coverage, and out-of-pocket costs. The strong and consistent price sensitivity observed across all model specifications suggests that cost reductions may play an important role in consumer acceptance of emerging insulin production technologies. Although this study does not directly evaluate pricing policy or insurance design, the results highlight the economic importance of affordability in shaping consumer preferences.
While this study provides valuable evidence, it has limitations. Although panel quotas were used to approximate the demographic composition of U.S. adults with diabetes, the sample was recruited via an online panel. The DCE, while designed for realism, still presents hypothetical choices, which may not perfectly capture actual behavior. The measure of relative perceived safety relies on self-reported Likert-scale responses and may be influenced by framing or familiarity bias. Although our models account for heterogeneity in preferences, future research with larger, more diverse samples could examine subgroup differences in greater detail, especially among populations most affected by disparities in insulin costs and access. Finally, we did not collect detailed information on respondents’ insurance coverage or actual co-payment levels. Although insurance status may influence real-world insulin expenditures, the experimental framing standardized the price as an out-of-pocket cost to maintain internal validity. Future research could incorporate insurance type or coverage heterogeneity to explore how reimbursement structures interact with technology preferences.
Supplementary material
The supplementary material for this article can be found at https://doi.org/10.1017/age.2026.10039.
Data availability statement
The survey and choice experiment data used in this study were collected by the authors and are available from the corresponding author upon reasonable request.
Funding statement
This research was supported by funding from the Dale Bumpers College of Agricultural, Food, and Life Sciences, under no specific funding number.
Competing interests
The authors declare none.
Appendix
Summary statistics and regression results: impact of relative perceived safety and covariates on willingness to pay for GE insulin (GM Insulin base)

Table A1. Long description
The table presents summary statistics and regression results for the impact of relative perceived safety and covariates on willingness to pay for GE insulin. It includes three models: Model 1 (perceived safety), Model 2 (perceived safety and demographics), and Model 3 (perceived safety, demographics, and insulin-use characteristics). The table has 385 to 371 observations and R-squared values ranging from 0.4712 to 0.5575. Key variables include perceived safety, demographics (age, education, gender, income, living environment, Latino, race, census region), and insulin-use characteristics (diabetic type, use frequency, insulin type, dosage, delivery method, health self-assessment, reading medication labels, knowledge of GE drugs). Each model shows coefficients and robust standard errors for these variables. Notable trends include the impact of perceived safety and various demographic factors on willingness to pay.
Note: *,**, and *** indicate statistical significance at the p < 0.10, 0.05, and 0.01 levels, respectively.
Discrete choice experiment design matrix (implemented tasks)

Table A2. Long description
A table titled ‘Discrete choice experiment design matrix (implemented tasks)’ with nine rows and five columns. The columns are labeled ‘Task’, ‘Alternative A: technology’, ‘Alternative A: price’, ‘Alternative B: technology’, ‘Alternative B: price’, and ‘Opt-out’. Each row lists a task number from 1 to 9, the technology alternatives GM and GE, their respective prices, and the opt-out option ‘I choose neither’. Row 1: Task 1, GM, 0.10, GE, 0.25, I choose neither. Row 2: Task 2, GE, 0.10, GM, 0.40, I choose neither. Row 3: Task 3, GM, 0.25, GE, 0.55, I choose neither. Row 4: Task 4, GE, 0.40, GM, 0.10, I choose neither. Row 5: Task 5, GM, 0.55, GE, 0.25, I choose neither. Row 6: Task 6, GE, 0.55, GM, 0.40, I choose neither. Row 7: Task 7, GM, 0.25, GE, 0.10, I choose neither. Row 8: Task 8, GE, 0.55, GM, 0.40, I choose neither. Row 9: Task 9, GM, 0.25, GE, 0.55, I choose neither.
Note: Technology was effects coded in estimation (+1 for GE, −1 for GM; 0 for opt-out). Task order was randomized across respondents.
Robustness checks across alternative model specifications

Table A3. Long description
A table with four rows and five columns comparing different model specifications. The columns are labeled Baseline MXL, Constrained triangular price, Lognormal price, and WTP-space. The rows are labeled Technology (GE), Price, None ASC, Log likelihood, and McFadden pseudo R2. Each cell contains a value with a standard error in parentheses. Notable trends include negative price coefficients across all specifications and positive preference for GE insulin, with statistical significance varying by specification.
Note: Standard errors are reported in parentheses. ***, **, and * indicate significance at the 1%, 5%, and 10% levels, respectively. Across all specifications, the price coefficient remains negative and highly statistically significant, indicating strong sensitivity to out-of-pocket insulin costs. The estimated preference for GE insulin remains positive across specifications, although statistical significance is sensitive to distributional assumptions regarding the price coefficient.



 Open access

