Milk is a highly perishable food susceptible to rapid spoilage and deterioration due to the action of naturally occurring enzymes and microbial contaminants (Heyndrickx et al., Reference Heyndrickx, Marchand, De Jonghe, Smet, Coudijzer and De Block2010). The occurrence and species of microorganisms in cow’s milk depends on multiple factors, including herd management, milk production, collection, processing and handling practices at the farm and plant level, as well as handling and storage conditions during commercialization (Boor et al., Reference Boor, Wiedmann, Murphy and Alcaine2017). The initial total microbial count is influenced by storage temperature and the time elapsed after milk collection (Yuan et al., Reference Yuan, Han, Zhang, Xue, Zhang, Lu and Wang2022). Pathogenic bacteria can be present in raw milk as a direct consequence of udder disease, more commonly mastitis, or cross-contamination (Sumon et al., Reference Sumon, Parvin, Ehsan and Islam2020). Food safety is a constant preoccupation in the dairy industry as the high nutritional value of its products represents a fertile ground for microbial contamination and spoilage, thus potentially exposing consumers to significant health risks (Athar et al., Reference Athar, Tariq, Abdullah, Shabbir, Ehsan, Bibi, Mushtaq and Fatima2025). Globally, the popularity and high demand for milk and dairy products necessitates strict safety measures for preventing foodborne illnesses (Ntuli et al., Reference Ntuli, Sibanda, Elegbeleye, Mugadza, Seifu and Buys2023). The Codex Alimentarius (CAC, 2023) requires the implementation of specific quality management/assurance systems, namely the application of hazard analysis and critical control points (HACCP) and its prerequisite programmes, good hygienic practices (GHP) and good manufacturing practices (GMP), for the production of dairy products to ensure safety and quality until consumption (Swainson, Reference Swainson2019). The efficacy of these food safety management systems is vital for identifying and alleviating microbiological, chemical as well as physical hazards across the dairy supply chain (Gawai and Sreeja, Reference Gawai, Sreeja, Goyal and Hati2019).
The production of safe consumer milk requires thermal processing to inactivate microorganisms, although heat treatment can result in undesirable effects such as the development of cooked flavour, nutrient degradation and fouling on equipment surfaces (Mandal et al., Reference Mandal, Bag and Singh2019). Therefore, the dairy sector constantly strives to develop novel approaches, focusing on non-thermal technologies to optimize quality and satisfy consumers’ demand for minimally processed products that retain optimal sensory attributes and nutritional value (Shah et al., Reference Shah, Patel, Koshta and Prajapati2024). Pulsed electric field, ultrasonication, bactofugation and microfiltration are some of the non-thermal technologies that have been applied to extend the shelf life of dairy products (Shah et al., Reference Shah, Patel, Koshta and Prajapati2024). Microfiltration is a pressure-driven filtration process utilizing membranes with pores of approximately 0.1–10 μm in diameter to remove bacteria, somatic cells and spores. This technique can achieve a decimal reduction of bacterial counts by a factor of 3.5 or higher (Garcia and Rodríguez, Reference Garcia and Rodríguez2014). Milk microfiltration is generally conducted at temperatures of 45–55°C to achieve high initial flux (Hurt et al., Reference Hurt, Adams and Barbano2015). However, because filtration at this temperature leads to biofilm formation and fouling of the membranes, cold microfiltration has been introduced as an alternative. Microfiltration at temperatures below 20°C has become more common in dairy processing but results in longer run times (France et al., Reference France, Kelly, Crowley and O'Mahony2021). Microfiltration currently is the gold standard for producing fluid milk with extended shelf life. As an alternative to high heat treatment, milk is pasteurized or ultra-pasteurized before microfiltration to effectively reduce the microbial load and increase the refrigerated shelf life of milk to 30 days or more (Minj et al., Reference Minj, Sudhakaran and Kumari2020).
While microfiltration is a relatively costly process, it significantly extends milk shelf life and allows for longer distribution chains that reduce product losses, which translates into sizable economic benefits overall (Pinto et al., Reference Pinto, Pires, Sant'Ana, Soares and Carvalho2014). Compared to conventional processing, microfiltration provides notable benefits due to moderate operating temperature and pressure that help safeguard the functional properties of dairy products; it is also considered a green process as it limits the need for strong chemicals (Soodam and Guinee, Reference Soodam and Guinee2018). Microfiltered pasteurized milk has a longer shelf life than pasteurized milk under equivalent chilled distribution and storage conditions, hence its designation as extended shelf-life (ESL) milk. Moreover, sensory evaluation of microfiltered ESL milk by panels of untrained and trained judges showed that this product retains the pleasant odour and flavour characteristics of fresh milk, indicating that microfiltration satisfactorily preserves the original organoleptic properties of milk (Deeth, Reference Deeth2017). These have been major considerations driving the more widespread adoption of microfiltration for ESL milk production across various countries (Alegbeleye et al., Reference Alegbeleye, Guimaraes, Cruz and Sant'Ana2018). Microfiltration is generally performed with defatted milk to prevent membrane fouling by fat globules. A typical process could entail microfiltration of skimmed milk through a ceramic membrane of pore size 0.8–1.4 μm after pasteurization at 77°C for 30 s (Schmidt et al., Reference Schmidt, Kaufmann, Kulozik, Scherer and Wenning2012). Few studies have reported the effects of implementing safety and quality management systems at the farm and plant level, combined with microfiltration, to improve the shelf life of ESL milk. Thus, the aim of this study was twofold: (i) to implement GHP at the farm level, together with the HACCP system and its prerequisite GMP programme in a dairy plant, and (ii) to apply pasteurization followed by crossflow microfiltration to produce partly skimmed and full-fat ESL milk. The microbiological and chemical quality of milk was assessed at different critical points in the process, and its shelf life was determined.
Materials and methods
Materials
All the chemicals were analytical-reagent grade, and the solvents were HPLC grade. They were purchased from Sigma-Aldrich (Buchs, Switzerland) unless otherwise indicated. Microbial growth media were obtained from ThermoFisher Scientific Oxoid Ltd (Basingstoke, UK). Cow’s milk samples were collected from the dairy farm and dairy processing plant at the Jordan University of Science and Technology using sterile bottles and were transported to the laboratory in an insulated icebox.
Implementation of good agricultural practices (GAP) at the farm
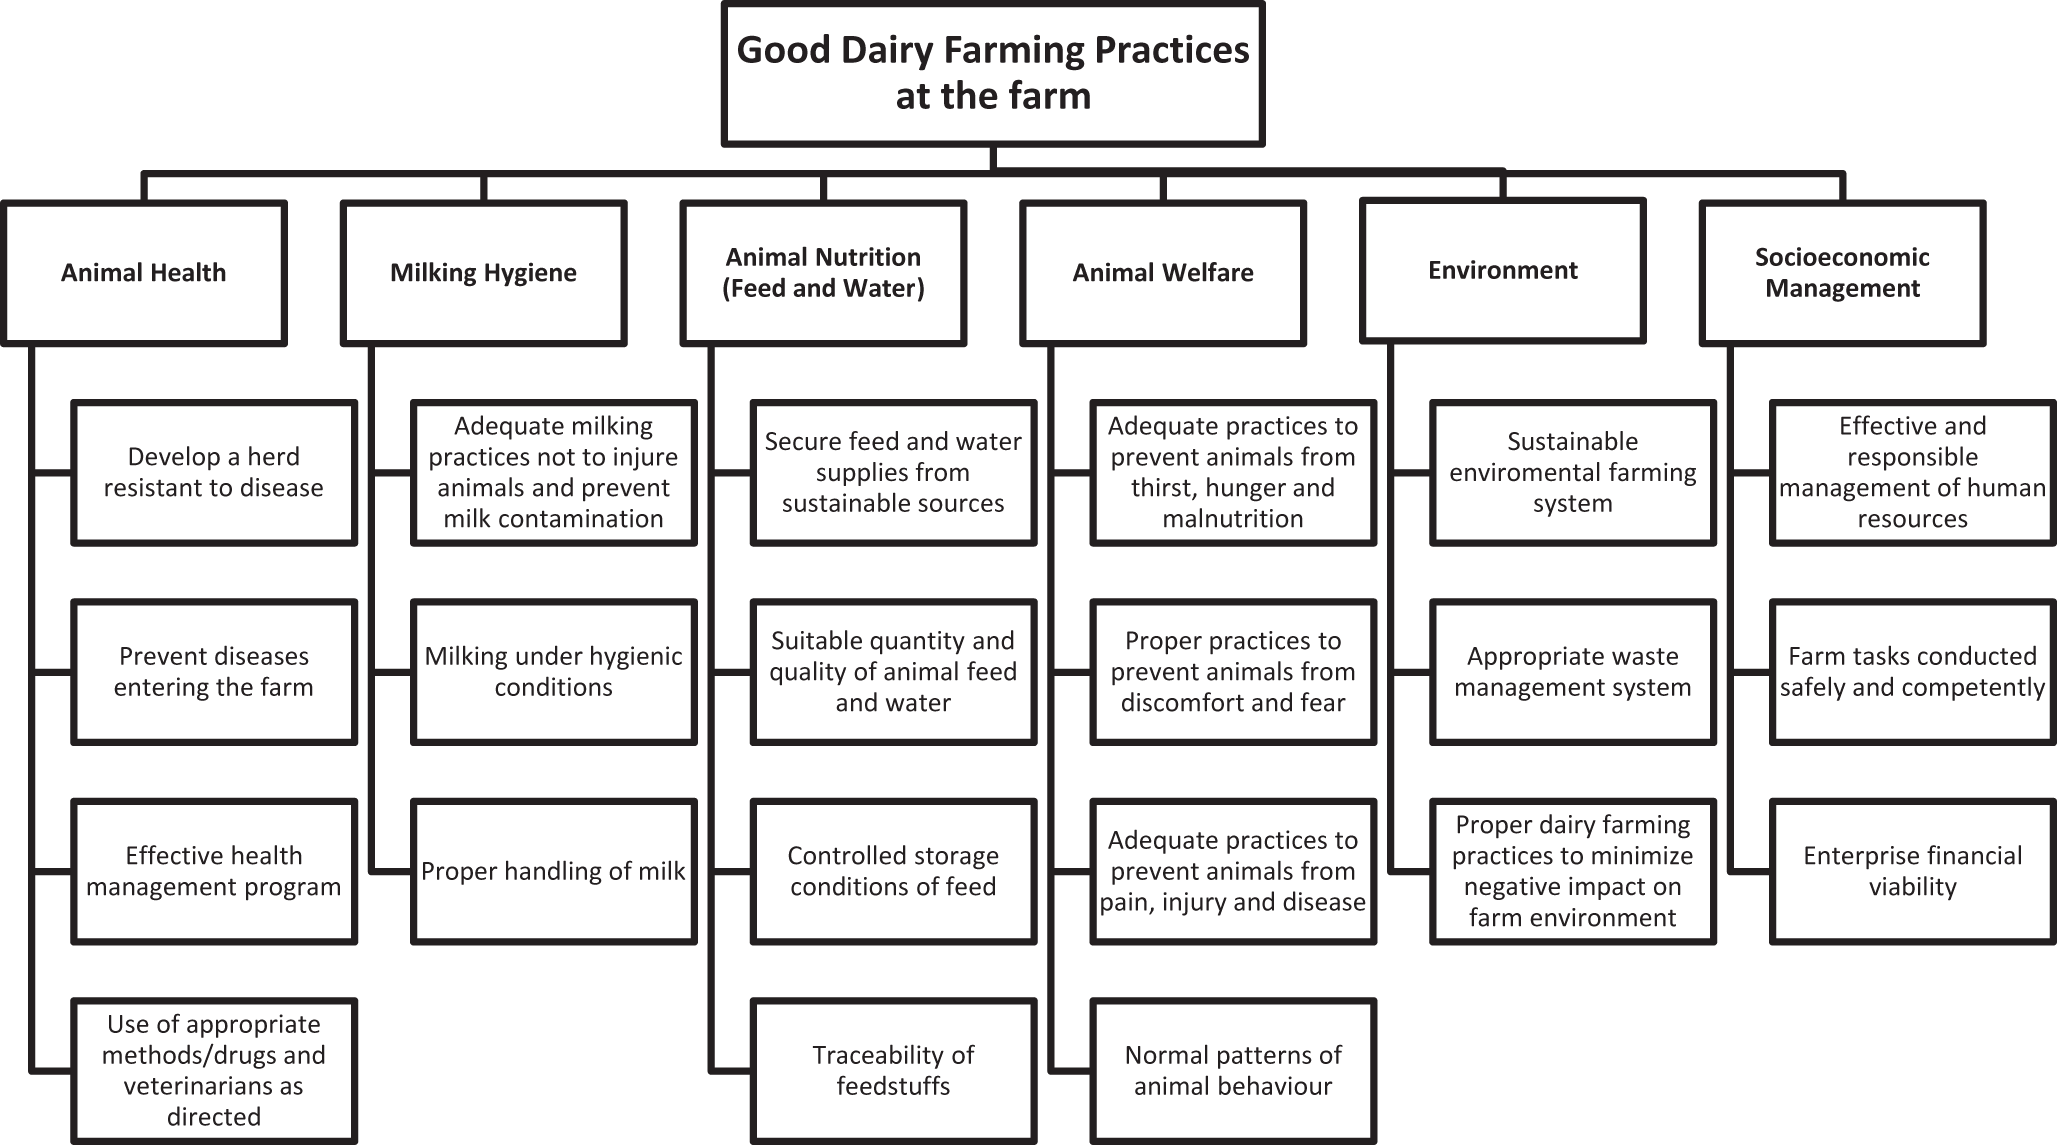
The dairy farm had a herd of 23 Holstein cows, producing 300 to 320 l of milk daily, of which 200 l was dedicated to the production of pasteurized liquid milk. Before the study, milking was performed manually and collected in a bucket before pooling into a storage tank cooled to 6°C. This system was replaced by a pipeline milking machine and pumping into the storage tank cooled to 4°C. The farm initially lacked a required quality management system and failed to meet the minimum hygienic requirements and practices. Implementation of GAP for dairy farming was based on Good Dairy Farming Practices (FAO/IDF, 2011) and the requirements for raw milk produced at the farm level (JSMO, 2014). A flow diagram was constructed to identify these practices as recommended (Fig. 1).
Flow chart of the Good Dairy Farming Practices implemented at the farm.

Figure 1 Long description
Good Dairy Farming Practices at the farm are divided into six main categories: Animal Health, Milking Hygiene, Animal Nutrition (Feed and Water), Animal Welfare, Environment and Socioeconomic Management. Animal Health includes: • Develop a herd resistant to disease • Prevent diseases entering the farm • Effective health management program • Use of appropriate methods/drugs and veterinarians as directed Milking Hygiene includes: • Adequate milking practices not to injure animals and prevent milk contamination • Milking under hygienic conditions • Proper handling of milk Animal Nutrition (Feed and Water) includes: • Secure feed and water supplies from sustainable sources • Suitable quantity and quality of animal feed and water • Controlled storage conditions of feed • Traceability of feedstuffs Animal Welfare includes: • Adequate practices to prevent animals from thirst, hunger and malnutrition • Proper practices to prevent animals from discomfort and fear • Adequate practices to prevent animals from pain, injury and disease • Normal patterns of animal behaviour Environment includes: • Sustainable environmental farming system • Appropriate waste management system • Proper dairy farming practices to minimize negative impact on farm environment Socioeconomic Management includes: • Effective and responsible management of human resources • Farm tasks conducted safely and competently • Enterprise financial viability.
Implementation of GMP and HACCP at the dairy plant
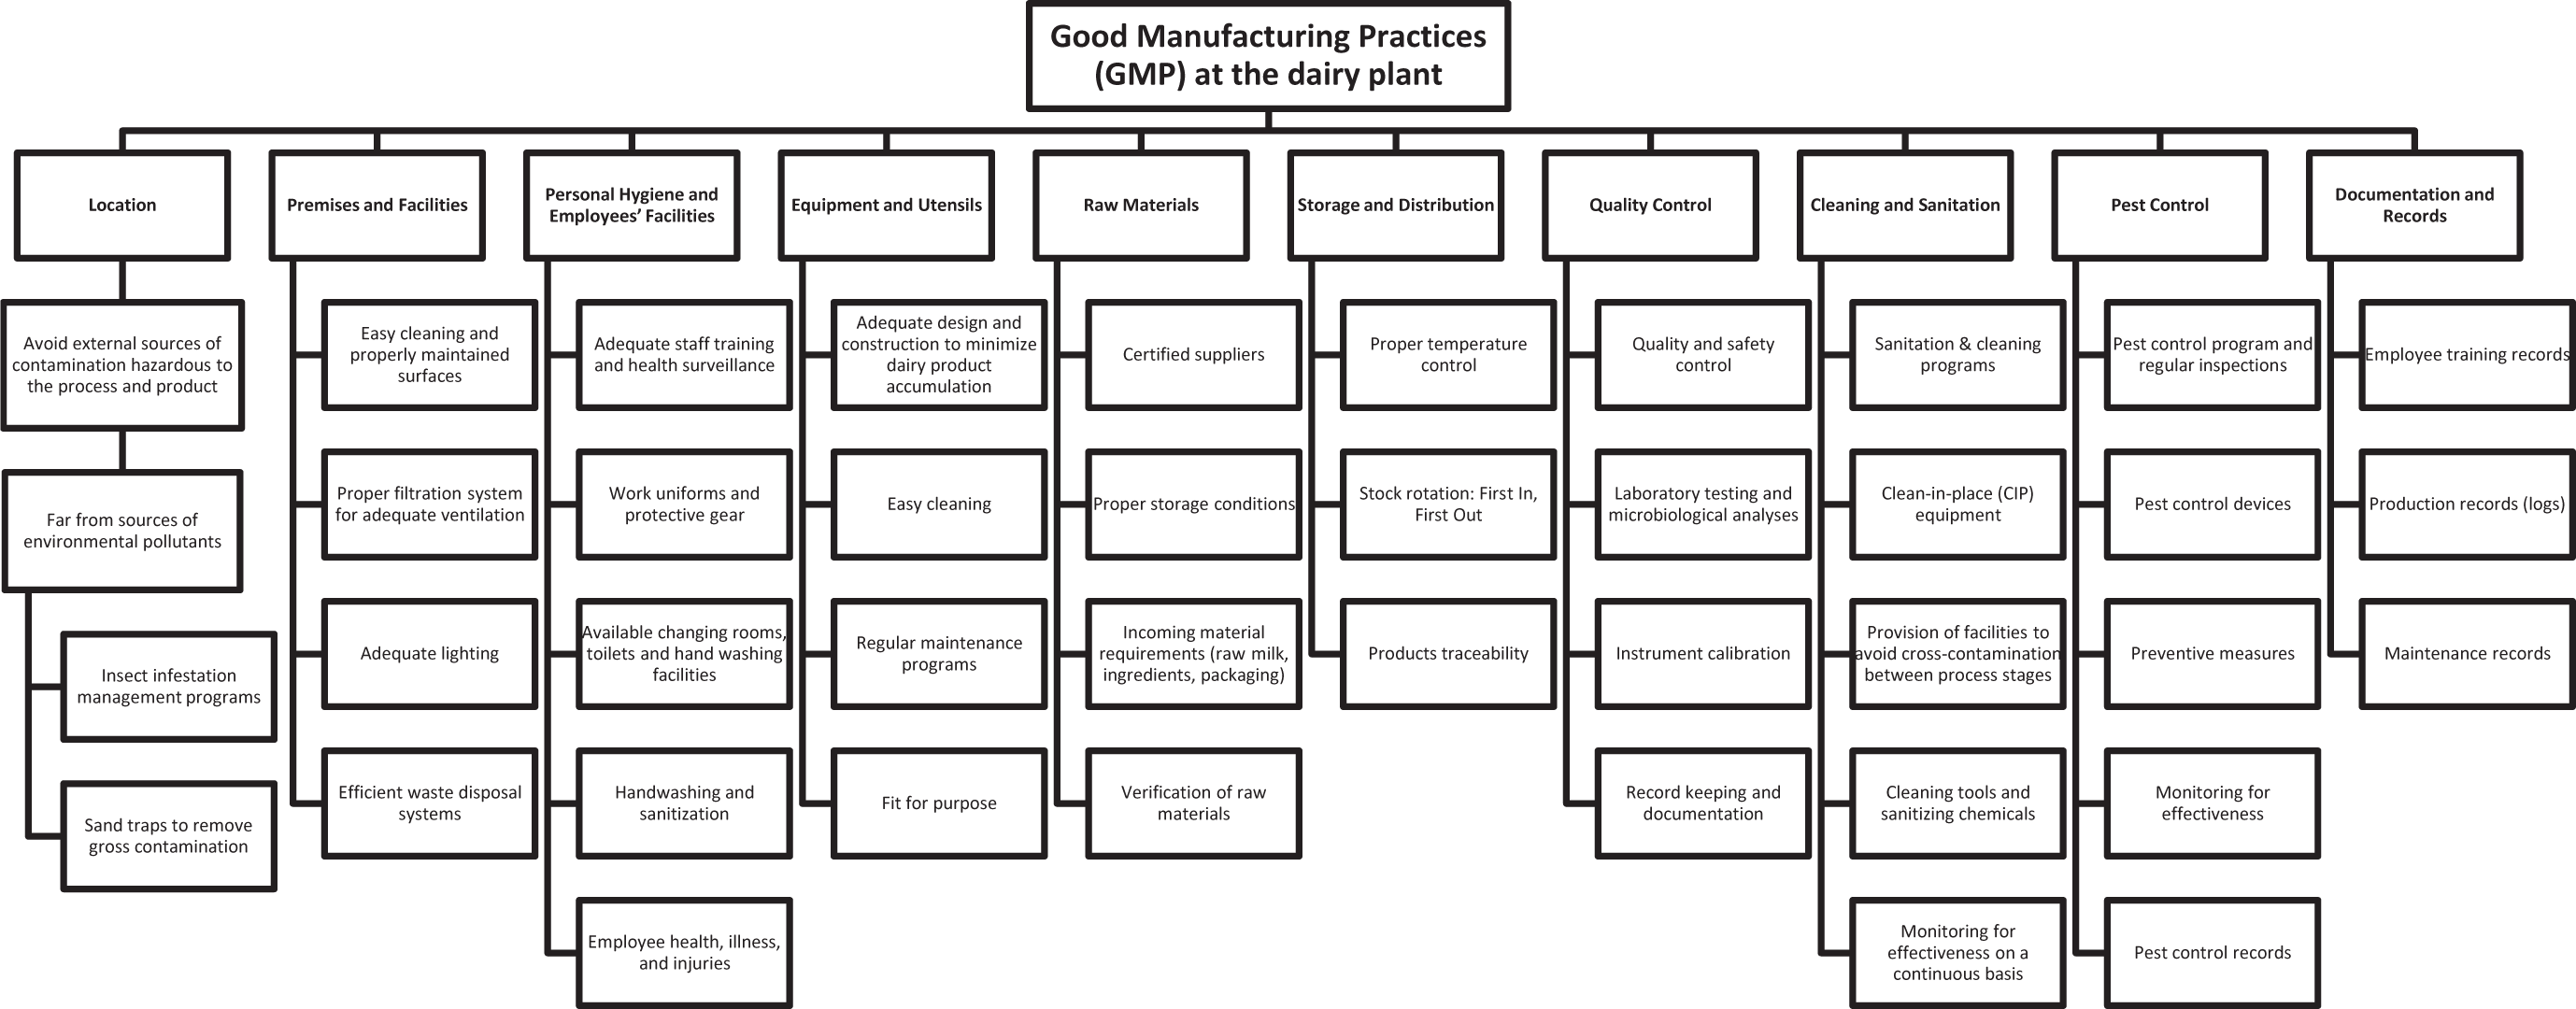
As part of the interventions tested in this study, GMP and HACCP were both implemented in the dairy processing plant to help address food safety concerns. A flow diagram of GMP was prepared as recommended (NACMCF, 1998; JSMO, 2016; CAC, 2023) (Fig. 2). The HACCP system was developed and implemented according to established standards (NACMCF, 1998; Wallace and Mortimore, Reference Wallace, Mortimore, Lelieveld, Holah and Gabrie2016; JSMO, 2016; CAC, 2023). It included an HACCP team trained in HACCP principles, an HACCP plan, a manual of procedures, as well as a supporting documentation of the control points (CP), critical control points (CCP), critical limits and operators’ qualifications and training. Quality control procedures, inspections and checks were conducted at all prescribed times during milk processing.
Flow chart of the Good Manufacturing Practices implemented at the dairy plant.

Figure 2 Long description
Good Manufacturing Practices (GMP) at the dairy plant are organized into several categories: Location, Premises and Facilities, Personal Hygiene and Employees′ Facilities, Equipment and Utensils, Raw Materials, Storage and Distribution, Quality Control, Cleaning and Sanitation, Pest Control and Documentation and Records. Location includes avoiding external contamination sources, being far from pollutants, insect management and sand traps for gross contamination. Premises and Facilities cover easy cleaning, proper ventilation, adequate lighting and waste disposal systems. Personal Hygiene and Employees′ Facilities involve staff training, work uniforms, changing rooms, handwashing and health monitoring. Equipment and Utensils focus on design, easy cleaning, maintenance and suitability for purpose. Raw Materials emphasize certified suppliers, proper storage and traceability. Storage and Distribution include temperature control, stock rotation and traceability. Quality Control involves safety control, laboratory testing, instrument calibration and documentation. Cleaning and Sanitation cover sanitation programs, clean-in-place equipment, cross-contamination prevention and monitoring effectiveness. Pest Control includes regular inspections, control devices, preventive measures and effectiveness monitoring. Documentation and Records involve training records, production logs, maintenance records and pest control records.
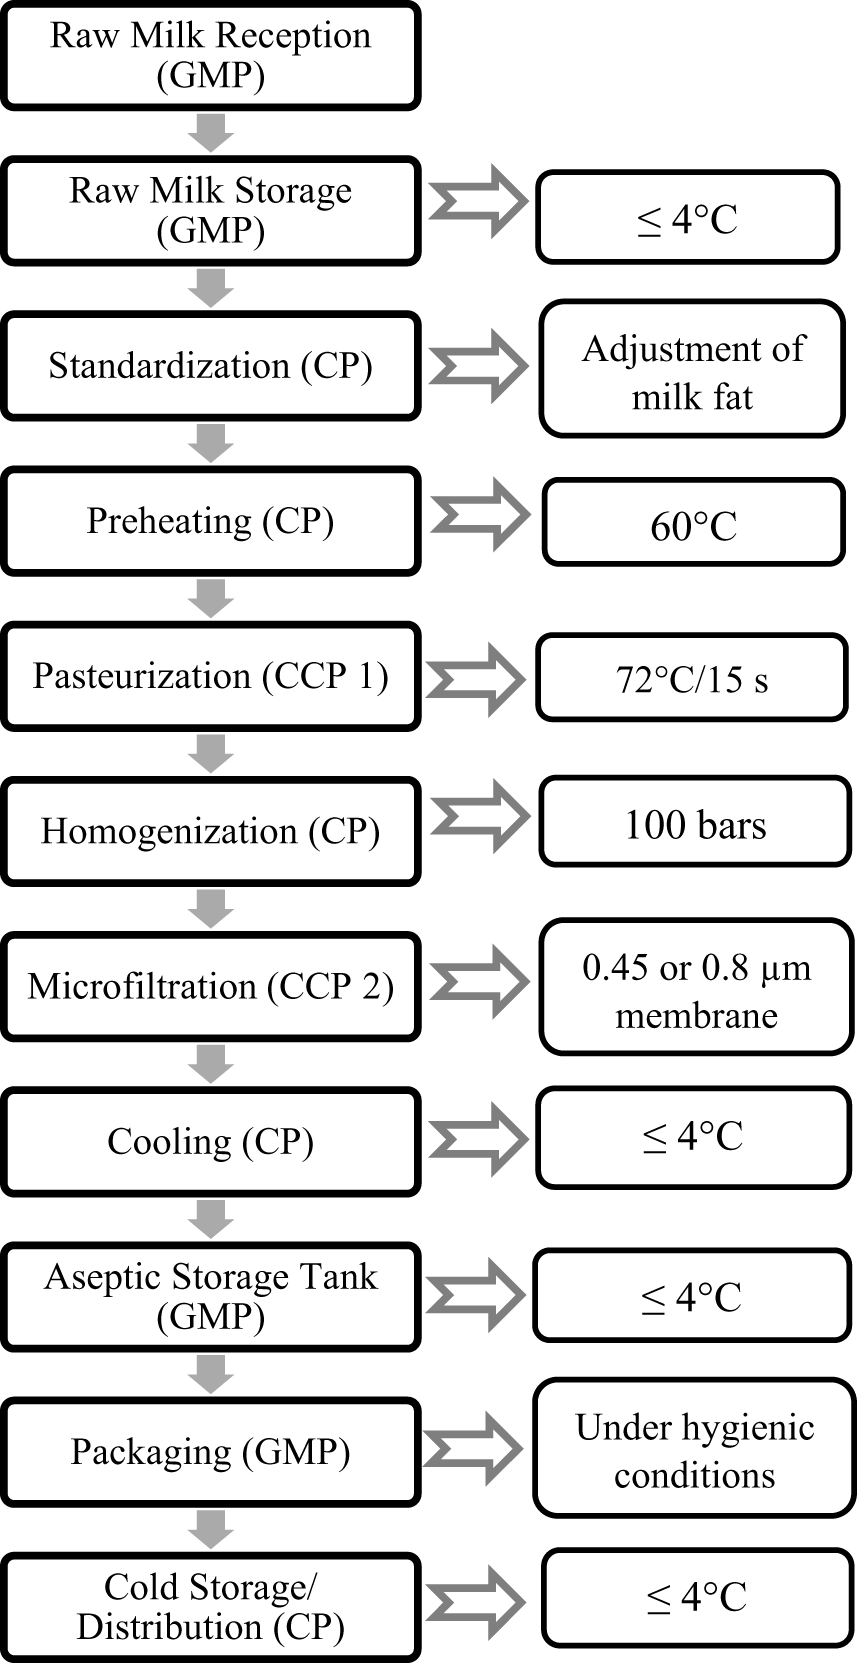
The HACCP team was a multidisciplinary team of dairy production professionals. The team developed the HACCP plan and was responsible for its implementation and verification. It also prepared the flow diagram for the production of pasteurized and microfiltered ESL milk (Fig. 3). Raw milk was pasteurized and homogenized before microfiltration, as described in the literature (Doll et al., Reference Doll, Scherer and Wenning2017). This enables the early inactivation of lipoprotein lipase before homogenization, as this treatment would otherwise promote high activity of this off-flavour producing enzyme due to the transfer of casein-associated lipase to the increased surface of milk fat globules (Bourlieu-Lacanal et al., Reference Bourlieu-Lacanal, Deglaire, Menard, Pezennec, Le Feunteun, Villeneuve, Dupont, Fattacciolli, Jamme, Carriere and Vie2019). The HACCP team was further responsible for developing the monitoring procedures applied to adjust the process and maintain control based on the results of monitoring. CCP were identified after hazard analysis using a CCP decision tree. A corrective action plan was established for each CCP to demonstrate control when deviation from a critical limit occurred at a CCP. Finally, a verification system was developed to assess the validity of the HACCP plan and the effective control of the identified hazards. Documentation of the HACCP plan was produced and maintained according to established standards (Wallace and Mortimore, Reference Wallace, Mortimore, Lelieveld, Holah and Gabrie2016).
Flow chart of extended shelf-life (ESL) milk production from pasteurized and microfiltered milk of full fat and reduced (2%) fat content.

Figure 3 Long description
The flowchart outlines the extended shelf-life milk production process. It begins with ′Raw Milk Reception (GMP)′ followed by ′Raw Milk Storage (GMP)′ at less than or equal to 4 degrees Celsius. Next is ′Standardization (CP)′ for milk fat adjustment, then ′Preheating (CP)′ at 60 degrees Celsius. ′Pasteurization (CCP 1)′ occurs at 72 degrees Celsius for 15 seconds. ′Homogenization (CP)′ is done at 100 bars. ′Microfiltration (CCP 2)′ uses a 0.45 or 0.8 micrometer membrane. ′Cooling (CP)′ follows, maintaining less than or equal to 4 degrees Celsius. ′Aseptic Storage Tank (GMP)′ also keeps the temperature at less than or equal to 4 degrees Celsius. ′Packaging (GMP)′ is under hygienic conditions. Finally, ′Cold Storage/Distribution (CP)′ is at less than or equal to 4 degrees Celsius.
Milk proximate composition and chemical analyses
Raw milk samples were analysed for total solids, moisture content, lactose, total fat content (Gerber method) and crude protein by measuring the nitrogen content. Antibiotic contaminants were detected using a simple yogurt culture test (YCT). For this test, 100 ml of milk was placed into a polyethylene yogurt container (200 g), followed by addition of 1 M HCL with stirring to adjust the pH to 6.0. Then, 4 g of starter culture (Streptococcus thermophilus and Lactobacillus bulgaricus) and 1 ml of chlorophenol red were added, followed by incubation at 42°C for 4 h. A control sample of skimmed milk free of antibiotics was similarly prepared. The colour was recorded at 2.5 and 4 h. Samples were considered contaminated with antibiotic (positive results in the YCT) if there was no curd formation or colour shift in the presence of chlorophenol red.
For aflatoxin determination, 40 ml milk was mixed with 1 g of NaCl, and the mixture was centrifuged at 2,000 × g for 10 min. The skimmed milk portion was collected by removing the fat layer with a syringe needle and was filtered through a glass microfiber filter paper before analysis by affinity chromatography, which was performed with an AflaTest column, as described by the manufacturer. Milk (25 ml) was injected into the column at a flow rate of 1–2 drops per second and allowed to completely pass through the column. The aflatoxins were eluted with a mixture of 10% methanol in distilled water and the eluate was collected in a cuvette (VICAM 34000). The individual aflatoxins were determined by injecting 100 μl of eluate into a LC-MS/MS chromatograph (Agilent Technology, 1200 Series).
The alkaline phosphatase (ALP) test was performed as an indicator of adequate pasteurization of milk. The procedure began with mixing 0.5 ml of milk and 5 ml buffered substrate (11.5 g anhydrous sodium carbonate, 10.15 g anhydrous sodium bicarbonate and 1.09 g di-sodiumphenylphosphate in 1 l of distilled water, pH 9.8) in a sterile test tube, which was gently mixed and incubated at 37°C for 1 h. Finally, 0.5 ml of BQC solution (50 mg of 2,6-dibromoquinonechloroimide (BQC) in 10 ml ethanol) was added to the mixture and mixed for 5 min to allow for blue colour development, used as an indicator of inadequate pasteurization.
Isolation of whey proteins was conducted after centrifugation of the milk samples at 1,700 × g for 30 min at 5°C. The supernatant was acidified to the isoelectric point (pH 4.6) at 20°C, then kept for 30 min to precipitate the casein fraction. This fraction and any residual fat globules were removed by microfiltration and the extracted whey proteins were injected into a HPLC chromatograph (Thermo Finnigan Surveyor HPLC and UV detector). Whey protein denaturation in microfiltered pasteurized milk was expressed relative to the denaturation in standard milk (i.e., pasteurized milk) using the peak areas obtained by HPLC (Fig. 4).
HPLC chromatograms of whey proteins for (a) control pasteurized milk, (b) pasteurized whole milk filtrated through a 0.8-μm pore size membrane, and (c) pasteurized partly skimmed milk filtrated through a 0.45-μm pore size membrane.

Figure 4 Long description
HPLC chromatograms of whey proteins are shown for three conditions: (A) control pasteurized milk, (B) pasteurized whole milk filtrated through a 0.8-micrometer pore size membrane and (C) pasteurized partly skimmed milk filtrated through a 0.45-micrometer pore size membrane. The x-axis is labeled retention time in minutes and the y-axis is labeled absorbance in milli-absorbance units. In image A, the chromatogram shows several prominent peaks at early retention times, with the tallest peak around 5 minutes. Smaller peaks follow at later times. In image B, the chromatogram displays a similar pattern, but with a noticeable reduction in peak height compared to image A, particularly at the early retention times. In image C, the chromatogram shows further reduced peak heights, with some peaks nearly absent compared to images A and B. The overlaid traces in each chromatogram represent different sample conditions, highlighting variations in whey protein content and denaturation across the samples. Key differences include the presence and intensity of peaks, indicating changes in protein composition due to filtration and skimming processes.
Microbiological analyses and somatic cell count
Milk samples were examined for total colony count (TCC), psychrotrophic bacteria, yeasts, moulds, aerobic and anaerobic spore-forming bacteria, Salmonella, Staphylococcus aureus, total coliforms and E. coli using standard methods. Somatic cell counts in milk were estimated using the California mastitis test. A four-well plastic paddle was used for this test and the milk was drawn into each quarter of the paddle after discarding the foremilk. An equal volume of test reagent was added with gently mixing. Next, the reaction was scored on a scale of 0 (mixture remains unchanged) to 3 (formation of an almost solid gel), where 0 denotes a somatic cell count (SCC) below 200,000 individual cells per ml. Positive results with scores 2 and 3 correspond to an SCC of 800,000–5,000,000 cells/ml and > 5,000,000 cells/ml, respectively.
Milk pasteurization, homogenization and microfiltration
Raw milk was pasteurized at 72°C for 15 s (APV Milk Pasteurizer, Delavan, WI) and then homogenized at 100 bars (Daihan Scientific Co. Homogenizer, Jijeong-myeon, South Korea) to reduce fat globule size to 0.3–0.8 μm. Crossflow microfiltration (CFMF) was performed at 50°C using a hollow fibre ceramic membrane (Sartorius Stedim Biotech, Goettingen, Germany) and a transmembrane pressure of 0.5 bar. The membrane module was coupled to a circulation pump (RS-1 Ultimate vacuum). The active portion of the membrane was coated onto an inert porous support consisting of alumina, carbon and stainless steel. For whole milk, membrane pore size and inner diameter (ID) were 0.8 μm and 1.5 µm, respectively. Partly skimmed milk (2% fat) was prepared by centrifugation followed by standardization of the fat content before CFMF (membrane pore size 0.45 μm, ID 2 µm). The retentate was discarded and the permeate was collected in sterilized glass bottles that were stored at 5°C until analysis.
Statistical analyses
All the determinations were made in duplicate, unless otherwise indicated, and means were calculated. Data were analysed using SPSS (v. 28, 2021, Chicago, IL). One-way analysis of variance (ANOVA) was conducted to test for differences among treatments (pasteurized whole milk, microfiltered pasteurized whole milk and microfiltered pasteurized 2% milk), followed by separation of the means by the least significant difference post-hoc test. Values of P ≤ 0.05 were considered significant.
Results
Implementation of the good dairy farming practices at the farm
The prerequisite GHP that were implemented at the farm are outlined in Fig. 1. The farm met the requirements related to animal health, milking hygiene, milking equipment and utensils, hygiene of personnel, handling practices, cooling and storage of milk at the farm, as required for raw milk produced at the farm level (JSMO, 2014).
Milk collection using a closed milking machine was conducted in a shaded area in the farm exempt from airflows to prevent contamination by soil, dust and other particles. Water reservoir tanks in the farm were well maintained, checked and cleaned regularly. They were supplied with potable water from an approved source. Water samples (100 ml) were analysed for coliforms using the most probable number (MPN) technique. Coliform levels were below 1 log CFU/ml as prescribed to produce Grade A milk (FDA, 2019). The bedding of the dairy herd housing was appropriately cleaned. The animal feed storage store was well aerated and was protected from humidity and elevated temperature. Its windows were sealed and fitted with screens to prevent the entry of pests. The exterior doors were kept tightly closed at all times and were periodically checked to ensure that there was no gap or opening when closed. Feed containers were located on racks not adjacent to the store walls and in positions that enabled proper air circulation as recommended (Schutz et al., Reference Schutz, Cave, Cox, Huddart and Tucker2019). Regular health checks of the individual cows were performed by a veterinarian. When mastitis was detected, the animals were segregated and treated with antibiotics as directed. The milkers were trained and experienced. They completed formal training on adequate hand washing as well as cleaning and disinfection of the milking machine and stainless-steel collecting vessels. They were instructed to wear disposable latex gloves, to wash the cows’ teats with a cloth soaked in a hypochlorite solution (600 mg/l of available chlorine), and to dry them with clean disposable towels as per standard practices (Gibson et al., Reference Gibson, Sinclair, Brizuela, Worton and Protheroe2008). The collected milk was transferred to clean vessels and delivered to the dairy plant in a refrigerated vehicle. Milk samples from the farm were taken for microbiological analysis and screening for aflatoxin M1 and antibiotic residues.
Somatic cell counts (SCC) were reduced to 150,000–500,000 cells/ml after systematic implementation of the good dairy farming practices, compared to 400,000–1,500,000 cells/ml before. Aflatoxin M1 was not detected in any of the milk samples following the implementation of good farming practices. Likewise, no antibiotic residues were detected in milk sampled at the farm.
Implementation of GMP in the dairy plant
Fig. 2 summarizes the GMP that were systematically implemented at the dairy plant. The plant fulfilled the GMP requirements that include facility design and maintenance, equipment maintenance, personnel hygiene and training, raw materials control, effective cleaning and sanitation programmes, pest control, proper conditions of storage and distribution, documentation, as well as quality control systems (JSMO, 2016). The premises were situated in an area that has no records of environmental pollutants, pest infestations, heavy smoke, or stagnant water. This site had no accumulated waste in its vicinity. However, it is in an open land area that generates a lot of dust, thus requiring proper dust control. Sand traps have been installed together with a series of filters inside the factory. The surface of the plant flooring was regularly inspected to make sure that it was free of cracks and that the angle of the floor inclination at specific locations allowed for adequate drainage of wastewater and other liquids to the designated outlets. The drainage system in the plant was designed to prevent cross-connection of sewage with other liquids from the plant to minimize the potential for contamination. The exterior doors were always tightly closed during processing without any gaps or openings. Windows on the exterior walls were sealed with screens to prevent the entry of pests. The building was equipped with well-maintained and regularly cleaned air filters and dust collectors for adequate ventilation and air exchange to prevent airborne contamination. Adequate lighting was ensured. The water supply of the plant came from a local water treatment plant. The level of chlorination of this source of potable water was not high enough to kill pathogens and spoilage bacteria. When additional chlorine was added to the water, the level of available chlorine was calculated on a volume basis, and records of all additions were kept. Under the GMP scheme, medical advice was sought for matters such as screening for possible symptomless carriers of Salmonella or Staphylococcus, and the time that employees should take off work following a gastrointestinal infection.
At the end of every shift, dirty factory white coats were collected and sent to an approved laundry facility. Lightweight disposable gloves were mandatory for workers in the processing room, and easily accessible hand washing facilities were available between the changing rooms and the processing room. The hand washing procedures in place were meant to ensure minimal residual bacteria on the skin. Water taps were knee-operated and bactericidal soap was provided. Moreover, the use of a final disinfecting rinse was encouraged, and a system of no-touch hand-drying and disposable paper towels delivery helped minimize recontamination. A strict policy limiting the wearing of watches, jewellery and hair clips was implemented. Any pens that were essential for record keeping were chained to the workstation and were regularly disinfected. Waste disposal units with polythene liners were located at strategic points to collect discarded paper towels and were routinely emptied.
The cleaning programme and procedures were detailed in the HACCP plan, as required when processing involves direct contact with food. The selection of detergents was completed with expert advice for factors such as available contact time and hardness of local water that can alter the expected efficiency of some detergents (Pant et al., Reference Pant, Cotter, Wilkinson and Sheehan2023). Cleaning of all items and equipment in the plant involved the removal of residual milk. Equipment and plant disinfection were carried out with sodium hypochlorite (200–250 mg/l) at 90°C for 10 min. Cleaning-in-place (CIP) was used for the pasteurizing plant. The advantages of CIP include the use of the highest temperature compatible with the chemical composition of the equipment and flood covering in the processing plant, as well as the scouring action of the cleaning fluid, which circulates through the pipe work at a high velocity of 1–2 m/s (Asming et al., Reference Asming, Aziz, Thani and Khalid2024).
Implementation of HACCP in the dairy plant
The multidisciplinary HACCP team was comprised of employees with a variety of expertise and experience in areas such as food technology, engineering, quality assurance, sanitation, maintenance and veterinary medicine. Together, they identified the microbiological, chemical and physical hazards that can contaminate cow’s milk, starting from raw material production and reception at the dairy plant, and ending with storage and distribution of ESL milk. The corresponding production flow chart is shown in Fig. 3. The scope or terms of reference for HACCP analysis, as agreed by the HACCP team, was the production of fluid cow’s milk that can be made available to consumer and is in or close to its natural state in terms of nutritional value and sensory quality but is highly perishable as it is susceptible to spoilage by the action of naturally occurring enzymes and contaminating microorganisms, including pathogens. More specifically, the products were described as full fat ESL milk and partly skimmed (2%) ESL milk, respectively, both produced by combining thermal treatment (pasteurization at 72°C for 15 s) and crossflow microfiltration, and stored at chilled temperatures of 4–7°C or lower, with a shelf life of 2–3 weeks for the unopened refrigerated products. Once opened, the milk should be consumed within 48 h. The ESL milk products were intended for human consumption by the general population of different age categories, except infants before the age of 9–12 months, for which pasteurized cow's milk is not recommended.
Raw milk was cooled immediately after milking and stored at ≤4°C for a maximum 12 h and delivered at ≤4°C. Cooled raw milk from the farm at was filtered to remove solid particles before being transferred to the reception bulk tank in the plant and then pumped into the pasteurizing unit and cooled. ATP bioluminescence was used to evaluate the cleanliness of the equipment surface and the filling heads of the packaging machine, which was operated under ultraclean conditions. The temperature in the plant storage room at ≤4°C for a maximum 12 h before pasteurization was checked and recorded every 4 h with a digital thermometer. For road delivery to retail stores, the temperature of the refrigerated truck container was <5°C for half an hour, as recommended for the storage of ESL milk. Under these controlled conditions, microbial growth is minimized and does not reach levels that would require designation of this step as a CP. Hazard analysis for ESL milk production is summarized in Table 1. Table 2 presents the CCP, CP, critical limits, monitoring procedures and corrective actions. Hazard analysis started at the reception stage to monitor the levels of pathogenic and spoilage microorganisms and ensure the absence of physical contamination (solid particles). Raw milk was sieved before pasteurization to eliminate any physical hazards. Pasteurization and membrane filtration were established as CCP, while CP was filling at the packaging stage and commercial distribution of the end products. Critical limits of CCP (pasteurization temperature and time, and microbial counts) and monitoring devices and procedures were determined, along with the corrective actions that should be implemented when deviation outside the critical limits is detected (Table 2). Procedures were also established to verify that the HACCP plan works effectively. Independent assessment of the HACCP plan was performed by two separate entities, namely the head of operations in the dairy plant and the regulatory authorities. Documentation of the HACCP plan included a process flow diagram and records about process CCP, critical limits, monitoring of CCP, deviations, corrective actions, verification of the plan, and its modification when required. Supplementary documentation contained information about the HACCP team composition and training, ingredient and raw material data, supplier quality documentation and records, equipment documentation, as well as the HACCP plan manual and GMP programme.
Hazard analysis for extended shelf life (ESL) milk production

Table 1 Long description
Stages of ESL milk processing are listed with associated hazards and the preventive measures used to control them. At raw milk reception, key microbiological hazards include Staphylococcus aureus, coliforms, psychrotrophs, and aerobic or anaerobic spores, managed through supplier specifications, refrigeration, and immediate filtration. Chemical and physical hazards at reception include antibiotic residues, aflatoxin M1, and soil, addressed by testing, feed quality control, sedimentation, and good manufacturing practices. Cooling steps highlight risk of environmental contamination, controlled through good manufacturing practices. Pasteurization focuses on pathogen survival, controlled by time and temperature management and verification using an alkaline phosphatase test. Microfiltration targets pathogenic microorganisms and spore-forming bacteria using food-grade membranes with pore size below one point four micrometers, plus controlled operating pressure, flow rate, and process temperature kept below fifty degrees Celsius to limit growth; a closed system reduces physical recontamination risk. Packaging emphasizes recontamination and foreign material risks such as broken glass, managed through good manufacturing practices, supplier control, and visual checks. Distribution addresses microbial growth by controlling time since filling and maintaining appropriate temperature.
GMP: good manufacturing practices.
Critical control points (CCP), critical points (CP), critical limits, monitoring and corrective actions in the production of extended shelf-life milk

Table 2 Long description
Critical control points for extended shelf-life milk production are listed with critical limits, monitoring methods, likely deviations, and corrective actions. Pasteurization requires heating to seventy-two degrees Celsius for fifteen seconds, monitored by thermometer and thermal records; if temperature drops below the target, increase pasteurizer hot water temperature, divert to another process, re-pasteurize, or discard milk. Membrane filtration sets microbial limits: spoilage organisms must stay below one log CFU per milliliter and pathogens must be absent in ten milliliters, verified by microbiological analysis; high counts trigger re-filtration. Commercial distribution requires storage at five to seven degrees Celsius, monitored by thermometer and thermal records; temperatures above seven degrees prompt product assessment and equipment review or correction. Temperature controls rely on continuous or recorded measurements, while filtration depends on lab testing that may not be immediate. Responsibilities are noted for pasteurization as shared between production and maintenance.
Proximate composition of milk and whey protein denaturation
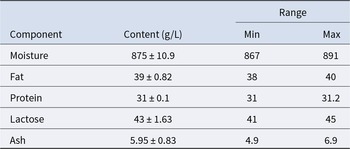
Raw milk at the reception stage contained an average of 39 g/l of fat, 31 g/l of protein, 43 g/l of lactose and 5.95 g/l of minerals (ash) (Table 3). Whey protein denaturation in microfiltered pasteurized milk was similar for whole ESL milk (0.98% and 1.06% for α-lactalbumin and β-lactoglobulin, respectively) and partly skimmed ESL milk (0.99% and 1.04%) (Table 4).
Proximate composition of raw cow’s milk at the reception stage in the dairy planta

Table 3 Long description
Raw cow’s milk composition at intake is summarized by average concentration in grams per liter with variability and observed minimum and maximum values. Moisture is highest at 875 g/L, ranging from 867 to 891. Lactose averages 43 g/L with a range of 41 to 45, and fat averages 39 g/L with a range of 38 to 40. Protein is 31 g/L and varies only slightly from 31 to 31.2, making it the most consistent component. Ash is lowest at 5.95 g/L and shows the widest relative spread, from 4.9 to 6.9. Values reflect a small set of repeated measurements, so ranges and variability describe this sampling rather than all possible milk batches.
a Mean values (four replicates) ± standard deviation and range.
Milk whey protein denaturation in microfiltered pasteurized milk, as assessed by HPLC relative to the denaturation in standard (pasteurized, unfiltered) milk

Table 4 Long description
Whey protein denaturation percentages are reported for two proteins, beta lactoglobulin and alpha lactalbumin, in microfiltered pasteurized milk relative to standard pasteurized unfiltered milk. Two treatments are compared: pasteurized whole milk filtered through a 0.8 micrometer membrane and pasteurized partly skimmed 2 percent milk filtered through a 0.45 micrometer membrane. For beta lactoglobulin, denaturation is 1.06 percent with 0.8 micrometer filtered whole milk and 1.04 percent with 0.45 micrometer filtered 2 percent milk. For alpha lactalbumin, denaturation is 0.98 percent with 0.8 micrometer filtered whole milk and 0.99 percent with 0.45 micrometer filtered 2 percent milk. Values are very close to 1 percent across treatments, indicating minimal differences between the two filtration conditions for both proteins. Differences are small and should be interpreted cautiously without information on variability or sample size.
Microbiological quality of raw milk
Table 5 shows that the incidence of microorganisms in bulk samples of raw milk was markedly reduced after systematic implementation of Good Dairy Farming Practices and GMP. For most microbial indicators, the average counts were reduced by more than a half as expressed in log CFU/ml (TCC reduced from 6.9 to 3.6, yeasts and moulds from 4.4 to 2, S. aureus from 6.4 to 2.2, psychrotrophs from 6.5 and 2.2, Salmonella from positive to negative, aerobic spore-forming bacteria from 4.5 to 2.1, total coliforms from 3.04 to 1, and E. coli from 2.04 to not detected). Anaerobic spore-forming bacteria were not detected.
Quantitative determination of different types of microorganism in bulk samples of raw cow’s milk from the farm before and after the implementation of Good Dairy Farming Practices at the farm and GMP at the planta

Table 5 Long description
Mean microorganism levels in raw cow’s milk are reported as log colony-forming units per milliliter for samples taken before and after improved farm and plant practices. Total count decreases from 6.9 to 3.6. Staphylococcus aureus drops from 6.4 to 2.2, and psychrotrophs fall from 6.5 to 2.2. Yeasts and moulds decline from 4.4 to 2.0, while aerobic spore formers decrease from 4.5 to 2.1. Anaerobic spore formers are not detected in either period. Salmonella changes from positive before to negative after. Coliforms decrease from 3.04 to 1.0, and Escherichia coli goes from 2.04 to not detected. Values are means with variability across replicates, so small differences should be interpreted in light of the reported spread.
a Mean values (three replicates of milk production) ± standard deviation, except where indicated.
CFU: colony-forming units; GMP: good manufacturing practices; –: not detected.
Microbiological quality and shelf life of pasteurized unfiltered whole milk
As summarized in Table 6, psychrotrophic bacteria, anaerobic spore-forming bacteria, Salmonella and E. coli were not detected in pasteurized whole milk before or after implementation of HACCP in the dairy plant. Other microbial indicators were notably reduced after HACCP implementation (total count reduced from 6.5 to 2.9 log CFU/ml, S. aureus from 3.07 log CFU/ml to not detected, aerobic spore-forming bacteria from 4.3 to 1.07 log CFU/ml, and yeasts and moulds from 2.3 log CFU/ml to not detected). The level of coliforms remained unchanged at 1 log CFU/ml. The microbial quality of pasteurized whole milk was assessed daily to determine its shelf life at 4°C, which increased to 7 days after the implementation of HACCP. As shown in Table 7, the TCC increased from 2.9 log CFU/ml on day 0 (production day) to 4.5 log CFU/ml on day 8, after HACCP implementation. Other indicators of microbiological quality, namely S. aureus, psychrotrophs, aerobic spore-forming bacteria, yeasts and moulds, began to rise on day 6 or 7. However, Salmonella, coliforms and E. coli were not detected during this time frame. The ALP test became positive on day 9.
Quantitative determination of different types of microorganisms in pasteurized whole milk produced in the dairy plant before and after the implementation of HACCPa

Table 6 Long description
Microbial counts in pasteurized whole milk are reported as mean log colony-forming units per milliliter before and after HACCP implementation. Total count decreases from 6.5 before HACCP to 2.9 after HACCP. Staphylococcus aureus is present before HACCP at 3.07 but is not detected after HACCP. Yeasts and moulds drop from 2.3 before HACCP to not detected after HACCP. Aerobic spore-formers decrease from 4.3 before HACCP to 1.07 after HACCP. Psychrotrophs, anaerobic spore-formers, and Escherichia coli are not detected in both periods. Salmonella is negative both before and after HACCP, and coliforms remain unchanged at 1.0 in both periods. Values are means with variability reported, and non-detected results indicate levels below the detection limit rather than confirmed absence.
a Mean values (four replicates of milk production) ± standard deviation, except where indicated.
CFU: colony-forming units; –: not detected.
Quantitative determination of different types of microorganisms over timea in pasteurized whole milk produced in the dairy plant after the implementation of HACCP

Table 7 Long description
Pasteurized whole milk stored under refrigeration was monitored from day 0 to day 8 for multiple microorganism groups, reported as mean log CFU per ml with variability. Total count stayed near 2.9 to 3.4 from day 0 through day 5, then increased to 3.9 on day 6, 4.2 on day 7, and 4.5 on day 8. Staphylococcus aureus was not detected through day 2, appeared at 1.0 on days 3 to 5, then rose to 2.2 on day 6, 2.8 on day 7, and 3.2 on day 8. Psychrotrophs were not detected until day 6, then increased from 1.0 on day 6 to 1.6 on day 7 and 2.3 on day 8. Yeasts and moulds were first reported at 1.0 on day 2, remained at 1.0 through day 5, then increased to 1.8 on day 6 and about 2.2 to 2.3 on days 7 and 8. Aerobic spore formers were present early at 1.07 on day 0 and 0.6 on day 1, were not detected on days 2 to 6, then reappeared at 1.0 on day 7 and 0.43 on day 8; anaerobic spore formers were not detected throughout. Salmonella was negative on every day measured, and coliforms and Escherichia coli were not detected at any time. Values reflect averages from replicate productions, so small day-to-day differences may fall within reported variability.
a Mean values (log CFU/ml, three replicates of milk production followed by refrigeration at 4°C) ± standard deviation, except where indicated.
CFU: colony-forming units; –: not detected.
Microbiological quality and shelf life of whole and partly skimmed ESL milk
The shelf life of refrigerated whole ESL milk and 2% ESL milk reached 18 days and 24 days, respectively, after implementation of the HACCP programme. As shown in Table 8, anaerobic spore-forming bacteria, Salmonella, coliforms and E. coli were not detected in whole ESL milk. Total count increased from 2.7 to 5.6 log CFU/ml on day 0 and day 17, respectively. S. aureus was not detected until day 8 and increased from 1.8 log CFU/ml on day 10 to 3.6 log CFU/ml on day 17. Aerobic spore-forming bacteria, psychrotrophic bacteria, and yeasts and moulds were not detected until days 16, 13 and 8, respectively. The ALP test was negative until day 19 and became positive on day 20. For partly skimmed (2%) ESL milk (Table 9), anaerobic spore-forming bacteria, Salmonella, coliforms and E. coli were not detected during the 24-day time frame. Total count for 2% ESL milk increased from 1.9 to 5.12 log CFU/ml between day 0 and day 24. S. aureus was not detected until day 9 and then rose from 1 to 3 log CFU/ml between day 9 and 24. Similarly, aerobic spore-forming bacteria, psychrotrophs, and yeasts and moulds were not detected until days 17, 16 and 11, respectively. The ALP test became positive on day 25.
Quantitative determination of different types of microorganisms over timea in whole ESL milk produced by microfiltrating pasteurized milk through a 0.8-μm pore size membrane after the implementation of HACCP

Table 8 Long description
Microbial results for refrigerated extended shelf life milk are listed by day 0 through day 17, reporting mean log colony-forming units per milliliter with standard deviations for multiple organism groups. Total count increases steadily from 2.7 on day 0 to 3.6 by day 8, reaches 5.0 on day 15, and peaks at 5.6 on day 17. Salmonella is reported as negative on every day measured. Staphylococcus aureus is not detected through day 7, appears at 1.0 on days 8 and 9, then rises to 3.6 by day 17. Yeasts and moulds are not detected through day 7, appear at 1.0 on days 8 through 12, then increase to about 2.6 by day 17. Psychrotrophs first appear on day 13 at 1.0, increase to 1.2 on day 16 and 1.8 on day 17. Aerobic spore formers are first reported on day 16 at about 1.1 and rise to 1.3 on day 17, while anaerobic spore formers, coliforms, and Escherichia coli are not detected throughout. Values reflect replicate measurements and include variability, and one yeasts and moulds entry on day 16 appears inconsistently formatted, so that specific value should be interpreted cautiously.
a Mean values (log CFU/ml, three replicates of milk production followed by refrigeration at 4°C) ± standard deviation, except where indicated.
CFU: colony-forming units; ESL: extended shelf life; –: not detected.
Quantitative determination of different types of microorganisms over timea in partly skimmed (2%) ESL milk produced by microfiltrating pasteurized milk through a 0.45-μm pore size membrane after the implementation of HACCP

Table 9 Long description
Microbial results in refrigerated 2 percent ESL milk are reported by day 0 through day 24 as mean log CFU per milliliter with standard deviations, plus presence or absence for Salmonella. Total count increases gradually from 1.9 at day 0 to 3.11 by day 9, then continues upward to 5.12 by day 24. Staphylococcus aureus is not detected through day 8, appears at 1.0 from days 9 to 15, and rises to 3.0 by day 24. Psychrotrophs are not detected until day 16 at 1.0, then increase to 2.7 by day 24. Yeasts and moulds first appear at day 11 at 1.0 and climb to 2.9 by day 24. Aerobic spore formers are first detected at day 17 at 1.0 and remain at 1.0 through day 24, while anaerobic spore formers are not detected at any time point. Salmonella is negative on every day measured, and coliforms and Escherichia coli are not detected throughout. Values reflect three replicate productions and include variability, so small day to day differences should be interpreted cautiously.
a Mean values (log CFU/ml, three replicates of milk production followed by refrigeration at 4°C) ± standard deviation, except where indicated.
CFU: colony-forming units; ESL: extended shelf life; –: not detected.
Comparison of the microbiological quality of the differently processed milk
As shown in Table 10, microfiltered (0.45 μm pore size) pasteurized partly skimmed milk had the lowest TCC (1.9 log CFU/ml), followed by microfiltered (0.8 μm pore size) pasteurized whole milk (2.7 log CFU/ml) and pasteurized milk (2.9 log CFU/ml). Aerobic spore-forming bacteria were only detected in pasteurized milk at a level of 1.07 log CFU/ml.
Quantitative determination of different types of microorganisms in pasteurized milk after implementation of HACCP and in ESL milk produced by microfiltration of pasteurized milk of different fat contents

Table 10 Long description
Microbial results in CFU per milliliter are compared across three milk treatments: pasteurized whole milk, pasteurized whole milk after microfiltration with a 0.8 micrometer filter, and pasteurized 2 percent milk after microfiltration with a 0.45 micrometer filter. Total count declines across treatments, from 2.9 plus or minus 0.032 in pasteurized whole milk to 2.7 plus or minus 0.027 after 0.8 micrometer microfiltration, and to 1.9 plus or minus 0.050 after 0.45 micrometer microfiltration. Staphylococcus aureus, psychrotrophs, yeasts and moulds, anaerobic spore formers, coliforms, and Escherichia coli were not detected in any treatment. Aerobic spore formers were detected only in pasteurized whole milk at 1.07 plus or minus 0.197 and were not detected after either microfiltration treatment. Salmonella was negative for all three treatments. Values are means with variability reported, and letter markers indicate statistically different totals within the same row.
Means (four replicates sampled immediately after each treatment) followed by different letters in a row differ significantly (p ≤ 0.05).
CFU: colony-forming units; ESL: extended shelf life; –: not detected.
Discussion
Chemical contaminants and whey protein denaturation
In this study, no antibiotic residues and no aflatoxins were detected in the milk samples, either before or after implementation of Good Dairy Farming Practices. The presence of antibiotics in milk can be an indication of mastitis in dairy cattle. Their absence in milk confirms that the dairy herd was properly managed with practices that improve hygiene and maintain teat health. Aflatoxin M1 can be present in the milk of lactating cows that have ingested feed contaminated with aflatoxin B1. The degree of feed contamination depends on the composition of the feed and is strongly influenced by temperature and humidity (Jiang et al., Reference Jiang, Ogunade, Vyas and Adesogan2021). According to the Codex Alimentarius, the allowance levels of aflatoxin B1 and M1 in foods are 20 and 0.5 ppb, respectively. Both toxins are classified as group 1 carcinogens according to the International Agency for Research on Cancer (Jiang et al., Reference Jiang, Ogunade, Vyas and Adesogan2021). The two types of ESL pasteurized milk analysed in the present study (whole ESL milk and 2% ESL milk) both showed very low denaturation of α-lactalbumin and β-lactoglobulin (0.98–1.06%). Higher denaturation levels around 2.8% have been reported for whey proteins in milk pasteurized at 72°C for 15 s (Guinee et al., Reference Guinee, Mulholland, Mullins, Corcoran, Connolly, Beresford, Mehra, Bernadette, Murphy, Stakelum and Harrington1998). Low denaturation of β-lactoglobulin is an important aim because the extent of denaturation is strongly correlated with the production of volatile sulphur compounds that cause cooked flavour in milk (Deeth, Reference Deeth2017).
Microbiological quality of raw milk
Hygienic practices must be followed at all stages of milk production and handling for satisfactory microbiological quality and safety of the milk. As evidenced in this study, the systematic application of Good Dairy Farming Practices on the farm resulted in lower TCC in raw milk, indicating that more sanitary conditions prevailed during the production, collection and handling of raw milk. In other words, the newly implemented safety and quality management system was successful in addressing and correcting hygiene deficiencies that initially negatively impacted milk microbial quality. The high initial TTC (6.9 log CFU/ml) was higher than 6.25 log CFU/ml, which is the accepted standard in Jordan for raw milk (JSMO, 2014). Subsequent reduction of TCC to 3.6 log CFU/ml is evidence of good sanitary practices. The International Dairy Federation specifies that standard plate counts (SPC), i.e., total number of aerobic bacteria in milk, lower than 4.3 log CFU/ml reflect good sanitary practices, whereas >5 log CFU/ml indicates serious deficiencies in milk production hygiene (JSMO, 2014).
Yeasts and moulds are usually transferred to milk from animal feed. In this study, the high total number of yeasts and moulds initially found in raw milk (4.4 log CFU/ml) was reduced to 2.2 log CFU/ml following the implementation of on-farm quality assurance, consistent with earlier findings of 2.49 log CFU/ml for yeasts and moulds in raw milk after improving collection practices (JSMO, 2014). Wouters et al. (Reference Wouters, Ayad, Hugenholtz and Smit2002) noted that yeasts and moulds tend to have the most detrimental effects in pasteurized milk and its derived products. Yeasts can grow rapidly due to their ability to utilize lactose, which can result in undesirable yeasty or fruity flavour and gas production. They also produce metabolites such as short-chain fatty acids and other compounds that can negatively affect the composition of the intestinal microbiota (Fernandez et al., Reference Fernandez, Hudson, Korpela and de Los Reyes-gavilan2015).
The effective reduction of psychrotrophic bacteria in this study, from 6.5 to 2.2 log CFU/ml in raw milk before and after systematic implementation of hygienic practices, provides further evidence of adequately improved sanitary practices on the farm. For this group of bacteria that can grow at low temperatures, the bacterial count in milk should be lower than 3 log CFU/ml to improve shelf life (Randolph, Reference Randolph2006). Gram-negative psychrotrophic bacteria include Pseudomonas, Enterobacter, Alcaligenes and Achromobacter (Quigley et al., Reference Quigley, O'Sullivan, Stanton, Beresford, Ross, Fitzgerald and Cotter2013). In milk, Pseudomonas spp. contribute about 50% of the gram-negative rods, and Pseudomonas fluorescens is predominant (Cousin, Reference Cousin1982). Pseudomonas spp. can produce heat-stable proteases and lipases. Some studies have linked the presence of Pseudomonas spp. in milk to the water used to clean the collecting vessels (Hiddink et al., Reference Hiddink, van Bruggen, Termorshuizen, Raaijmakers and Semenov2005).
S. aureus grows quickly under favourable conditions and can cause food poisoning as well as other health problems (Gebremedhin et al., Reference Gebremedhin, Ararso, Borana, Kelbesa, Tadese, Marami and Sarba2022). This pathogen produces heat-stable enterotoxins and is unique in its ability to coagulate plasma (Murray, Reference Murray2024). The main reasons for S. aureus presence in raw milk are mastitis, infected handlers, as well as deficient hygienic practices, including sneezing, coughing and improper handwashing while milking and handling equipment. In raw milk, high counts of S. aureus between 5.1 and 5.8 log CFU/ml are likely to result in enterotoxin production (Farhan and Salik, Reference Farhan and Salik2007). According to Dinges et al. (Reference Dinges, Orwin and Schlievert2000), S. aureus counts exceeding 3 log CFU/ml in raw milk increase the risk of enterotoxin production. In our study, S. aureus was detected at a relatively low level (2.2 log CFU/ml) in raw milk following the implementation of hygienic practices, a notable reduction from 6.4 log CFU/ml initially. Its presence was confirmed by the coagulation test.
On-farm improvement of hygienic practices also reduced the coliform count from 3.04 to 1.0 log CFU/ml. Coliform counts in excess of 2–3 log CFU/ml are evidence of unsanitary production practices. Coliforms can originate from various sources in the environment of the dairy farm, such as water, dirt, milking equipment, staff and various faecal sources (Kagkli et al., Reference Kagkli, Vancanneyt, Vandamme, Hill and Cogan2007). In raw milk, coliform levels >3.0 log CFU/ml indicate poor hygiene practices in the farm, improper cooling, or udder infection by coliforms (coliform mastitis) (Pantoja et al., Reference Pantoja, Reinemann and Ruegg2011). E. coli is an indicator of faecal contamination and unsanitary conditions for water and milk products (Mesele et al., Reference Mesele, Leta, Amenu and Abunna2023). High counts of E. coli can also result from improper cooling during milk transportation from farm to dairy plant (Adesiyun et al., Reference Adesiyun, Webb and Rahaman1995). In the present study, E. coli was not detected in raw milk following the improvement of hygienic practices at the farm, which meets the requirement for milk, i.e., no E. coli (Asming et al., Reference Asming, Aziz, Thani and Khalid2024). Likewise, Salmonella was not detected after implementation of on-farm hygienic practices. Faecal contamination is considered a major source of raw milk contamination with Salmonella and requires strict hygienic practices at the dairy farm to eliminate it in raw milk (Berge and Baars, Reference Berge and Baars2020). This pathogen is a serious health concern due to its ability to cause gastroenteritis, septicaemia and typhoid fever that can be life-threatening. A number of outbreaks of salmonellosis have been traced back to the contamination of raw milk and milk products with Salmonella (Sebastianski et al., Reference Sebastianski, Bridger, Featherstone and Robinson2022).
Bacterial spores are generally transferred to milk through faeces, feed, bedding material and soil. Faecal contamination of the udder can also transfer spores into raw milk. Bacterial spores can survive food processing. Under favourable conditions, they can germinate and cause milk spoilage and food-borne illnesses (Deeth, Reference Deeth2017). Anaerobic spore-forming bacteria were not found in raw milk in the present study, whereas aerobic spore-forming bacteria were initially found in relatively high numbers (4.5 log CFU/ml) and then reduced to 2.1 log CFU/ml when more hygienic production practices were implemented. This reduction is consistent with the recommendation for spore-forming bacteria in milk, which should not exceed 2 log CFU/ml. Several factors can influence the level of aerobic spore-forming bacteria in raw milk, including the type of silage fed to lactating cows (Slaghuis et al., Reference Slaghuis, Te Giffel, Beumer and Andre1997).
Microbiological quality and shelf life of pasteurized unfiltered whole milk
Pasteurization is designed to kill pathogenic microorganisms present in milk, reduce the number of spoilage bacteria, and inactivate specific undesirable enzymes to ensure milk safety and quality. HACCP implementation in our study greatly reduced the TCC in pasteurized milk from 6.5 and 2.9 log CFU/ml. Implementation of this system was also very effective for reducing the level of aerobic spore-forming bacteria. The total plate count of fluid pasteurized milk should not exceed 4.7 log CFU/ml (EC, 2001). A similar reduction in total count was reported by Nada et al. (Reference Nada, Ilija, Igor, Jelena and Ruzica2012) following the implementation of HACCP in a dairy plant. In Kassem et al.’s work (Kassem et al., Reference Kassem, Salem, Ahwal, Saddik and Gomaa2002), the total aerobic plate count of pasteurized milk dropped from 4.6 to 2.6 log CFU/ml following the application of HACCP.
Our findings further showed that S. aureus, yeasts and moulds were not present in pasteurized milk after HACCP implementation, despite being initially detected. Yeasts and moulds are generally not able to survive pasteurization. However, as noted by Jodral et al. (Reference Jodral, Linan, Acosta, Gallego, Rojas and Bentabol1993), they may occur in pasteurized milk as a result of recontamination during processing. Psychrotrophic bacteria, anaerobic spore-forming bacteria, Salmonella and E. coli were not found in pasteurized milk, both before and after HACCP implementation. Milk pasteurization effectively destroys the majority of psychrotrophic bacteria, except Bacillus spp. (Dai et al., Reference Dai, Hu, Pang, Zhang, Yu, Zhang, Wang, Wu, Lv and Lu2023). The presence of psychrotrophs in pasteurized milk can also result from recontamination of pasteurized milk (Doll et al., Reference Doll, Scherer and Wenning2017).
Milk shelf life is predominantly dependent on the microbiological quality of raw milk. Based on our findings, the shelf life of pasteurized milk after HACCP implementation in the dairy plant was estimated to be at least 7 days. HACCP and its prerequisite GMP programme offer practical monitoring tools and mechanisms to ensure that adequate corrective actions are taken when deviations are detected at critical points and critical control points. Adherence to and gradual refinement of this quality assurance system greatly improve the microbiological quality of raw milk and consequently of pasteurized milk (Nada et al., Reference Nada, Ilija, Igor, Jelena and Ruzica2012).
Microbiological quality and shelf life of whole and partly skimmed ESL milk
Bacterial cells and spores can be removed effectively from skimmed milk with limited fouling of the membrane when crossflow microfiltration is applied (Guerra et al., Reference Guerra, Jonsson, Rasmussen, Nielsen and Edelsten1997). In contrast, microfiltration of whole fat or partly skimmed milk gives rise to additional challenges because the dimensions of bacterial cells and native milk fat globules partly overlap (about 0.2–7 µm for bacterial cells and 0.2–10 µm for fat globules) (Tranchant and Selvamuthukumaran, Reference Tranchant and Selvamuthukumaran2020), leading to rapid membrane fouling. For E. coli, S. aureus, spore-forming bacteria, Salmonella, and yeasts and moulds, cell sizes of 1.1–1.5, 0.5, 1–100, 2–5 and 2–10 μm, respectively, have been reported (Ray and Bhunia, Reference Ray and Bhunia2013). About 90% of native fat globules range in diameter from 1 to 6 μm, a size range that is reduced to about 0.2–2 μm after homogenization (Singh, Reference Singh2019). Thus, careful selection of the microfiltration membrane pore size is required to microfilter milk with different fat contents. Gesan-Guiziou (Reference Gesan-Guiziou and Griffiths2010) reported that a membrane with pore size of 0.5–0.8 μm is efficient for lowering the microbial load of milk. In our study, the production of whole ESL milk microfiltered through a 0.8 μm pore size membrane after HACCP implementation met the microbiological standards of the Codex Alimentarius for pasteurized milk (CAC, 2011). Salmonella, coliforms and E. coli were not detected during the time frame considered (0–17 days), while S. aureus was only detected from day 8 to 17 (1.0–3.6 log CFU/ml, respectively). Tegegne and Tesfaye (Reference Tegegne and Tesfaye2017) indicated that S. aureus in the range 1.34–2.87 log CFU/ml in pasteurized milk represents a low risk for human health. However, higher populations exceeding 5 log CFU/g in food can produce enough enterotoxin (about 1 µg) to induce staphylococcal food poisoning, especially in susceptible individuals (Zhao et al., Reference Zhao, Yuan, Hu, Zhang, Li, Zhang and Liu2021; Aguiar et al., Reference Aguiar, Ferreira, Cieza, Silva, Miotto, Carvalho and Lindner2024). S. aureus can use several regulators to adapt to its environment and sustain cellular stresses or damage, including the sigma B factor which may provide protection against stressors such as heat, oxidants and alkaline conditions (Ranganathan et al., Reference Ranganathan, Johnson and Edwards2020). Moreover, S. aureus SOS response enables the repair of damage to DNA, while the CodY regulon enables the bacterium to sense and adapt to diverse metabolic conditions (Ranganathan et al., Reference Ranganathan, Johnson and Edwards2020).
Based on these results and considering that the ALP test became positive on day 20, we estimated that the shelf life of whole ESL milk produced after HACCP implementation was about two weeks. While pasteurization safely reduces the number of microorganisms in milk, microfiltration enables the effective removal of both vegetative and spore-forming microorganisms, which can result in sterile fluid milk without severe heat treatment (Grandison, Reference Grandison1996). Using a membrane of 0.87 µm pore size was found to reduce bacterial spores by a factor of 4–5 log, also enabling excellent flux rates of permeate with 100% transmission of casein (Guerra et al., Reference Guerra, Jonsson, Rasmussen, Nielsen and Edelsten1997). One of the aims of HACCP in this context is to minimize the microbial load of raw milk and avoid recontamination along the production process.
Partly skimmed ESL milk was prepared with a membrane of smaller pore size (0.45 μm), leading to the removal of a greater number of microorganisms, as indicated by lower values of TCC and longer shelf life compared to whole ESL milk. Similarly, Griep et al. (Reference Griep, Cheng and Moraru2018) achieved a greater reduction of skim milk microbial load by 2–3 log using a 0.5 μm pore size membrane compared to a 1.4 μm pore size membrane. Total count immediately after microfiltration of 2% milk was 1.9 log CFU/ml. Salmonella, coliforms and E. coli were not detected during the 24-day time frame considered, while S. aureus was only detected from day 9 to 24 (1–3 log CFU/ml, respectively). The ALP test became positive on day 25. Thus, the shelf life of 2% ESL milk after HACCP implementation was estimated to be three weeks.
Comparison of the microbiological quality and shelf life of the differently processed milk
Superior microbial quality and shelf life of 2% ESL milk compared to whole ESL milk and unfiltered pasteurized whole milk indicates that microfiltration through a 0.45 μm pore size membrane was most efficient in reducing the microbial load after the initial pasteurization step. These findings concur with previous studies demonstrating that effective removal of bacteria from milk can be achieved using 0.5 μm membrane pore size, enabling the production of pasteurized milk with a prolonged shelf life (Gesan-Guiziou, Reference Gesan-Guiziou and Griffiths2010). We further showed that negligible denaturation of whey proteins occurred under the conditions described in this report. While conventional (non-microfiltered) pasteurized milk is still considered safe for human consumption, ESL milk produced by combining pasteurization and microfiltration further reduces the microbial load and greatly extends the keeping time, which is one of the main drivers for the growing demand for ESL milk worldwide (Garcia and Rodríguez, Reference Garcia and Rodríguez2014). Shelf life determination in the current study was conducted at 4°C. Thermal abuse conditions have not been considered but can notably reduce the keeping time of ESL milk (Lott et al., Reference Lott, Martin, Dumpler, Wiedman and Moraru2023).
Conclusion
This case study showed that systematic implementation of on-farm and in-plant food safety programmes focused on GHP, GMP and HACCP significantly enhanced the microbial quality and shelf life of ESL milk produced from pasteurized and microfiltered milk. Microfiltration through a 0.45 and 0.8 µm pore size membrane enabled a shelf life of at least 3 weeks and 2 weeks for refrigerated 2% ESL milk and full-fat ESL milk, respectively, with negligible denaturation of the major whey proteins. Extended shelf life was associated with lower TCC. Findings highlight the effectiveness of the food safety management systems implemented, and emphasize the benefits afforded by microfiltration to further reduce the microbial load while retaining high nutritional quality. It is important that these strategies be adequately supported across the dairy supply chain to guarantee the safety and quality of ESL milk products.
Acknowledgements
The authors gratefully acknowledge the Jordan University of Science and Technology for research funding (20170364) and Université de Moncton, Canada, for provision of specialized resources. The study sponsors had no influence on data collection, analyses and interpretation and reporting of the findings.
Competing interests
The authors have no competing interests.