

Introduction
Agroforestry, the integration of trees, crops, and/or livestock within a unified land management system, offers multiple pathways to more sustainable land use. These systems can increase carbon sequestration, enhance soil quality, support biodiversity, contribute to farm income and livelihood security, and strengthen resilience to climate change (Glover et al. Reference Glover, Ahmed and Glover2013; Jose Reference Jose2009; Lorenz and Lal Reference Lorenz and Lal2014; Nair et al. Reference Nair, Nair, Kumar and Showalter2010). They may also generate social and cultural benefits, including recreational opportunities and, in some contexts, educational opportunities (Chen et al. Reference Chen, Jan, Chung and Liaw2025; Pietersen et al. Reference Pietersen, López-Acosta, Gomez-Díaz and Lascurain-Rangel2018; Sollen-Norrlin et al. Reference Sollen-Norrlin, Ghaley and Rintoul2020).
Despite these widely recognized benefits, temperate agroforestry remains unevenly adopted across regions. Although it is well established in several regions globally (e.g., Burgess and Rosati Reference Burgess and Rosati2018; Den Herder et al. Reference Den Herder, Moreno, Mosquera-Losada, Palma, Sidiropoulou, Freijanes, Crous-Duran, Paulo, Tomé, Pantera, Papanastasis, Mantzanas, Pachana, Papadopoulos, Plieninger and Burgess2017; Nair et al. Reference Nair, Kumar and Nair2022; Verma et al. Reference Verma, Sharma, Bhardwaj, Singh, Verma and Thakur2024), favorable biophysical conditions alone do not guarantee uptake. Institutional support, extension capacity, and market conditions also shape adoption. This variation makes region-specific support especially important in U.S. contexts, where empirical research on production-oriented agroforestry systems is comparatively limited. Here, much of the existing literature is based on perceived barriers or willingness to adopt under hypothetical scenarios (Arbuckle et al. Reference Arbuckle, Valdivia, Raedeke, Green and Rikoon2009; Strong and Jacobson Reference Strong and Jacobson2005; Valdivia and Poulos Reference Valdivia and Poulos2009; Workman et al. Reference Workman, Bannister and Nair2003), while practitioner-based evidence remains scarce (Brodt et al. Reference Brodt, Fontana and Archer2020; Frey and Fike Reference Frey and Fike2018; McRae Reference McRae2024). The current study examines the factors limiting adoption of production-oriented temperate agroforestry in New England and considers what they imply for regional support strategies.
Approaches to assessing drivers and barriers to agroforestry adoption
Agroforestry adoption is increasingly understood as a long-term land-use investment decision shaped by multiple objectives, including economic returns, resource stewardship, and risk reduction, under uncertainty about establishment, management requirements, and market access (Dessart et al. Reference Dessart, Barreiro-Hurlé and Van Bavel2019; Mercer Reference Mercer2004; Pattanayak et al. Reference Pattanayak, Evan Mercer, Sills and Yang2003). Studies show that interest in environmental co-benefits often coexists with concerns about long time horizons, labor and knowledge requirements, and whether existing production arrangements can accommodate agroforestry adoption (Bentrup et al. Reference Bentrup, Schoeneberger and Patel-Weynand2017; Keeley et al. Reference Keeley, Wolz, Adams, Richards, Hannum, von Tscharner Fleming and Ventura2019). Across this work, determinants of adoption tend to cluster around four interacting mechanisms: profitability and incentives; knowledge, labor, and management complexity; institutions and advisory capacity; and biophysical conditions.
These themes are seldom independent. Limited technical assistance can compound uncertainty around site design, while immature markets can intensify concerns about delayed returns. Accordingly, agroforestry research has used complementary approaches, ranging from analyses of adoption correlates to case studies that document lived producer experience and context-specific constraints (Lassoie et al. Reference Lassoie, Buck and Current2009; McRae Reference McRae2024; Orefice et al. Reference Orefice, Carroll, Conroy and Ketner2017). Related reviews also emphasize that behavioral and social factors, including attitudes, perceptions, and social influences, shape decisions alongside standard economic variables (Knowler and Bradshaw Reference Knowler and Bradshaw2007; Pannell et al. Reference Pannell, Marshall, Barr, Curtis, Vanclay and Wilkinson2006). In Switzerland, for example, reputational concerns can deter agroforestry even when farmers recognize ecosystem-service benefits (Sereke et al. Reference Sereke, Dobricki, Wilkes, Kaeser, Graves, Szerencsits and Herzog2016). Multi-country case studies likewise show that administrative burden, knowledge gaps, and farm goals influence whether agroforestry is perceived as worthwhile (Rois-Díaz et al. Reference Rois-Díaz, Lovric, Lovric, Ferreiro-Domínguez, Mosquera-Losada, Den Herder, Graves, Palma, Paulo, Pisanelli, Smith, Moreno, García, Varga, Pantera, Mirck and Burgess2018). Further, studies across multiple U.S. regions report that landowners often value environmental benefits but remain constrained by limited technical support, establishment expenses, and uncertainty surrounding economic returns (Stubblefield et al. Reference Stubblefield, Smith, Lovell, Wilson, Hendrickson and Cai2025; Workman et al. Reference Workman, Monroe and Long2005). A recent U.S.-focused review of silvopasture perspectives identifies knowledge gaps, ambiguity regarding tree-forage-livestock interactions, and management costs as recurring barriers, while commonly citing diversification and animal welfare as benefits (Smith et al. Reference Smith, Bentrup, Kellerman, MacFarland, Straight, Ameyaw and Stein2022).
In New England specifically, several states rank among the highest nationally in the share of farms reporting agroforestry practices, yet agroforestry still represents only a minority of farms overall (Kellerman et al. Reference Kellerman, Feibel, Smith, Bentrup, Batcheler and MacFarland2025; USDA National Agricultural Statistics Service 2024). Perhaps the most relevant comparisons for the region come from the Mid-Atlantic and adjacent Northeast. Agroforestry practitioners in the former have emphasized resilience, shade, and diversification as distinct advantages while also pointing to labor demands, establishment challenges, limited information, and land constraints that restrict expansion (McRae Reference McRae2024; Poudel et al. Reference Poudel, Ely and Fike2025). In upstate New York, Orefice et al. (Reference Orefice, Carroll, Conroy and Ketner2017) provided early baseline evidence on silvopasture adoption, identifying woodland conversion and shade provision as key motivations. Against this backdrop, the zone’s fragmented land ownership (Butler et al. Reference Butler, Butler, Caputo, Dias, Robillard and Sass2021) and challenging site conditions, particularly cool climates, short growing seasons, and, in some parts, glaciated soils (Demeritt Reference Demeritt1991), may constrain adoption. The Northeast has a long history of tree-based land use, but Claggett et al. (Reference Claggett, Coulter, Krause, Mawhorter, Schoeneberger, Bentrup and Patel-Weynand2017) suggest that more intentionally designed agroforestry systems here remain relatively uncommon. At the same time, proximity to urban markets (Donahue et al. Reference Donahue, Burke, Anderson, Beal, Kelly, Lapping, Ramer, Libby and Berlin2014), growing opportunities for regional agroforestry products (Regenerative Design Group 2020), and existing practitioner networks (Roberts Reference Roberts2018) provide a plausible foundation for expansion in the region.
Our approach
To the best of our knowledge, literature has yet to systematically prioritize the factors shaping agroforestry adoption in New England, a region characterized by long-established forests and small family farms. Hence, this study (i) identifies the most influential drivers and barriers and (ii) quantifies their relative priorities and interdependencies, that is, how one factor can amplify or dampen another in the final weighting. A Strengths-Weaknesses-Opportunities-Threats (SWOT)-Analytic Network Process (ANP) framework is applied to account explicitly for interdependencies among drivers and barriers, extending prior SWOT-Analytic Hierarchy Process (AHP) and ANP-based approaches.Footnote 1 SWOT provides a structured way to organize internal strengths and weaknesses and external opportunities and threats identified by practitioners (see Jahan et al. Reference Jahan, Rahman, Islam, Rezwan-Al-Ramim, Tuhin and Hossain2022; Srinidhi et al. Reference Srinidhi, Chauhan and Sharma2007), but it does not by itself generate rankings. SWOT-AHP addresses this limitation by converting pairwise comparisons into quantitative priority weights (Etongo et al. Reference Etongo, Bristol, Epule, Bandara and Sinon2023; Laroche et al. Reference Laroche, Domon, Gélinas, Doyon and Olivier2019; Shrestha et al. Reference Shrestha, Alavalapati and Kalmbacher2004). While ANP has been applied to agroforestry decision contexts using expert-defined criteria (Lovrić et al. Reference Lovrić, Rois-Díaz, den Herder, Pisanelli, Lovrić and Burgess2018), the current work integrates SWOT with ANP using practitioner-derived factors elicited through interviews, subsequently weighted through pairwise comparisons.
Methods
Sampling plan
This study focuses on three agroforestry systems relevant to New England, silvopasture, forest farming, and multistrata polycultures (“food forests”).Footnote 2 These systems were selected because they represent production-oriented agroforestry options in U.S. practice whose expansion depends in part on viable product markets. Silvopasture is increasingly documented on farms in New England and the broader Northeast (Orefice et al. 2017; Smith et al. Reference Smith, Bentrup, Kellerman, MacFarland, Straight, Ameyaw and Stein2022), while forest farming is recognized by USDA as a distinct agroforestry practice based on cultivating high-value crops under a managed forest canopy (Chamberlain et al. Reference Chamberlain, Davis, Munsell, Garrett, Jose and Gold2021; Clark and Nicholas Reference Clark and Nicholas2013; USDA National Agroforestry Center 2023). Multistrata polycultures are included as a related perennial production system since they can combine market-oriented crop production with agroecological design in ways relevant to small diversified farms in the region. Conservation plantings such as windbreaks and riparian buffers were excluded because they are often motivated by different objectives and are less comparable to the producer decision context examined here.
Participants were identified through snowball sampling, beginning with a small group of agroforestry practitioners already known to the research team. Each participant was asked to recommend other practitioners actively managing one of the three focal systems in New England, and recruitment proceeded through successive referral waves. Snowball sampling was appropriate as agroforestry practitioners in the region were not easily identified through a conventional sampling frame, making referral-based recruitment a practical way to reach this dispersed population (Handcock and Gile Reference Handcock and Gile2011; Naderifar et al. Reference Naderifar, Goli and Ghaljaie2017). In addition, because AHP/ANP pairwise-comparison tasks impose substantial respondent burden, small but knowledgeable participant groups are often relied upon (Ananda and Herath Reference Ananda and Herath2003; Saaty and Vargas Reference Saaty and Vargas2012). In this study, eligible participants were farms in New England actively managing at least one of the three identified agroforestry systems, provided the system covered a minimum of 0.5 acres and had been established for at least five years. In total, 27 agroforestry practitioners participated in the initial round of interviews. Participant locations are shown in Figure 1. Additional detail on the study area, system definitions, and selection rationale is provided in the SI.
Locations of agroforestry practitioners interviewed across the six New England states, Maine (ME), New Hampshire (NH), Vermont (VT), Massachusetts (MA), Connecticut (CT), and Rhode Island (RI). Green dots represent onsite interviews, while orange dots indicate online interviews. The inset map shows the location of New England within the northeastern United States, with individual states highlighted.

Data collection
Initial interviews
Between mid-June and mid-December 2024, interviews were conducted in person at 17 farm sites and through 10 online meetings across the six New England states (Figure 1). Each interview followed a structured protocol designed to elicit participants’ perceptions of the strengths, weaknesses, opportunities, and threats associated with agroforestry adoption on their land. Interviews typically lasted 60 to 90 minutes and covered management goals, resource constraints, motivations, and broader perspectives on agroforestry systems. All interviews were audio-recorded with participant consent. Recordings were then transcribed into text, and the resulting transcripts were organized into worksheets and reviewed for analysis. For each SWOT category, the three most frequently mentioned factors from the full set of coded factors used to inform survey development (Table S1) were selected for inclusion in the follow-up SWOT-ANP survey. All procedures were approved by the University of New Hampshire Institutional Review Board (IRB-FY2024-271; Spring 2024), and informed consent was obtained prior to data collection.
Surveys
The follow-up survey was administered approximately ten weeks after the final interview. Interview participants were contacted by email and invited to complete an online survey in Qualtrics (Provo, UT). To reduce respondent burden, the survey was designed to take less than 15 minutes to complete. Participants were asked to enter their farm name for verification and a $75 prepaid Visa debit card was offered as an incentive for full participation. Twenty-three valid survey responses were analyzed.
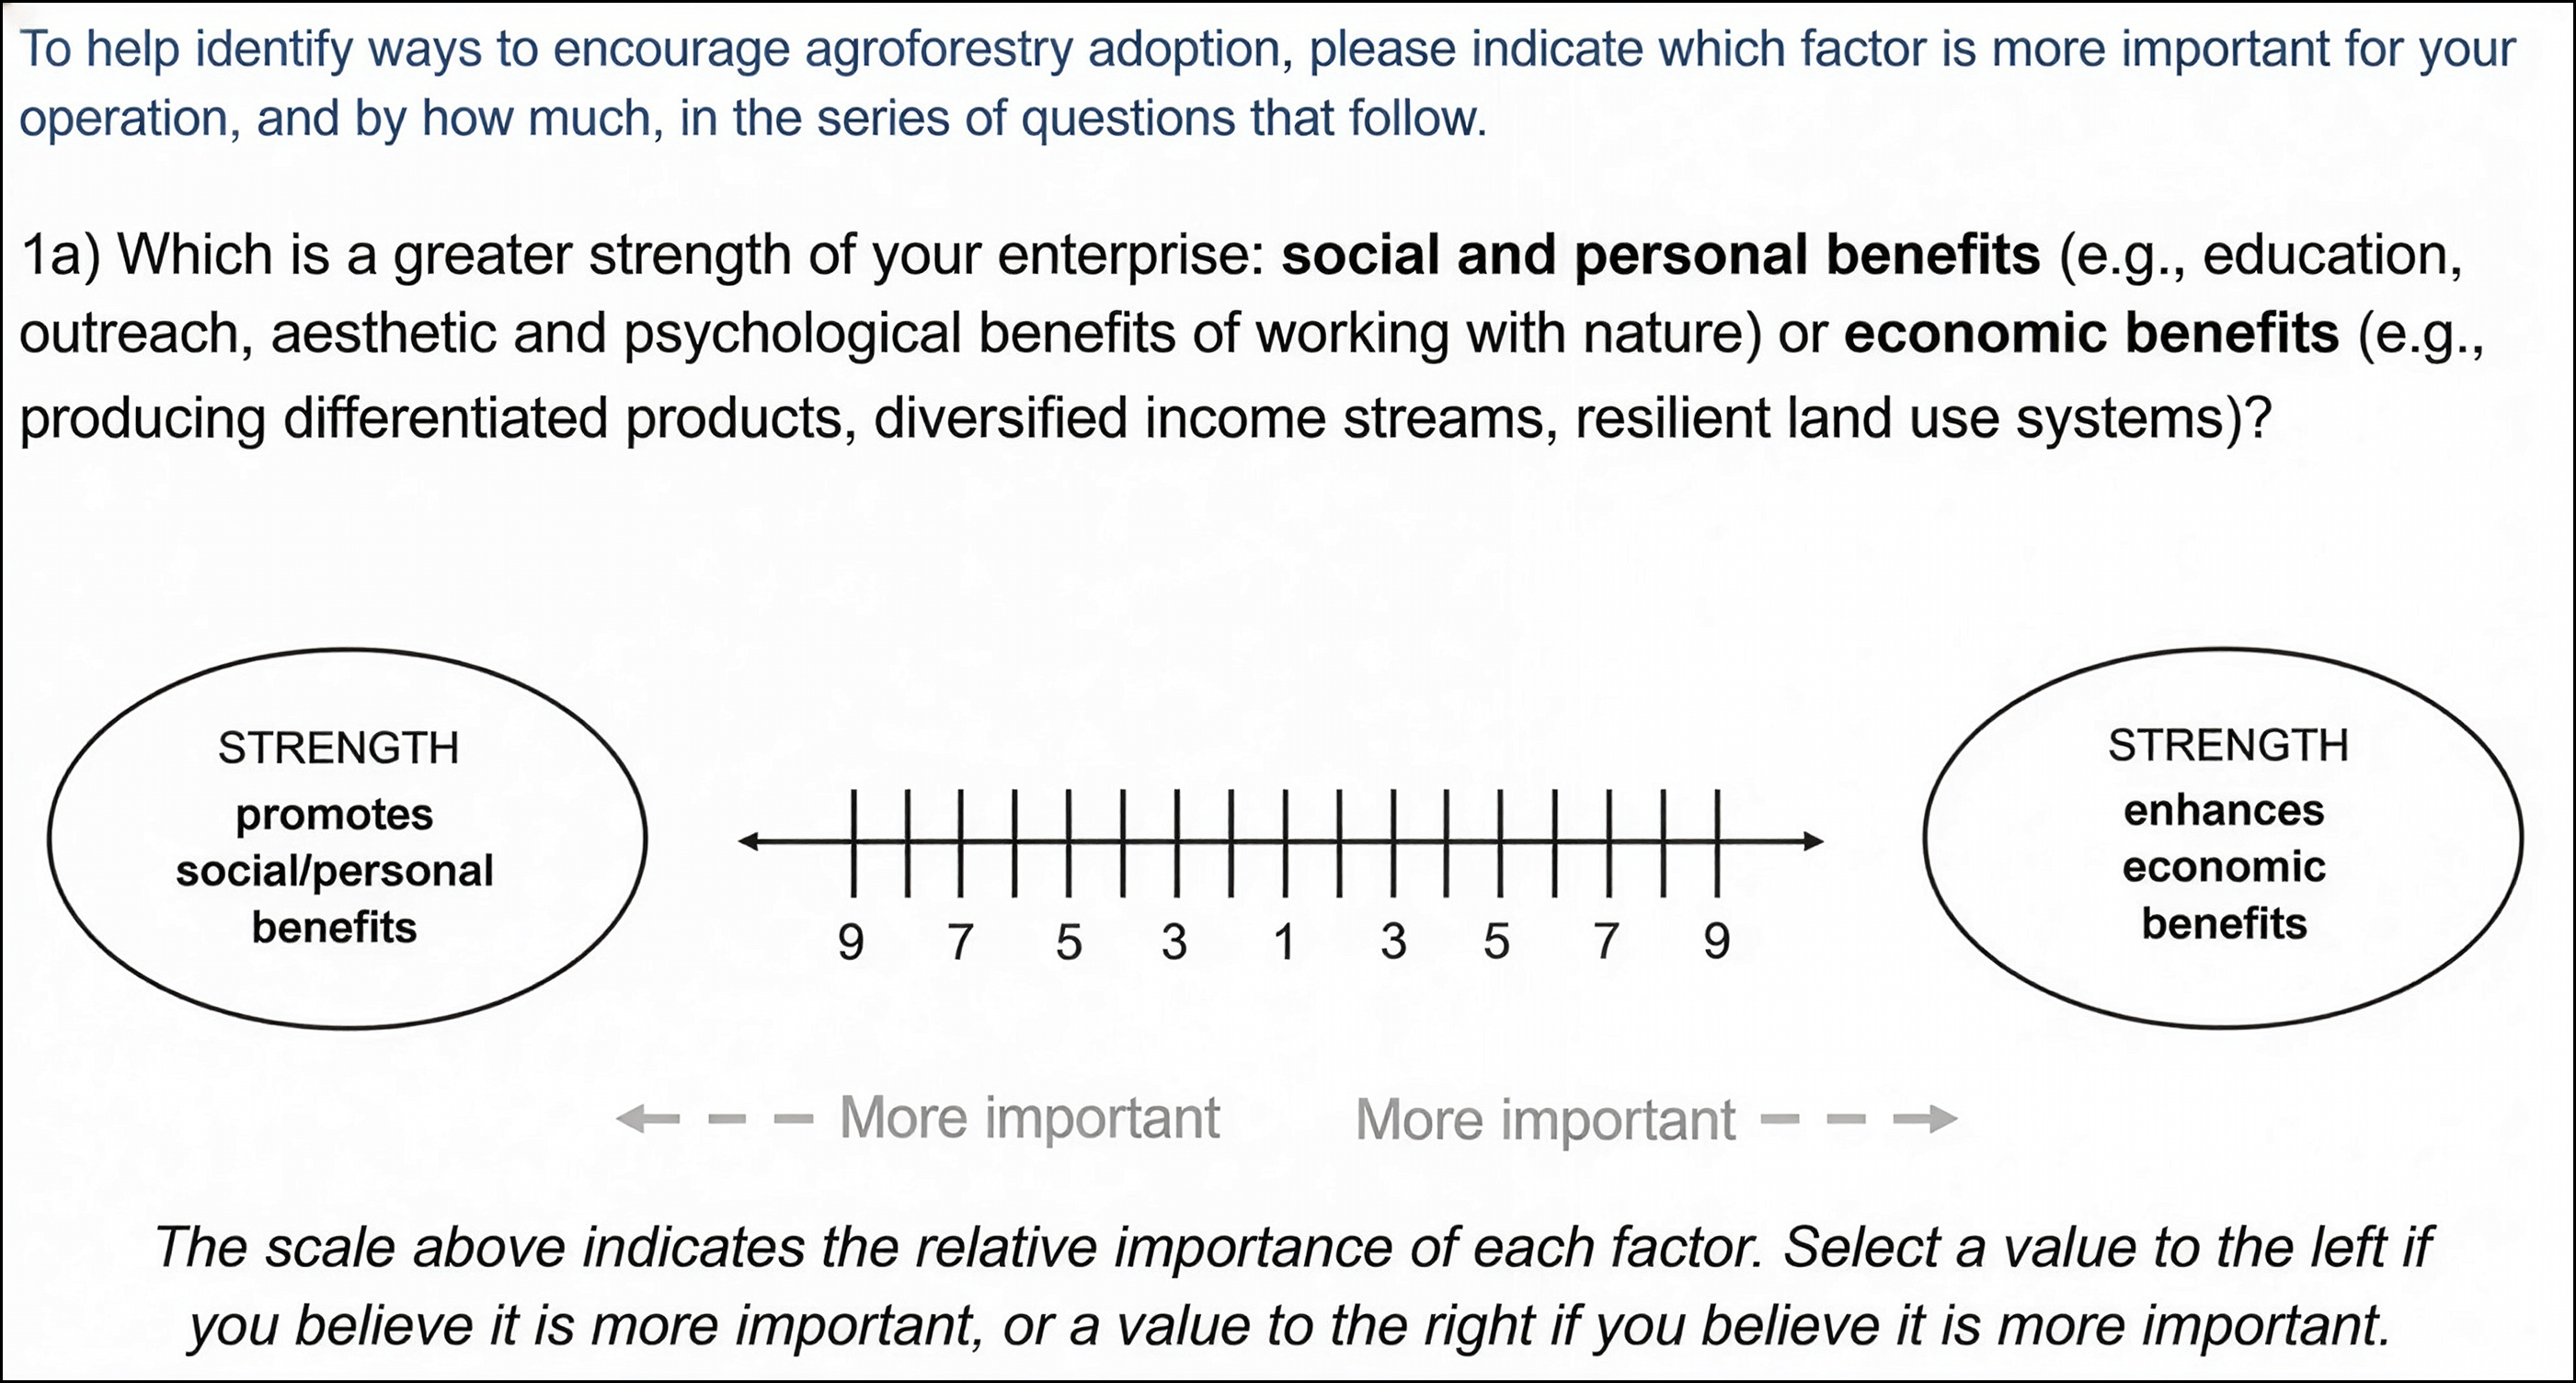
The instrument consisted of 24 pairwise comparisons. The first 12 elicited within-category tradeoffs among the three factors in each SWOT category. The second 12 elicited directional across-category tradeoffs among the four SWOT categories, asking respondents to judge which categories were more important for realizing strengths, overcoming weaknesses, taking advantage of opportunities, and preventing threats. Table S2 presents the conceptual format of the pairwise comparison questions. Pairwise-comparison responses in AHP/ANP are ratio-scale intensity judgments, not equal-interval measurements. Each question presented two factors and asked respondents to indicate which was more important for their operation and by how much using Saaty’s 1–9 ratio scale (Saaty Reference Saaty1977). The scale was displayed as a left-right slider with verbal anchors, where 1 indicated equal importance and 9 indicated extreme importance of one factor over the other (see Figure 2 for an annotated example). Group judgments were aggregated using geometric means, which preserve the reciprocal structure of the comparison matrices and allow assessments of internal coherence using standard consistency checks.
Example pairwise-comparison item from the SWOT–ANP survey. Respondents compared two factors and indicated which was more important for their operation and by how much using Saaty’s 1–9 ratio scale (1 = equal importance; larger values indicate stronger preference). Values selected toward the left indicate greater importance of the left-hand factor (social/personal benefits), and values toward the right indicate greater importance of the right-hand factor (economic benefits).
SWOT-ANP
Model framework
The SWOT-ANP procedure converts qualitative judgments related to “factors that matter more, and by how much” into quantitative priority weights. We analyzed the collected pairwise-comparison data to estimate (i) the relative importance of factors within each category and (ii) the relative importance of the four SWOT categories and their interdependencies. These steps yield local within-category and global priority weights that can be used to rank the various factors.
Pairwise-comparison responses were organized by constructing a reciprocal comparison matrix,
 ${\bf A}_{k},$
for each SWOT category k ∈ {S, W, O, T}. Each matrix is n
k
× n
k
, where n
k
= 3 is the number of practitioner-derived factors in category k. The fundamental reciprocal property requires that:
 $a_{ij}^{\left( k \right)}\; = \;{1 \over {a_{ji}^{\left( k \right)}}}\;$
where
 $a_{ij}^{\left( k \right)}$
denotes the entry in row i, column j of matrix
 ${\bf A}_{k}$
, representing the judged importance of factor i relative to factor j within category k; by reciprocity,
 $a_{ii}^{\left( k \right)} = 1$
. Thus, four within-category reciprocal matrices (one for each SWOT category) were constructed. These four matrices,
 ${\bf A}_{S}$
,
 ${\bf A}_{W}$
,
 ${\bf A}_{O}$
, and
 ${\bf A}_{T}$
, are referred to as the within-category comparison matrices.
The structure of each pairwise comparison matrix takes the following general form:
 ${{\bf{A}}_k} = \;\left[ {\matrix{ 1 & {{a_{12}}} & \cdots & {{a_{1n}}} \cr {{1 \over {{a_{12}}}}} & 1 & \cdots & {{a_{2n}}} \cr \vdots & \vdots & \ddots & \vdots \cr {{1 \over {{a_{1n}}}}} & {{1 \over {{a_{2n}}}}} & \cdots & 1 \cr } } \right]$
To obtain the relative importance of each factor, a priority vector
 ${\bf w}_{k}$
was computed from each within-category matrix
 ${\bf A}_{k}$
, where each element w
ki
represents the weight of factor i within its respective category. The priority vector is derived by solving the eigenvector equation:
 $ \left({\bf A}_{k}-\lambda _{\max }{\bf I}\right){\bf w}_{k}=0 $
where λmax is the largest eigenvalue of matrix
 ${\bf A}_{k}$
and
 ${\bf I}$
is the identity matrix.
The resulting priority vectors were normalized so that their elements summed to 1. Each group reciprocal matrix was constructed by taking the geometric mean of individual judgments for each pairwise comparison, a standard aggregation approach that preserves reciprocity in group ANP settings.Footnote 3
After the within-category comparisons were completed, category-level priorities were estimated in two stages. Let
 ${\bar r_{ij}}$
denote the geometric mean of respondent judgments for the directional comparison of SWOT category i relative to SWOT category j. First, a baseline reciprocal 4 × 4 comparison matrix,
 ${\bf H}$
, was constructed for the four SWOT categories by combining the two directional versions of each unordered category pair:
 ${h_{ij}} = {\left( {{{\bar r}_{ij}}{1 \over {{{\bar r}_{ji}}}}} \right)^{1/2}}={\left( {{{{{\bar r}_{ij}}} \over {{{\bar r}_{ji}}}}} \right)^{1/2}},{h_{ji}} = {1 \over {{h_{ij}}}},{h_{ii}} = 1$
Thus, with categories ordered as S, W, O, T, the baseline category matrix was:
 ${\bf{H}} = \left[ {\matrix{ 1 & {{h_{SW}}} & {{h_{SO}}} & {{h_{ST}}} \cr {1/{h_{SW}}} & 1 & {{h_{WO}}} & {{h_{WT}}} \cr {1/{h_{SO}}} & {1/{h_{WO}}} & 1 & {{h_{OT}}} \cr {1/{h_{ST}}} & {1/{h_{WT}}} & {1/{h_{OT}}} & 1 \cr } } \right]$
Second, the directional across-category judgments were used to construct four separate 3 × 3 reciprocal dependency matrices, one for each focal category: realizing Strengths, overcoming Weaknesses, taking advantage of Opportunities, and preventing Threats. For a focal category q, the dependency matrix
 ${\bf D}^{(q)}$
compared the three remaining SWOT categories, excluding the focal category itself, and had the general form:
 ${{\bf{D}}^{\left( q \right)}} = \left[ {\matrix{ 1 & {d_{12}^{\left( q \right)}} & {d_{13}^{\left( q \right)}} \cr {1/d_{12}^{\left( q \right)}} & 1 & {d_{23}^{\left( q \right)}} \cr {1/d_{13}^{\left( q \right)}} & {1/d_{23}^{\left( q \right)}} & 1 \cr } } \right]$
where d
12
(q), d
13
(q), and d
23
(q) are the geometric-mean pairwise ratios among the three non-focal categories for focal category q. The category orders were W, O, T for D
(S); S, O, T for D
(W); S, W, T for D
(O); and S, W, O for D
(T). The normalized priority vector from each dependency matrix is denoted
 ${\bf p}^{(q)}$
, where p
i
(q) represents the relative contribution of category i to focal category q.
These dependency priority vectors were then used to form the interdependence matrix
 ${\bf C}$
:
 ${\bf{C}} = \left[ {\matrix{ 1 & {p_S^{\left( W \right)}} & {p_S^{\left( O \right)}} & {p_S^{\left( T \right)}} \cr {p_W^{\left( S \right)}} & 1 & {p_W^{\left( O \right)}} & {p_W^{\left( T \right)}} \cr {p_O^{\left( S \right)}} & {p_O^{\left( W \right)}} & 1 & {p_O^{\left( T \right)}} \cr {p_T^{\left( S \right)}} & {p_T^{\left( W \right)}} & {p_T^{\left( O \right)}} & 1 \cr } } \right]$
The off-diagonal entries of
 ${\bf C}$
represent directional category-to-category influence, while the diagonal entries retain each focal category’s own baseline contribution. Final interdependent category weights were obtained as:
 $ \widetilde{{\bf w}}^{ANP}={\bf C}{\bf w}^{AHP}, \ \ \ \ {\bf w}^{ANP}=\widetilde{{\bf w}}^{ANP}/{\bf 1}^{{\rm \top\ }}\widetilde{{\bf w}}^{ANP} $
where
 ${\bf w}^{ANP}$
is the normalized vector of interdependent SWOT category weights.
The within-category priority vectors were then combined with the interdependent category weights to obtain global priorities:
 $ {\bf w}^{\textit{global}}={1 \over Z}\left({w}_{S}^{ANP}\cdot {\bf w}_{S}\oplus {w}_{W}^{ANP}\cdot {\bf w}_{W}\oplus {w}_{O}^{ANP}\cdot {\bf w}_{O}\oplus {w}_{T}^{ANP}\cdot {\bf w}_{T}\right) $
where
 ${\bf w}_{S},{\bf w}_{W},{\bf w}_{O},$
and
 ${\bf w}_{T}$
are the 3 × 1 local priority vectors for the respective Strengths, Weaknesses, Opportunities, and Threats categories; w
S
ANP
, w
W
ANP
, w
O
ANP
, and w
T
ANP
are the corresponding scalar interdependent category weights; and the operator ⊕ denotes concatenation, yielding a 12 × 1 global priority vector for all SWOT factors. Z is a normalization constant equal to the sum of the concatenated weighted priority vector.
Since pairwise comparisons can be internally inconsistent, for example, A > B, B > C, but C > A, we assessed the internal consistency of each reciprocal comparison matrix used in the analysis. Let ℳ denote the set of nine reciprocal comparison matrices:
 $ \mathcal{M}=\left\{{\bf A}_{\it S}, {\bf A}_{\it W},{\bf A}_{\it O}, {\bf A}_{\it T}, {\bf H},{\bf D}^{\left(\it S\right)},{\bf D}^{\left(\it W\right)}, {\bf D}^{\left(\it O\right)}, {\bf D}^{\left(\it T\right)}\right\} $
For notational compactness, let
 ${\bf M}_{m}\in \mathcal{M}$
denote the reciprocal comparison matrix indexed by m. For each
 ${\bf M}_{m}$
, the consistency index was calculated as:
 $ CI_{m}={\lambda _{\max, m}-n_{m} \over n_{m}-1} $
and the consistency ratio as:
 $ CR_{m}={CI_{m} \over RI_{{n_{m}}}} $
where λ
max , m
is the principal eigenvalue of
 ${\bf M}_{m}$
, n
m
is the order of that matrix, and RI
n
m
is Saaty’s random index, defined as the average consistency index expected from a large set of randomly generated reciprocal pairwise-comparison matrices of order n
m
. Equation (10) defines the matrices included in the consistency analysis, while Equations (11) and (12) define the consistency-index and consistency-ratio calculations, respectively. RI
n
m
thus provides a benchmark for the inconsistency expected by chance, against which the observed CI
m
is normalized to obtain the consistency ratio. In a fully consistent reciprocal matrix, λ
max , m
= n
m
, so CI
m
= 0; larger values of CI
m
and CR
m
indicate greater inconsistency. A matrix was considered acceptably consistent when CR
m
< 0.10.
Sensitivity analysis
We applied a one-factor-at-a-time perturbation test to examine whether rankings were robust to modest changes in the elicited judgments (Sayed et al. Reference Sayed, Ali, Alrashdi, Sallam, Abdel-Basset and Ismail2025). For a selected reciprocal comparison matrix, each unique pairwise-comparison ratio, a
ij
, in the upper triangle (i < j), was adjusted in turn by a factor of (1±δ), with δ = 0.10, so that
 $\tilde a$
ij
= a
ij
(1±δ). The reciprocal entry was updated as
 $\tilde a$
ji
= 1/
 $\tilde a$
ij
. This procedure was applied to each of the four within-category matrices and to the baseline 4 × 4 category comparison matrix,
 ${\bf H}$
, similar to that used in prior AHP-based robustness checks (Maceiras et al. Reference Maceiras, Alfonsin, Feijoo, Perez-Rial and Lopez-Granados2025).
Thus, for each 3 × 3 within-category matrix, the three unique pairwise-comparison ratios were perturbed in separate scenarios. The six unique pairwise-comparison ratios were perturbed in the same manner for the baseline category matrix
 ${\bf H}$
. After each perturbation, the full weighting procedure was repeated. Local priority vectors were recalculated for the within-category matrices, and baseline category weights were recomputed from
 ${\bf H}$
. Interdependent category weights were then updated using the fixed dependency matrix,
 ${\bf C}$
, and the resulting global priority vector was recalculated. Sensitivity was summarized by comparing the minimum and maximum global priority attained by each SWOT factor across all perturbation scenarios.
Results
Sample and descriptive context
The share of each site’s land base managed under silvopasture, forest farming, and/or multistrata polyculture varied across operations (Figure 3). Sampled sites ranged from 1 to 1,000 acres. Nearly half of respondents managed fewer than 50 acres. The median farm size was 48.5 acres, whereas the mean was 175 acres, indicating a right-skewed distribution driven by a small number of very large operations. Silvopasture and multistrata polycultures were observed at 14 sites and 15 sites respectively, while forest farming was present at 7 sites. One-third of all sites practiced two of the three focal systems.
Proportional land use by farm size and agroforestry practice among surveyed sites in New England (n = 27). Each horizontal bar represents one site (ordered by total acreage), and stacked segments show the proportion of the site’s total acreage managed as forest farming, multistrata polyculture, and/or silvopasture (proportions sum to 1 for each site). Following USDA National Agroforestry Center practice classifications, silvopasture refers to the managed integration of trees, forage (grasses, legumes), and livestock on the same piece of land (NRCS Conservation Practice Standard 381) and forest farming refers to cultivation of shade-tolerant crops beneath a managed tree canopy (NRCS Conservation Practice Standard 379). Multistrata polyculture were described as intentionally layered perennial plantings with multiple vertical strata, akin to “food forests.”

Interviews revealed a range of management goals, with strong emphasis on environmental improvement and multifunctional land use. Healthier soils were the most frequently reported goal, followed by broader environmental goals such as biodiversity and ecosystem function. Participants also emphasized stewardship, more efficient use of existing land, and stronger community connections.
SWOT-ANP priorities
CRs were evaluated against Saaty’s conventional consistency-ratio threshold of CR < 0.10, which indicates acceptable internal consistency of a reciprocal pairwise-comparison matrix. The four within-category matrices and the baseline category matrix satisfied this criterion. Among the four directional dependency matrices, three also satisfied this criterion, whereas the matrix associated with overcoming Weaknesses showed somewhat higher inconsistency (CR = 0.136). Across the interdependent category weights, Threats received the highest weight (0.311). The remaining categories clustered at lower weights, with Opportunities (0.238) and Weaknesses (0.235) virtually tied, followed by Strengths (0.217).
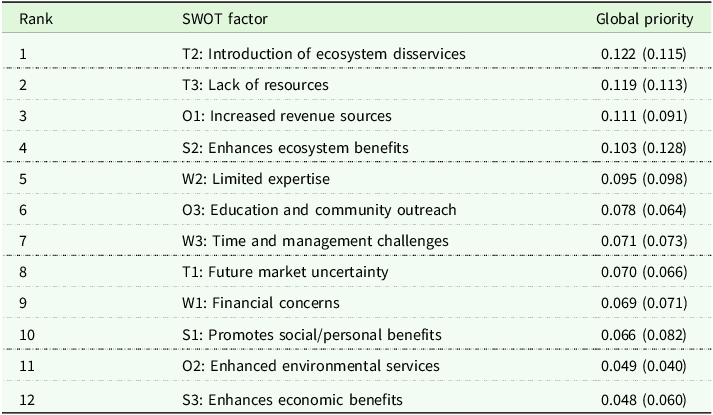
Global priority weights, which combine within-category priorities with cross-category importance,Footnote 4 are reported in Table 1 and illustrated in Figure 4. For readability, factors are referred to by their short codes after first mention. The two most influential factors overall were Introduction of ecosystem disservices (T2, 0.122) and Lack of resources (T3, 0.119). Consistent with T2, participants described biophysical risks such as resource competition, reduced understory performance, and pest or wildlife pressure (e.g., deer browse and rodents). Several noted that increased habitat could be a double-edged sword, with biodiversity gains sometimes accompanied by crop damage or predation risk. Consistent with T3, participants described limited capital, labor, machinery, planting stock, and access to service providers as major barriers to establishment.
Radial quadrant plot of global priority weights for SWOT factors influencing agroforestry adoption (SWOT-ANP). Each point shows a factor code and its global priority weight (in parentheses); ray length is proportional to that weight. Factor codes and descriptive titles are provided in the in-panel key. Axis limits were set slightly beyond the maximum observed weight to improve readability. The quadrant layout is directional and does not imply negative scores.

Global priority weights for SWOT factors influencing agroforestry adoption, derived from the SWOT-ANP analysis. Higher values indicate greater overall influence on adoption decisions; global priorities are normalized to sum to 1 across all factors. Values in parentheses report priorities from an AHP-style hierarchical model that omits interdependencies (i.e., no cross-factor feedback), shown for comparison. Factor codes indicate SWOT quadrant

Table 1. Long description
A table with 12 rows and 3 columns. The columns are labeled Rank, SWOT factor, and Global priority. The table ranks various SWOT factors by their global priority weights. Row 1: Rank 1, SWOT factor T2: Introduction of ecosystem disservices, Global priority 0.122 (0.115). Row 2: Rank 2, SWOT factor T3: Lack of resources, Global priority 0.119 (0.113). Row 3: Rank 3, SWOT factor O1: Increased revenue sources, Global priority 0.111 (0.091). Row 4: Rank 4, SWOT factor S2: Enhances ecosystem benefits, Global priority 0.103 (0.128). Row 5: Rank 5, SWOT factor W2: Limited expertise, Global priority 0.095 (0.098). Row 6: Rank 6, SWOT factor O3: Education and community outreach, Global priority 0.078 (0.064). Row 7: Rank 7, SWOT factor W3: Time and management challenges, Global priority 0.071 (0.073). Row 8: Rank 8, SWOT factor T1: Future market uncertainty, Global priority 0.070 (0.066). Row 9: Rank 9, SWOT factor W1: Financial concerns, Global priority 0.069 (0.071). Row 10: Rank 10, SWOT factor S1: Promotes social/personal benefits, Global priority 0.066 (0.082). Row 11: Rank 11, SWOT factor O2: Enhanced environmental services, Global priority 0.049 (0.040). Row 12: Rank 12, SWOT factor S3: Enhances economic benefits, Global priority 0.048 (0.060).
The highest-ranked opportunity, and third-ranked factor overall, was Increased revenue sources (O1, 0.111). Interviewees linked this factor to diversification strategies intended to improve near-term cash flow. Education and community outreach (O3, 0.078) was associated with peer learning and knowledge sharing, whereas Enhanced environmental services (O2, 0.049) was often described as a benefit that depends on successful long-term establishment and management.
A similar timing pattern appeared within Strengths. Enhances economic benefits (S3, 0.048) ranked lowest within the category, with respondents describing profitability as something that materializes only after substantial learning and, in many cases, several years. By contrast, Enhances ecosystem benefits (S2, 0.103), described as improved soil structure, microclimate regulation, and habitat value, ranked highest, while Promotes social/personal benefits (S1, 0.066) ranked in between.
Within Weaknesses. Limited expertise (W2, 0.095) and Time/management challenges (W3, 0.071) ranked above Financial concerns (W1, 0.069). Producers described steep learning curves and the coordination required to manage complex tree-crop-livestock systems. Financial concerns were also raised but were often seen as more manageable when producers had sufficient know-how, planning time, and operational capacity.
Sensitivity analysis showed the global priorities were stable under modest (±10%) one-at-a-time perturbations of the aggregated within-category pairwise-comparison ratios and the baseline category comparison matrix (Figure 5). Across all scenarios, the two leading threats remained the top-ranked factors, although their ranges overlapped such that the order of first and second could switch. The lowest-ranked factors also remained at the bottom of the distribution. Overall, the ranking structure was unchanged.
One-way sensitivity analysis of global SWOT factor priority weights. Points show baseline global priorities; horizontal bars show the range in priorities when mean pairwise-comparison inputs within the weaknesses and opportunities matrices are perturbed by ±10% (one comparison at a time) while all other inputs are held constant. Factors are ordered by the baseline ranking. Wider bars indicate greater sensitivity of the global ranking to modest judgment changes, whereas narrow bars indicate greater robustness.

Discussion
Establishment-stage risk and implementation capacity
Ecological and social co-benefits were widely recognized, but the results indicate that adoption priorities were shaped foremost by constraints arising during establishment. The two highest-ranked factors overall, Introduction of ecosystem disservices (T2) and Lack of resources (T3), suggest producers face both biophysical risk and limited capacity to implement systems reliably. Interestingly, T2 underscores the importance of well-matched designs and seemingly complements the latter, which reflects the practical capacity needed to implement adoption. Specific concerns included competition for light and moisture, reduced understory yields, pest and wildlife pressure, and the difficulty of securing labor, planting stock, equipment, and service providers. Similar constraints have been reported in temperate agroforestry studies, which emphasize knowledge gaps, management/establishment challenges, and the need for practical, locally relevant technical support (Frey and Fike Reference Frey and Fike2018; Mayerfeld et al. Reference Mayerfeld, Keeley, Rickenbach, Rissman and Ventura2023; McRae Reference McRae2024; Romanova et al. Reference Romanova, Gold and Hendrickson2022a, Reference Romanova, Gold, Hall and Hendrickson2022b).
Although Weaknesses ranked lower as a category, interview narratives indicate that limited expertise, management complexity, and labor demands can still constrain adoption even where interest is present, consistent with prior agroforestry research (Batcheler et al. Reference Batcheler, Ostrom, Carpenter-Boggs, Swanson, Shults and Brausieck2024; Ford et al. Reference Ford, Zamora, Blinn, Vaughan and Burkett2021; Mayerfeld et al. Reference Mayerfeld, Rickenbach and Rissman2016, Mayerfeld et al. Reference Mayerfeld, Keeley, Rickenbach, Rissman and Ventura2023; Valdivia and Poulos Reference Valdivia and Poulos2009). In this New England practitioner sample, respondents described these management burdens as more constraining than financial issues, yet the relative importance of management/financial barriers may differ across regions and/or producer groups. In this New England practitioner sample, respondents described management burdens as more constraining than financial issues. This pattern, however, should not be assumed to generalize uniformly across regions or producer groups, particularly among historically underserved/marginalized producers, for whom capital constraints, land tenure insecurity, or unequal access to technical support may make financial barriers more significant.
Timing of perceived benefits and opportunities
The ranking further suggests that respondents distinguished sharply between near-term opportunities and benefits that depend on successful long-run establishment. Increased revenue sources (O1) ranked third overall, whereas Enhances economic benefits (S3) ranked lowest within Strengths. Similarly, Enhances ecosystem benefits (S2) ranked relatively high, whereas Enhanced environmental services (O2) ranked much lower. Participants described diversification strategies, such as stacking perennial crops, building relationships with local buyers, and experimenting with value-added products, as ways to improve cash flow during the early years. By contrast, profitability was often described as something that emerges only after substantial learning and, in many cases, several years. Likewise, environmental co-benefits were widely valued but were often framed as downstream of getting the system established correctly.
Indeed, adoption also depends on whether producers can effectively manage early-stage constraints and create viable near-term revenue pathways. Prior work on food-producing agroforestry systems suggests that implementation depends on practical conditions such as secure land access, start-up funding, farming and entrepreneurial know-how, and opportunities to diversify revenue before long-run returns are realized (Albrecht and Wiek Reference Albrecht and Wiek2021; Allen and Mason Reference Allen and Mason2021). Park et al. (Reference Park, Turner and Higgs2018, Reference Park, Kramer, Rhemtulla and Konijnendijk2019), in emphasizing the multifunctionality of food forest systems, note how many of their associated ecological and social benefits are contingent on sustained management, continuity, and long-term development.
Knowledge exchange, experimentation, and institutional support
Although Education and community outreach (O3) did not rank among the highest factors overall, interview narratives suggest that it plays an important supporting role in reducing uncertainty. Participants described peer learning, field days, and mentorship as ways to make small pilot efforts feel less risky by providing local examples, management benchmarks, and troubleshooting support. Within the SWOT taxonomy used here, farm-level capacity gaps are captured under Weaknesses, whereas the service and labor supports needed to address them, such as technical assistance/educational programing and skilled workers, are components of Lack of resources (T3). Knowledge exchange therefore appears less as a separate consideration than as part of the support needed to address a top-ranked constraint. Similar needs for technical support, knowledge diffusion, and ongoing training have been documented across agroforestry contexts (Tranchina et al. Reference Tranchina, Reubens, Frey, Mele and Mantino2024).
This qualitative evidence suggests that producers often approach agroforestry adoption incrementally, using limited-scale implementation to manage uncertainty while adapting systems to site conditions. In Virginia, silvopasture preferences favored what might be thought of as adoption “by subtraction,” thinning existing wooded acres, over adoption by “addition,” through planting trees into pasture, reflecting a lower-commitment conduit for trying the practice under farm conditions (Wilkens et al. Reference Wilkens, Munsell, Fike, Pent, Frey, Addlestone and Downing2022). Similar evidence from other regions suggests that experimentation, innovation, and use of only a small portion of farmland were common features of how these systems were being developed (Kreitzman et al. Reference Kreitzman, Chapman, Keeley and Chan2022; Trozzo et al. Reference Trozzo, Munsell, Chamberlain, Gold and Niewolny2021). In New England, such experimentation may be especially important since thin service markets and incomplete policy recognition can make reliable entry points difficult to find.
Conclusion
The main contribution of this study is to show that, for the New England cases examined here, adoption priorities were shaped foremost by establishment-stage threats, suggesting that participants placed greater weight on near-term downside risk than on delayed gains. Threats received the greatest category weight, and the two most influential factors overall were concerns about ecosystem disservices and limited resources. By contrast, the strongest positive signal was the potential to generate additional revenue. Within the Weaknesses category, limited expertise and time or management demands ranked above financial concerns. One-time establishment incentives may therefore be insufficient unless paired with support that reduces planning, coordination, and early failure risk.
Several caveats qualify these findings. This analysis provides a snapshot in time – consequently, the priorities identified here pertaining to the production enterprise may shift as markets, policies, and environmental conditions change. Furthermore, results should be interpreted in light of the study’s focus on existing agroforestry practitioners, which means that perspectives from non-adopters were not captured. Of the farms surveyed in this study, approximately half managed fewer than 50 acres, making our findings most directly applicable to small- and mid-sized operations. Although this reflects regional realities, larger-scale adopters may face distinct constraints or opportunities not fully represented here. In addition, because adopters practiced one or more of silvopasture, forest farming, and multistrata polyculture, but responses were not stratified by system type, system-specific differences in barriers and priorities may be obscured. Similarly, although two urban food forests were included alongside predominantly rural silvopasture and forest farming systems, urban-rural differences were not analyzed explicitly. Lastly, we did not formally assess whether our sample had reached saturation with respect to identifying adoption factors. As such, future qualitative work with non-adopters, larger operations, and system-specific subsamples could test whether additional perspectives yield new adoption factors.
Future research could test the intervention areas implied by the ranking, especially those aimed at reducing establishment-stage biophysical risk, improving access to services and technical support, and strengthening near-term revenue prospects. Education and community outreach also merit further study as ways for reducing knowledge and coordination barriers. Given the limitations of the current study, comparative work could broaden the sample to include non-adopters, larger operations, and urban or peri-urban settings while examining how barriers vary by practice type and farm context and, where feasible, using quasi-experimental designs to evaluate early-year failure and adjustment, time to first revenue, access to services, and the cost-effectiveness of specific support packages.
Supplementary material
The supplementary material for this article can be found at https://doi.org/10.1017/age.2026.10038.
Data availability statement
The replication code used in this study has been deposited in Zenodo at https://doi.org/10.5281/zenodo.17081186. The primary data was collected through field-based surveys conducted by the authors. Because these data contain sensitive information provided by human subjects, the raw datasets cannot be shared publicly to protect participant confidentiality (a synthetic dataset with the same structure is provided for replication). An anonymized and/or aggregated version of the dataset may be made available by the corresponding author upon reasonable request and subject to Institutional Review Board approval.
Funding statement
This material is based upon the work supported by the National Institute of Food and Agriculture, United States Department of Agriculture, under Award Number 2024-68012-41753. Additional support was provided by the New Hampshire Agricultural Experiment Station, under Award Number NH 00732.
Competing interests
The authors declare no competing interest.




 Open access

