Ruminant animals primarily depend on forage to produce food, milk, wool, leather and other products (Campos et al., Reference Campos, Nicácio, Sarmento, Cruz, Santos, Faria, Ferreira, Conceição and Lima2016). Due to uneven precipitation or high temperatures, the imbalance between forage supply and livestock nutrient requirements occurs annually, leading to an oversupply of forage in spring and summer, and insufficient forage production in autumn and winter (Yang et al., Reference Yang, Gao, Hou, Yan, Chang, Chen and Wang2018), which in turn affects the production performance of livestock and poultry. Bangor County, with an average altitude of 4,800 meters, is on a plateau with a subarctic semi-arid monsoon climate, characterized by cold climate, indistinct seasons and frequent windy and snowy weather. The Sewa sheep is a unique highland quality sheep breed in the region, known for its large size, cold tolerance, high milk yield and fine meat texture, producing 25% more milk than ordinary sheep. The Sewa sheep plays a significant role in local poverty alleviation, wealth generation for the people and ecological protection (Sun et al., Reference Sun, Cheng, Zhao, Wang, Wang and Ren2022).
The mammary gland is a vital exocrine organ that secretes milk rich in proteins, carbohydrates, lipids and other essential nutrients to nourish young animals and humans (Oftedal, Reference Oftedal2002). The mammary gland goes through three distinct stages of development: embryonic, pubertal and adult (Macias and Hinck, Reference Macias and Hinck2012). Mammary gland development is minimal during the embryonic and pubertal stages; full development occurs only during pregnancy, and the gland becomes fully functional postpartum (Truchet and Honvo-Houéto, Reference Truchet and Honvo-Houéto2017). Various factors, such as reproductive state, diet, season, physical condition, milk yield, age and environment, can influence the quantity of milk produced by the mammary glands during lactation (Akers, Reference Akers2017). Lambs that do not receive adequate milk early on may suffer from nutrient deficiencies, leading to slow growth or even death. The amount of milk produced by sheep has increased significantly in China as a result of improved sheep nutrition. However, due to seasonal climate changes, Xizang sheep often cannot obtain sufficient nutrition for optimal milk production year-round.
In recent years, a potent technique for determining the patterns of gene expression in the mammary glands of mammals at different lactation phases is transcriptome sequencing. Investigations using transcriptome sequencing on goat mammary tissues. The sheep, cattle, pigs and mice (Jin et al., Reference Jin, Yang, Li, Liu and Liu2013; Shi et al., Reference Shi, Zhu, Luo, Cao, Shi, Yao, Li, Sun, Xu and Yu2015; Paten et al., Reference Paten, Duncan, Pain, Peterson, Kenyon, Blair and Dearden2015; Dai et al., Reference Dai, Zou, White, Liu and Liu2018; Palombo et al., Reference Palombo, Loor, D'Andrea, Vailati-Riboni, Shahzad, Krogh and Theil2018; Ji et al., Reference Ji, Chao, Liu, Hou, Wang, Wang, Zhou, Xuan, Wang and Wang2020; Wang et al., Reference Wang, Zhou, Hickford, Hao, Shen, Luo, Hu, Liu and Li2020; Mitra et al., Reference Mitra, Ganaie, Bankar, Velu, Mani, Vasudevan, Shome, Rahman, Ghosh and Shome2020; Li et al., Reference Li, Zhu, Shi, Luo, Zhao, Shi, Xu, Wang and Loor2020a; Pal et al., Reference Pal, Chen, Milevskiy, Vaillant, Prokopuk, Dawson, Capaldo, Song, Jackling and Timpson2021; Trott et al., Reference Trott, Schennink, Horigan, Lemay, Cohen, Famula, Dragon and Hovey2022; Xuan et al., Reference Xuan, Chao, Zhao, Wang, Chu, Li, Zhao, Ji and Wang2022a), found a sizable number of genes and signalling pathways involved in controlling lactating and atrophy at various developmental stages. These findings enhance our understanding of the genes affecting lactation traits. The majority of research on sheep mammary glands has focused on breeds such as the Small-Tailed Han sheep and Alpine merino sheep (Hao et al., Reference Hao, Zhou, Hickford, Gong, Wang, Hu, Liu, Li, Zhao and Luo2019; Mohapatra et al., Reference Mohapatra, Shinde and Singh2019), goats (Inman et al., Reference Inman, Robertson, Mott and Bissell2015; Xuan et al., Reference Xuan, Wang, Zhao, Li, Wang, Du, Duan, Guo, Ji and Chao2022b) and Hu sheep (Chen et al., Reference Chen, Gu, Lv, Cao, Yuan, Wang and Sun2022). However, studies on the lactation mechanism of the Sewa sheep mammary gland using transcriptome technology are relatively scarce, and the information regarding the lactation mechanism of Sewa sheep remains incomplete. Therefore, an in-depth study of the gene expression patterns of Sewa sheep mammary glands at different lactation stages is of great significance for revealing their lactation mechanisms, increasing milk yield and promoting the development of local animal husbandry.
This study analysed the differentially expressed genes (DEGs) through transcriptome comparisons of mammary tissues from Sewa sheep in different lactation periods and considered the effect of season on production performance. This provides a data foundation and theoretical basis for uncovering the mechanisms regulating lactation and identifying candidate genes associated with mammary gland development in sheep.
Materials and methods
Animals and sample collection
This study was conducted from June to November 2023 in Bangor County, Xizang. In both summer and autumn, six Sewa sheep with similar body weights, normal, healthy behaviour, normal udders and teats without lumps or defects, and an average age of 1 year were selected from a flock of 100 Sewa sheep. The group selected in summer (Group A, n = 6) was designated as the experimental group, and those selected in autumn (Group S, n = 6) were designated as the control group. Throughout the experimental period, all sheep were allowed to graze freely on natural pastures at an altitude of approximately 4,750 meters. At the end of the experimental periods in each season (August 31 and November 30), the sheep were fasted for 12 hours and then slaughtered; their mammary gland tissues were collected, rinsed with phosphate buffered saline, placed into cryovials (three tubes per animal), immediately snap-frozen in liquid nitrogen, transported to the laboratory and finally stored at –80°C for further analysis. This study was approved by the Laboratory Animal Ethics Committee of Southwest University of Science and Technology (L2022014). All procedures involving animals were conducted in accordance with the guidelines and regulations set forth by the committee to ensure animal welfare.
RNA extraction, library construction and sequencing
RNA was extracted from the mammary gland tissues using the Trizol method. After successful extraction, the RNA was dissolved in 50 µl of DEPC-treated water. Subsequently, the total RNA was quantified and qualified using a Qubit fluorometer and a Qsep400 high-throughput bio-fragment analyser. For mRNA enrichment, lysis, reverse transcription and synthesis of the second-strand cDNA, library construction was carried out through ligation, purification and amplification, followed by concentration and fragment size detection. Illumina sequencing was performed after the library passed quality control, generating 150 bp paired-end reads.
Data quality control and identification of DEGs
RNA sequencing was performed by MetWare Biotech (Wuhan, China) on the Illumina NovaSeq 6000 platform (Illumina, San Diego, CA, USA). Raw sequencing data were quality controlled using ‘Fastp’ to remove sequences containing more than 10% (N) or more than 50% low-quality (Q ≤ 20) bases. The comparison results of the genes were counted using the ‘featureCounts’ tool, and each gene's fragments per kilobase of transcript per million mapped reads (FPKM) value was determined using the gene length. Differential expression analysis of the two groups of samples was performed using ‘DESeq2’. To ensure the accuracy of the statistical analysis, we employed the Benjamini–Hochberg method to adjust P-values and control the false discovery rate (FDR), with P < 0.05 and |Change| ≥ 1 as the threshold for determining significant differential expression (Love et al., Reference Love, Huber and Anders2014).
cDNA synthesis and real-time quantitative PCR (qPCR)
The extracted RNA was transcribed into cDNA using the reverse transcription kit provided by Tiangen Biochemical Technology (Beijing) Co., Ltd., with a reaction system of 20 µl. To confirm the accuracy of the RNAseq results, eight functionally characterized DEGs (primer sequences are shown in Table 1) were selected for RT-qPCR analysis. The 2−ΔΔCt method was used to evaluate the data.
Primer sequences of differentially expressed genes (DEGs)

Table 1 Long description
PCR primer sequences are provided for nine genes, listing each gene’s sense and anti-sense primers along with expected amplicon length in base pairs and annealing temperature in degrees C. Product lengths range from 81 bp for BTN1A1 to 257 bp for SCD, with GAPDH at 249 bp and PLIN2 at 203 bp. The shortest products are BTN1A1 at 81 bp and KCNJ3 at 102 bp, while several targets cluster near 118 to 122 bp including SCD5 at 118 bp, FABP3 at 120 bp, and CD52 at 122 bp. Annealing temperatures span from 51.75 degrees C for CD52 to 59.95 degrees C for PLIN1, with most assays in the mid 50s. GAPDH is included as a reference gene with an annealing temperature of 56.85 degrees C. Values reflect planned PCR conditions and expected amplicon sizes; actual performance can vary with reagents, instrument settings, and template quality.
Gene Ontology and KEGG pathway enrichment analysis
The GOseq R package and GO analysis were used to investigate the primary roles of the DEGs (Li et al., Reference Li, Pan, Pan, Li, Zhang, Shahzad, Sun, Yixi, Zhaxi and Qing2024). GO terms with corrected P < 0.05 were considered significantly enriched. The DEGs were compared with the KEGG pathway database using the KOBAS 2.0 program (http://bioinf.wehi.edu.au/software/goseq). Pathways with corrected P-values < 0.05 were considered highly enriched.
Results
Analysis of gene differential expression between groups in different seasons
In order to compare the differential gene expression levels of mammary tissues during autumn and summer, differential expression analysis was performed on two groups of samples, and a total of 3,566 DEGs were obtained (Fig. 1A, B), of which 1,837 genes were significantly up-regulated and 1,729 genes were significantly down-regulated in the summer group, with the autumn group as the control. The 15 genes with the most significant differences were shown on the radargram, all of which were down-regulated, including transmembrane channel like 5 (TMC5) (ENSOARG00020014467.1), casein kappa (CSN3) (ENSOARG00020001292.1) and lactalbumin alpha (LALBA)(ENSOARG00020001995.1) (Fig. 1C). The similar expression levels of DEGs in groups S and A showed clustering, suggesting that these genes may have similar functions or be jointly involved in some metabolic processes or cellular pathways (Fig. 1D).
Visualization of DEGs. (A) Volcano plot. Red dots represent upregulated genes, green dots represent downregulated genes, and grey dots indicate no significant change. (B) MA plot. Blue dots indicate no significant change, green dots are downregulated and red dots are upregulated genes. (C) Radar chart. It shows the top 15 DEGs (all downregulated). (D) Heatmap. It displays the clustering of DEGs’ expression across different samples, where S represents the summer group, and A represents the autumn group.

Figure 1 Long description
Volcano plot. The horizontal axis label is Log subscript 2 left parenthesis Fold Change right parenthesis. The vertical axis label is minus Log subscript 10 left parenthesis FDR right parenthesis. A legend titled Statistics lists UP:1837, Down:1729, Insignificant:14062. Points form a dense cluster near Log subscript 2 left parenthesis Fold Change right parenthesis equals 0 and lower minus Log subscript 10 left parenthesis FDR right parenthesis values, with points extending to both negative and positive Log subscript 2 left parenthesis Fold Change right parenthesis values at higher minus Log subscript 10 left parenthesis FDR right parenthesis values. MA plot. The horizontal axis label is baseMean. The vertical axis label is Log subscript 2 left parenthesis Fold Change right parenthesis. A legend titled regulated lists down, false, up. Points are densest around Log subscript 2 left parenthesis Fold Change right parenthesis equals 0 across the baseMean range, with points spreading farther above and below 0 at lower baseMean values. Radar chart with multiple spokes and a filled polygon. Perimeter labels include ENSOARG00020001995.1, ENSOARG00020001292.1 and ENSOARG00020014467.1. Concentric polygon rings are labeled 0.0, 0.5, 1.0 and 1.5. The filled polygon extends farther from the center on some spokes and closer on others, forming an uneven shape across the labeled genes. Heatmap with a row dendrogram and a column dendrogram. A vertical scale bar is labeled log subscript 2 left parenthesis FPKM plus 1 right parenthesis. A legend titled Group lists A and S. The heatmap shows blocks of higher and lower values across columns and the column dendrogram groups columns into clusters aligned with the Group labels. The four sub-images present differential expression summaries in the volcano plot and MA plot, followed by a selected-gene profile in the radar chart and sample-by-gene patterns with clustering in the heatmap.
GO analysis of DEGs
DEGs between the summer and autumn groups were subjected to enrichment analysis and GO functional annotation. A histogram was created, and the top 30 GO entries in the comparison group with the most significant enrichment analysis were examined using the three components of molecular function (MF), biological process (BP) and cellular component (CC). The top five GO terms involved in BP were metabolism process, intracellular procedure, physiological regulation, biochemical regulation and response to a stimulus. The top five GO terms involved in MF were binding, catalytic activity, transcription regulator activity, MF regulator activity and transporter activity (Fig. 2A). GO terms involved in CC were cellular anatomical entity and protein-containing complex. GO classification statistics were performed on the up-regulated and down-regulated DEGs. The top 5 GO terms were consistent with the results of being sorted by gene number (Fig. 2B).
GO annotation analysis of DEGs. (A) GO classification bar graph, MF for molecular function, CC for cellular composition, BP for biological process. (B) GO Upward and downward bar charts. Vertical coordinates indicate the number of DEGs for GO entries, with yellow representing upward adjustments and blue bars representing downward adjustments.

Figure 2 Long description
Bar chart with three labeled sections: BP, CC and MF. The vertical axis label is Number of genes. The vertical axis range is 0 to 2000. BP section category labels: cellular process; biological regulation; metabolic process; regulation of biological process; localization; multicellular organismal process; developmental process; response to stimulus; signaling; positive regulation of biological process; biological process involved in interspecies interaction between organisms; immune system process; negative regulation of biological process; biological adhesion; locomotion; reproduction. CC section category labels: cellular anatomical entity; protein-containing complex. MF section category labels: binding; catalytic activity; molecular function regulator; transcription regulator activity; transporter activity; molecular transducer activity; ATP-dependent activity; molecular adaptor activity; translation regulator activity; structural molecule activity; molecular carrier activity; protein folding chaperone. The tallest bars appear at cellular process in BP, cellular anatomical entity in CC and binding in MF. The shortest bars appear at reproduction in BP and protein folding chaperone in MF. Grouped bar chart with two bars per category and a legend with entries: up and down. The vertical axis label is Number of genes. The vertical axis range is 0 to 1200. Category labels: cellular process; biological regulation; metabolic process; regulation of biological process; localization; response to stimulus; multicellular organismal process; developmental process; signaling; positive regulation of biological process; negative regulation of biological process; biological process involved in interspecies interaction between organisms; immune system process; biological adhesion; locomotion; reproduction; cellular anatomical entity; protein-containing complex; binding; catalytic activity; molecular function regulator; transcription regulator activity; transporter activity; molecular transducer activity; ATP-dependent activity; molecular adaptor activity; translation regulator activity; structural molecule activity; cytoskeletal motor activity; molecular carrier activity; protein folding chaperone. The tallest grouped bars appear at cellular process and cellular anatomical entity. The smallest grouped bars appear at reproduction and protein folding chaperone. For most categories, both up and down bars are present, with the up bar taller than the down bar in several of the highest-count categories. The image A presents total counts by GO category across BP, CC and MF. The image B presents the same GO categories with counts split into up and down.
KEGG analysis of DEGs
KEGG enrichment analysis was performed to learn more about the role of DEGs in the mammary tissue of Sewa sheep at different stages of lactation. The primary categories of the enriched pathways include Organismal Systems, Environmental Information Processing and Cellular Processes, as seen in Fig. 3A. A total of 20 significantly enriched pathways were identified; the three pathways most enriched for DEGs were herpes simplex virus one infection, cell adhesion molecules and the Rap1 signalling pathway (Fig. 3B, Table 2).
KEGG pathway enrichment analysis of DEGs. (A) Enrichment pathway histogram. Percentages indicate the proportion of DEGs mapped to each pathway over all DEGs. (B) KEGG Enrichment Scatter Plot. The larger the dot, the more DEGs are enriched; the redder the colour, the more significant the enrichment.

Figure 3 Long description
Horizontal bar chart with pathway names on the left and a horizontal axis labeled Percent percent, with tick labels 0, 5, 10, 15, 20. Each bar has a count value printed at the bar end and a percentage in parentheses. The listed pathways and printed values are: Cellular senescence 45 (2.81 percent); Ferroptosis 26 (1.62 percent); Rap1 signaling pathway 60 (3.75 percent); Cell adhesion molecules 58 (3.62 percent); NF-kappa B signaling pathway 42 (2.62 percent); Viral protein interaction with cytokine and cytokine receptor 31 (1.94 percent); Herpes simplex virus 1 infection 224 (14 percent); Rheumatoid arthritis 41 (2.56 percent); Graft-versus-host disease 39 (2.44 percent); Inflammatory bowel disease 33 (2.06 percent); PD-L1 expression and PD-1 checkpoint pathway in cancer 31 (1.94 percent); Type I diabetes mellitus 31 (1.94 percent); Allograft rejection 29 (1.81 percent); Chemokine signaling pathway 28 (1.75 percent); Malaria 50 (3.12 percent); Natural killer cell mediated cytotoxicity 49 (3.06 percent); Antigen processing and presentation 41 (2.56 percent); Th17 cell differentiation 39 (2.44 percent); Th1 and Th2 cell differentiation 38 (2.38 percent); Intestinal immune network for IgA production 25 (1.56 percent). On the right side, three stacked category labels appear: Cellular Processes, Environmental Information Processing, Human Diseases, Organismal Systems. Scatter plot with the horizontal axis labeled Rich Factor, with tick labels 0.20, 0.25, 0.30, 0.35. The vertical axis lists the same pathway names as in image. Red circular markers of varying sizes are plotted across the Rich Factor range. A legend at the right shows Q-value with labeled values 1.00, 0.75, 0.50, 0.25, 0.00 and a Count legend with marker sizes labeled 0, 50, 100, 150, 200.
Number of KEGG significantly enriched pathway genes

Table 2 Long description
Counts of significantly enriched pathway genes are listed for three KEGG pathways, split into upregulated and downregulated genes with a total count for each pathway. Herpes simplex virus 1 infection has the highest total, with 145 upregulated and 79 downregulated genes, for 224 overall. Rap1 signalling pathway shows 34 upregulated and 26 downregulated genes, totaling 60. Cell adhesion molecules has 50 upregulated and 8 downregulated genes, totaling 58. Across all pathways, upregulated genes outnumber downregulated genes, most strongly for cell adhesion molecules. Totals indicate relative enrichment across these pathways but do not convey effect size, statistical thresholds, or overlap of genes between pathways.
KOG annotation and classification statistics of DEGs
KOG refers to the clustering of homologous proteins from eukaryotes to annotate eukaryotic genes and to count the number of DEGs in each KOG. As illustrated in Fig. 4, the DEGs are categorized into 25 KOG clusters, among which the clusters ‘General function prediction only’ and ‘Signal transduction mechanisms’ have a relatively large proportion of matching proteins in all KOGs.
KOG-annotated DEGs bar chart. This bar chart illustrates the distribution of DEGs across various KOG functional categories. A–Z represents the KOG ID codes and their corresponding functional descriptions, with the numbers indicating the count of DEGs.

Figure 4 Long description
Classification bar graph with y-axis label Number of genes and x-axis label Classification. The x-axis categories are A, B, C, D, E, F, G, H, I, J, K, L, M, N, O, P, Q, R, S, T, U, V, W, Y, Z. The y-axis shows labeled ticks at 0, 100, 200, 300 and 400. Values printed above bars: A 37, B 17, C 0, D 68, E 81, F 0, G 66, H 0, I 0, J 277, K 59, L 0, M 18, N 0, O 0, P 148, Q 81, R 27, S 0, T 427, U 405, V 118, W 109, Y 58, Z 75. Legend text: A: RNA processing and modification. B: Chromatin structure and dynamics. C: Energy production and conversion. D: Cell cycle control, cell division, chromosome partitioning. E: Amino acid transport and metabolism. F: Nucleotide transport and metabolism. G: Carbohydrate transport and metabolism. H: Coenzyme transport and metabolism. I: Lipid transport and metabolism. J: Translation, ribosomal structure and biogenesis. K: Transcription. L: Replication, recombination and repair. M: Cell wall, membrane or envelope biogenesis. N: Cell motility. O: Posttranslational modification, protein turnover, chaperones. P: Inorganic ion transport and metabolism. Q: Secondary metabolites biosynthesis, transport and catabolism. R: General function prediction only. S: Function unknown. T: Signal transduction mechanisms. U: Intracellular trafficking, secretion and vesicular transport. V: Defense mechanisms. W: Extracellular structures. Y: Nuclear structure. Z: Cytoskeleton.
qPCR validation
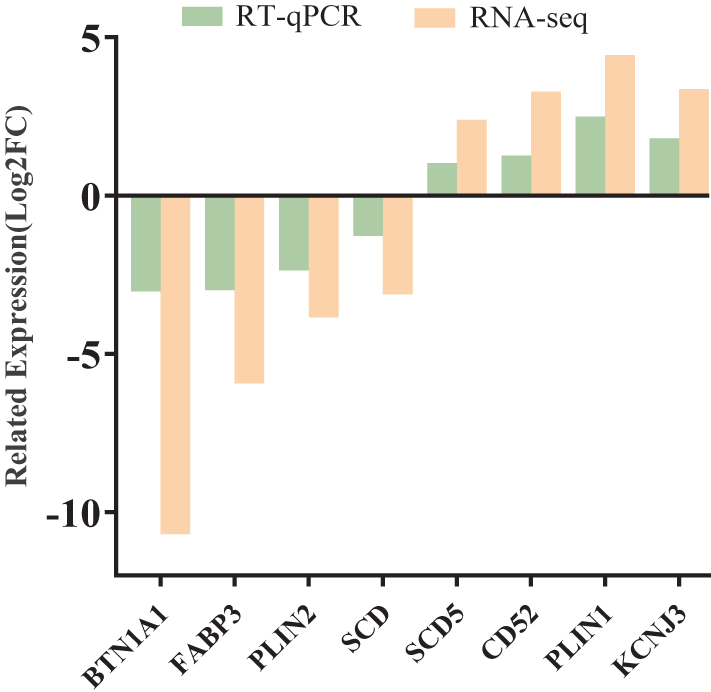
To confirm the accuracy of the sequencing data, we selected eight DEGs (BTN1A1, FABP3, PLIN2, SCD, SCD5, CD52, PLIN1 and KCNJ3) for qPCR validation. The results were consistent with the sequencing data (Fig. 5).
RNA-Seq and RT-qPCR comparison histograms. Values are expressed as log2(fold-change), (Log2FC) and RT-qPCR experiments were normalized with the GAPDH gene as an internal reference.

Discussion
Since ancient times, sheep's milk has been utilized in the production of dairy products, ranking fourth in global dairy production (Mohapatra et al., Reference Mohapatra, Shinde and Singh2019). Thus, increasing the quantity and quality of sheep milk is an essential objective for the dairy industry. However, milk yield is a dynamic, multifaceted characteristic that is controlled by several molecular pathways (Inman et al., Reference Inman, Robertson, Mott and Bissell2015). By studying the molecular mechanisms of mammary gland development and function, it facilitates a more thorough comprehension of the mammary tissue remodelling process, which improves comprehension of the variables influencing milk secretion (Akers, Reference Akers2017). Sewa sheep are a vital livestock breed in Xizang and have high economic value (Mustafa et al., Reference Mustafa, Long, Song, Zhang, Zhaxi, Wu, Chen, Shahzad, Jiang and Liu2025). In this study, we investigated the transcriptional changes in the mammary gland tissue of Sewa sheep across different seasons, and through differential expression analysis, a total of 3,566 DEGs were identified between the two distinct periods, with 1,837 genes showing significant up-regulation and 1,729 genes showing significant down-regulation. Among them, the 15 genes with the most significant fold differences, such as Transmembrane TMC5CSN3 and LALBA, were all downregulated. Cow-based studies have found (Asim et al., Reference Asim, Saif-ur Rehman, Hassan and Awan2023) that CSN3 improves lactation performance. LALBA synthesizes lactose synthase in the mammary gland and promotes milk secretion (Čítek et al., Reference Čítek, Samková, Brzáková, Hanuš, Večerek, Hoštičková, Jozová, Hasoňová and Hálová2023). Therefore, the seasonal variations that cause differences in gene expression in the mammary glands of Sewa sheep can regulate key lactation genes, thereby affecting the yield and quality of sheep's milk.
Functional enrichment analyses using GO and KEGG were performed to ascertain the biological functions of DEGs in more detail. The GO annotated BPs encompassed cellular processes, bioregulatory and metabolic processes, which play important physiological functions in the development of the mammary gland. KEGG analysis of DEGs revealed that the significantly enriched pathways were the Rap1 signalling pathway, cell adhesion molecules and infection with herpes simplex virus 1. Among these, the GTPase RAP1A influences cell adhesion, intercellular junctions and cell polarity, and the Rap1 signalling pathway controls several BPs, including cancer metastasis (Shah et al., Reference Shah, Brock, Ji and Mattingly2019) (Bos, Reference Bos2005) (Zhang et al., Reference Zhang, Wang, Cheng, Ring and Su2017). Rap1 and GTP work together to activate the PI3K-Ark signalling pathway, which is linked to primordial follicle survival and activation and is extensively involved in many significant processes of mammalian ovarian development (Zhou et al., Reference Zhou, Yan, Shen, Cheng, Xi, Yuan, Fu, Ding, Luo and Wang2018) and hormone secretion. In addition, the mammary gland is an important model for cell adhesion, and it is subject to postnatal development regulated by hormones (Shamir and Ewald, Reference Shamir and Ewald2015). Different hormones stimulate the formation of the mammary gland, which comprises milk-secreting alveoli and collecting ducts. The basal and luminal types of epithelial cells that comprise the mammary gland attach through a cell adhesion apparatus (Kitayama et al., Reference Kitayama, Mizutani, Maruoka, Mandai, Sakakibara, Ueda, Komori, Shimono and Takai2016). Consequently, the DEGs connected to these pathways are essential for maintaining the mammary gland's healthy growth and lactation.
For the validation analysis, we chose eight genes at random, and the outcomes agreed with the sequencing findings, which identified that genes such as BTN1A1, FABP3, PLIN2 and SCD are down-regulated during mammary gland development, whereas the expression patterns of SCD5, CD52, PLIN1 and KCNJ3 are up-regulated. BTN1A1 is the most abundant milk fat globule membrane-highest protein and is expressed explicitly in lactating mammary glands, including humans (Shamir and Ewald, Reference Shamir and Ewald2015), bovines (Zhou et al., Reference Zhou, Yan, Shen, Cheng, Xi, Yuan, Fu, Ding, Luo and Wang2018) and mice (Ishii et al., Reference Ishii, Aoki, Noda, Adachi, Nakamura and Matsuda1995). It is produced at the end of gestation and maintained throughout lactation (Franke et al., Reference Franke, Heid, Grund, Winter, Freudenstein, Schmid, Jarasch and Keenan1981) and accounts for more than 40% of the total protein associated with bovine milk fat globule membranes (Banghart et al., Reference Banghart, Chamberlain, Velarde, Korobko, Ogg, Jack, Vakharia and Mather1998). A key protein for the quick diffusion of long-chain fatty acids and the targeting of particular organelles for metabolism is FABP3, one of the target genes of SREBP1 and PPARγ. FABP3 up-regulates the expression of SREBP1 and PPARγ and increases lipid droplet (LD) accumulation (Liang et al., Reference Liang, Hou, Qu, Zhang, Li, Cui, Li and Gao2014). Thus, BTN1A1 and FABP3 in the mammary gland are essential for milk lipid release and lipid synthesis, respectively. Lower temperatures and rainfall observed in the cold season may reduce pasture yield and quality compared to the warm season (Xue et al., Reference Xue, Guo, Han, Sun and Liu2009). The ability of Tibetan sheep to utilize nutrients from pasture on the Tibetan Plateau is a direct result of their prevailing physiological state (i.e., different stages of pasture maturity), which is mainly dependent on local weather conditions (Wang et al., Reference Wang, Wang and Zhou2009). In this study, the downregulation of these genes during peak lactation relative to the dry period indicates that in the summer, the mammary tissues of sheep may focus more on milk synthesis and secretion while reducing fat synthesis and storage. This change reflects the metabolic adaptation of mammary tissues at different lactation stages and reveals the physiological regulatory mechanisms of plateau sheep in different seasons.
SCD5 is an integral membrane protein of the endoplasmic reticulum involved in lipid metabolism (Zhao et al., Reference Zhao, Sun, Li, Wang, Zhu, Jia and Tong2021) and is involved in cell division, proliferation, metabolism and survival. PLIN1 belongs to the PAT protein family, which is a family of proteins related to the surface proteins of LDs. PLIN1 phosphorylation plays a role in fat metabolism and lipolysis in adipose tissue and fat storage in adipocytes (Li et al., Reference Li, Raza, Zhao, Cheng and Zan2020b). According to a different study, the PLIN1 gene regulates proliferation, apoptosis, differentiation and lipolysis in chicken and bovine adipocytes (Zhai et al., Reference Zhai, Pang, Zou, Wang, Liu, Zhang, Cao, Wang, Li and Wang2022). The primary determinants of fodder output and quality are temperature and precipitation, as they have a direct impact on plant growth, nutrient concentrations, community composition and digestibility (White, Reference White1985). According to a prior study, forages are more nutritious and easier to digest in the summer when they are succulent and growing quickly than they are in the winter (Yang et al., Reference Yang, Gao, Hou, Yan, Chang, Chen and Wang2018). The quality and yield of pasture are higher in summer than in winter due to higher rainfall, so the crude proteins are higher in summer forage, while SCD5 is an integral protein and PLIN1 is a member of the protein family, thus showing an up-regulation in gene expression.
Overall, this study reveals the transcriptome characteristics of the mammary gland in Sewa sheep across different stages, providing a foundation for the subsequent selection of candidate genes with functional roles in the mammary gland of sheep. Additionally, this research contributes to elucidating the molecular mechanisms underlying the differences in sheep production performance across various seasons. However, the study's limitation lies in its focus solely on the transcriptional level to explore the regulatory mechanisms of lactation performance. Future research should consider the interplay of multiple factors, including post-transcriptional regulation, changes at the protein level, and environmental and genetic factors, to provide a more comprehensive scientific basis for investigating the improvement of lactation performance and mammary gland development in sheep.
Conclusion
In this study, a total of 3,566 DEGs were identified across various periods in Sewa sheep. Among them, 1,837 genes were significantly upregulated, while 1,729 genes were downregulated, with all 15 genes showing the most significant fold changes being downregulated, including TMC5, CSN3 and LALBA genes associated with sheep lactation performance. Twenty significantly enriched pathways, such as cell adhesion molecules and the Rap1 signalling pathway, play crucial roles in mammary gland development and milk fat production. RT-qPCR confirmed expression differences in eight genes related to protein and fat metabolism and milk fat formation across different lactation periods. Thus, this study indicates that the lactation performance of the mammary gland varies at different times, likely due to the differential expression of related genes under varying environmental conditions, providing foundational data for subsequent research on the regulatory mechanisms of sheep lactation performance and mammary gland development.
Funding statement
This work was supported by the National Natural Science Foundation of China (32260824) and a local project guided by the Central Government of Xizang Autonomous Region (XZ202201YD0007C; XZ202101YD0019C).
Competing interests
None of the authors has any conflict of interest to declare.
Author contributions
Junru Pan: writing – original draft and writing – review and editing. Shehr B. Mustafa: software, methodology, data curation. Zhenzhen Zhang: data curation, methodology. Cheng Pan: data curation, methodology. Rui Li: conceptualization. Yangzong Zhaxi: data curation, methodology. Lanting Wei: data curation. Zhaxi Danba: methodology. Zhaxi Baijiu: methodology. Yu Sun: data curation. Zhuoma Jiayang: data curation. Wangsheng Zhao: project management, funding acquisition. Tianzeng Song: project management, funding acquisition. All authors have read and agreed to the final manuscript.
Informed consent
Written informed consent was obtained from each participant.
Data availability statement
All data in this study are available upon request by contacting the corresponding author. The datasets generated for this study can be found in the NCBI Sequence Read Archive under BioProject PRJNA1139045.