Multivariate models play a crucial role in the field of quantitative genetics. As pointed out by Gianola and Sorensen (Reference Gianola and Sorensen2004), the value of a selection candidate as the parent for the subsequent generation is generally evaluated based on multiple traits. High dimensionality is a common feature of multivariate models as the number of parameters increases with the inclusion of more than one trait in the genetic analysis, which complicates these analyses (Silva et al., Reference Silva, Paiva, Botelho, Carrara, Lopes, Silva, Veroneze, Sterman Ferraz, Eler, Mattos and Gaya2022). Furthermore, even when the analysis can be performed, the interpretation of the correlations among many traits becomes more difficult (Yu et al., Reference Yu, Campbell, Zhang, Walia and Morota2019). On the other hand, by increasing the number of traits under multivariate models, computational costs will increase, and accordingly, reaching convergence will be difficult.
Structural equation modelling is a robust statistical technique (Wright, Reference Wright1921) that enables the evaluation of measurement models used for latent variable modelling (LVM) (Schumacker and Lomax, Reference Schumacker and Lomax1996). The LVM may be considered an efficient method for reducing the dimensionality of datasets and also computational complexity. Latent variables are not directly measurable but can be inferred from several measurable traits (Schumacker and Lomax, Reference Schumacker and Lomax1996). Silva et al. (Reference Silva, Paiva, Botelho, Carrara, Lopes, Silva, Veroneze, Sterman Ferraz, Eler, Mattos and Gaya2022) pointed out that the application of a small number of latent variables can decrease the dimensionality issue arising from phenotypic data, thereby mitigating the issues arising from model overparameterisation. Confirmatory factor analysis (CFA) is a statistical technique that can be applied to decrease the dimensionality of data (Yu et al., Reference Yu, Campbell, Zhang, Walia and Morota2019) and to investigate the hypothesis that a set of measurable traits is associated with a smaller number of latent traits (Momen et al., Reference Momen, Bhatta, Hussain, Yu and Morota2021).
The efficiency of milk production may be influenced by several traits, such as the milk yield, milk composition characteristics like fat and protein percentages, somatic cell score (SCS), and milk urea nitrogen (MUN) (Godden et al., Reference Godden, Lissemore, Kelton, Leslie, Walton and Lumsden2001). These traits imply different aspects of milk production efficiency in dairy cows. For example, milk SCS is recognised as a reliable indicator for early diagnosis of udder disease and the health status of mammary glands (Olechnowicz and Jaskowski, Reference Olechnowicz and Jaskowski2012). Also, MUN is the primary non-protein nitrogen component in milk, acts as an indicator of both nitrogen utilisation efficiency in dairy cows (Baker and Ferguson, Reference Baker and Ferguson1993) and the extent of nitrogen excretion into the environment (Stoop et al., Reference Stoop, Bovenhuis and Van Arendonk2007). By exploiting statistical properties of the LVM technique, constructing a latent variable related to different aspects of milk production performance from several milk yield and quality traits may be important for defining a suitable measure as a selection criterion for improving these traits.
In the present study, the application of LVM for constructing a latent variable, namely test-day lactation performance (TDLP) from five milk yield and composition traits, was considered. Furthermore, genetic and phenotypic correlations of the latent trait TDLP with the considered milk traits were also investigated.
Material and methods
The phenotypic data
The raw data comprised 9898 milk yield and composition traits, as well as test-day records from 2078 first-parity cows collected across 43 herds of Chinese Holstein dairy cows in Bayannaoer City, Inner Mongolia, China, between 2023 and 2025. The pedigree structure of the studied population is shown in Table 1. In dairy cows, each milk test-day record included the quantity and/or composition of milk produced by a cow over a single day of the lactation period. Milk fat and protein percentages were measured by applying the MilkoScan™ 7 RM, and the Somatic cell count was obtained by the Fossomatic™ 7 DC. Milk Urea Nitrogen was measured using mid-infrared spectrometry.
Pedigree structure of the population of the Chinese Holstein dairy cows

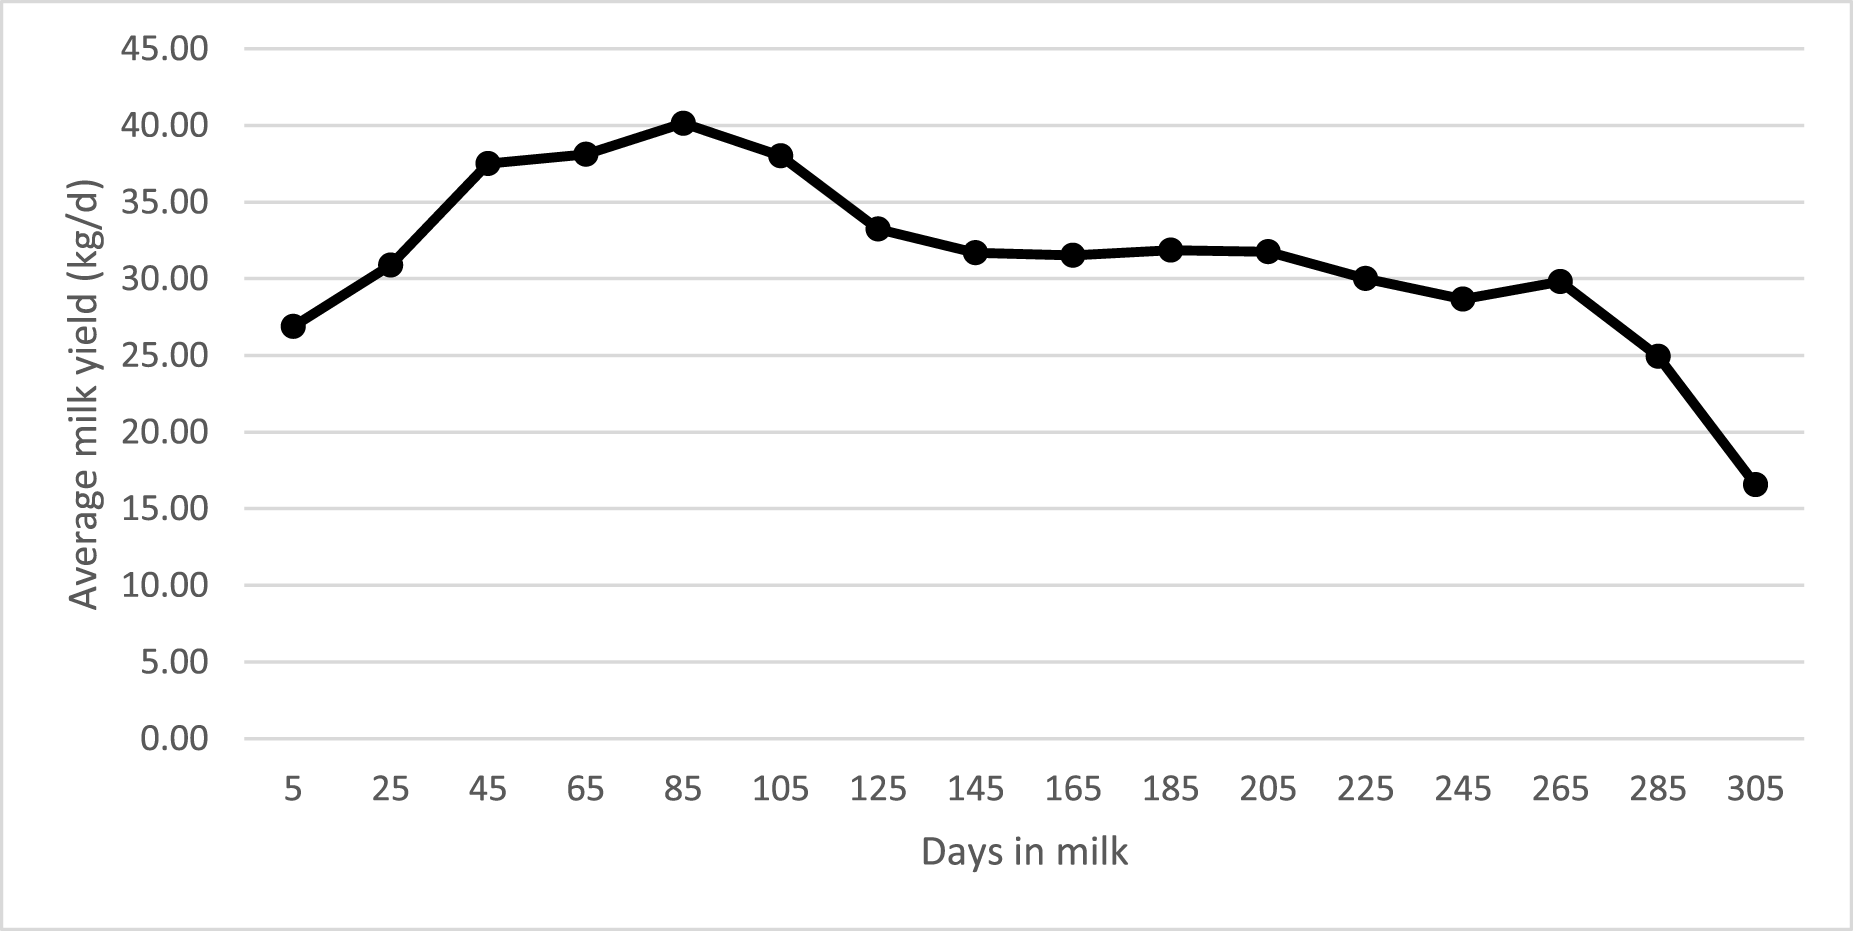
For editing purposes, test-day records were limited to cows for which the milk recordings had been measured between 5 days in milk (DIM) and 305 DIM, with consecutive sampling intervals of 30 days and lactation length not greater than 305 days. Furthermore, cows with fewer than three test-day records and more than nine test-day records were excluded from the dataset. By considering edited data, the average number of cows per herd was about 45. The graph representing the lactation curve in the studied population is shown in Fig. 1. Studied traits were test-day milk yield (TDMY), test-day milk fat percentage (TDFP), test-day milk protein percentage (TDPP), test-day somatic cell count (TDSCC) and test-day milk urea nitrogen (TDMUN). The TDSCC values were right-skewed. Therefore, to obtain values that are normally distributed, TDSCC values were transformed into test-day somatic cell score (TDSCS) values through the following transformation (Valencia-Posadas et al., Reference Valencia-Posadas, Lechuga-Arana, Avila-Ramos, Shepard and Montaldo2022):
Lactation curve in the first-parity Chinese Holstein dairy cows.

 \begin{equation*}TDSCS = \,lo{g_2}\,\left( {\frac{{TDSCC}}{{100000}}} \right) + 3\end{equation*}
Descriptive statistics of the edited data are shown in Table 2.
Descriptive statistics for the studied traits in Chinese Holstein dairy cows

¥ TDMY: test-day milk yield, TDFP: test-day milk fat percentage, TDPP: test-day milk protein percentage, TDSCS: test-day somatic cell score, TDMUN: test-day milk urea nitrogen.
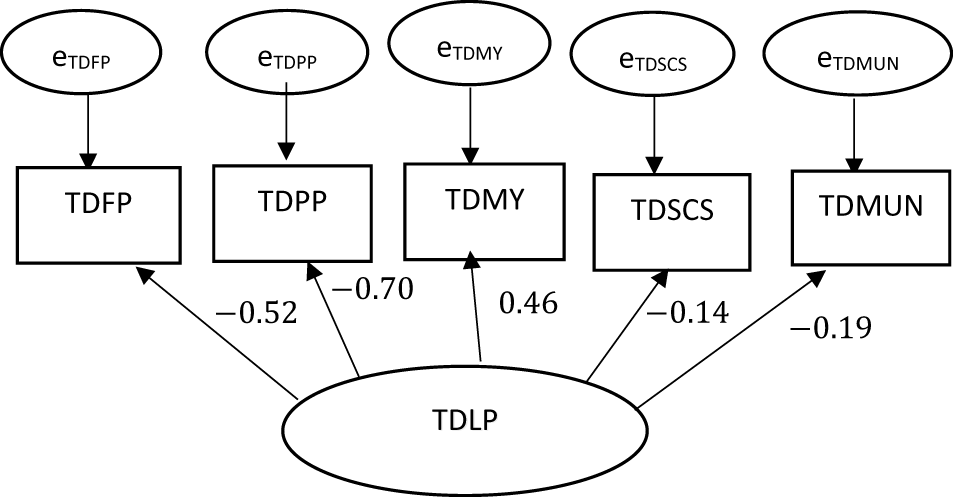
Modelling the latent variable
The values of a latent variable are not directly measurable but are inferred from other measured variables using statistical models (Schumacker and Lomax, Reference Schumacker and Lomax1996). The hypothesised model for developing the TDLP latent trait from five milk-related traits is depicted in Fig. 2. The CFA is employed to identify the underlying latent factors that influence the variations in TDLP. To conduct a CFA, it is required to take into account a measurement model that determines the relationships between the measurable traits and the latent factors. The CFA model was used as follows:
Representation of the latent variable of test-day lactation performance (TDLP) and the respective relationships with test-day milk yield (TDMY), test-day fat percent (TDFP), test-day protein percent (TDPP), test-day somatic cell score (TDSCS), and test-day milk urea nitrogen (TDMUN). For each measured variable, the estimates of factor loadings are presented, where e represents the measurement error associated with each measured variable.

ƺ = υξ + δ
In which, ƺ is the vector of measurable traits (TDMY, TDPP, TFPP, TDSCS and TDMUN) in individuals and ξ is the vector of latent factors. ϒ matrix includes factor loadings that relate these factors to the measurable traits, and δ is the vector of residuals. The ‘lavaan’ package (Rosseel, Reference Rosseel2012), which used the maximum likelihood method for estimation, was applied to fit the CFA model in the R environment (R Development Core Team, 2024). The statistical measures of root mean square error of approximation (RMSEA) (Steiger, Reference Steiger1990), standardised root mean square residual (SRMR), Tucker–Lewis Index (TLI), and comparative fit index (CFI) (Bentler, Reference Bentler1990) were employed to assess the overall adequacy of the proposed model for constructing TDLP. The optimum values for goodness-of-fit measures are 1 for CFI and TLI, and 0 for RMSEA and SRMR (Rosseel, Reference Rosseel2012). The final confirmed model was evaluated for bias by permutation employing the ‘bootstrapLavaan’ function of the ‘lavaan’ package (Rosseel, Reference Rosseel2012) with 5000 bootstrap draws. The obtained values for the latent variable of TDLP by fitting CFA followed the standard normal distribution with a mean of zero and a standard deviation of 1.
Statistical analyses
Estimation of genetic and phenotypic parameters
The following multivariate repeatability model under a Bayesian approach was used for estimating genetic and phenotypic parameters for the studied traits:
 \begin{equation*}{{\mathbf{y}}_{\mathbf{i}}} = \,{{\mathbf{X}}_{\mathbf{i}}}{{\mathbf{b}}_{\mathbf{i}}} + \,{{\mathbf{Z}}_{\mathbf{i}}}{{\mathbf{a}}_{\mathbf{i}}} + \,{{\mathbf{W}}_{\mathbf{i}}}{{\mathbf{p}}_{\mathbf{i}}} + {{\mathbf{e}}_{\mathbf{i}}}\end{equation*}
where,  ${{\mathbf{y}}_{\mathbf{i}}}$ represents the vector of the observations for the i-th trait;
 ${{\mathbf{b}}_{\mathbf{i}}}$,,
 ${{\mathbf{p}}_{\mathbf{i}}}$, and
 ${{\mathbf{e}}_{\mathbf{i}}}$ stand for vectors of fixed, direct genetic, individual permanent environmental, and the residual effects for the i-th trait, respectively. The matrices of
 ${{\mathbf{X}}_{\mathbf{i}}}$, and
 ${{\mathbf{W}}_{\mathbf{i}}}$ are design matrices relating corresponding effects to vector
 ${{\mathbf{y}}_{\mathbf{i}}}$. It was assumed a ∼ N (0, A
 $\sigma _a^2$), p ∼ N (0,
 ${{\boldsymbol{I}}_{{\boldsymbol{pe}}}}\sigma _{pe}^2$), and e ∼ N (0,
 ${{\boldsymbol{I}}_{\boldsymbol{n}}}\sigma _e^2$). A is the numerator relationship matrix. Ip and In are identity matrices of appropriate dimensions. Furthermore,
 $\sigma _a^2$,
 $\sigma _p^2$, and
 $\sigma _e^2$ are variances of direct genetic, individual permanent environmental, and residual effects, respectively. Fixed effects considered in the model included the combination of herd, year, and season of sampling as herd-year-season (in 516 levels), age at first calving (in 19 levels from 20 to 38 months of age), and lactation stage in 6 classes (5–50, 51–100, 101–150, 151–200, 201–250, and 251–305 DIM). SAS software (SAS, 2010) was used for significance testing of these fixed effects.
The ‘GIBBS2F90’ programme (Misztal et al., Reference Misztal, Tsuruta, Strabel, Auvray, Druet and Lee2002) was used for estimating posterior means for genetic and phenotypic parameters under a Bayesian approach. The length of the Gibbs chains and the burn-in period were determined by visually analysing the trace plots of the parameters’ posterior samples. The genetic and phenotypic parameters were estimated by executing 500,000 iterations. The initial 100,000 iterations were excluded as burn-in, and the posterior samples from each chain were thinned using intervals of 100 iterations. Finally, 4,000 samples were retained for estimating the posterior means of genetic and phenotypic parameters for each trait using the ‘POSTGIBBSF90’ programme (Misztal et al., Reference Misztal, Tsuruta, Strabel, Auvray, Druet and Lee2002).
Results
Figure 2 illustrates the measurement model considered for the TDLP latent variable. The values of CFI, TLI, RMSEA, and SRMR were 0.98, 0.95, 0.04, and 0.02, respectively. As shown in Table 3, the standardised factor loading for TDMY was positive. At the same time, those of other measurable traits were negative. The standardised factor loadings for TMDY, TDFP, TDPP, TDSCS and TDMUN were 0.46, −0.52, −0.70, −0.14 and − 0.19, respectively, and were statistically significant (P < 0.01).
Standardised factor loadings of the traits used for describing the TDLP latent variable in the Chinese Holstein dairy cows

a TDMY: test-day milk yield, TDFP: test-day milk fat percentage, TDPP: test-day milk protein percentage, TDSCS: test-day somatic cell score, TDMUN: test-day milk urea nitrogen.
The posterior means and their corresponding posterior standard deviations (PSD) for the variance components and genetic parameters related to both the measurable and TDLP traits are shown in Table 4. Posterior means for the heritability of and repeatability estimates of TDLP were 0.26 and 0.34, respectively. In general, the posterior means for estimates of heritability were low to moderate and statistically significant (95% of the highest posterior density [HPD] intervals did not include zero), varying from 0.05 for TDSCS to 0.28 for TDPP. The posterior means for the estimates of repeatability were statistically significant (95% of the HPD intervals did not include zero). The posterior means of repeatability range from 0.15 for TDMUN to 0.38 for TDMY.
Posterior means of the variance components, heritability (h2), and repeatability (r) estimates ± posterior standard deviation (PSD) for the studied traits in Chinese Holstein dairy cows with 95% HPDa intervals in parentheses

a HPD: highest posterior density.
b TDMY: test-day milk yield, TDFP: test-day milk fat percentage, TDPP: test-day milk protein percentage, TDSCS: test-day somatic cell score, TDMUN: test-day milk urea nitrogen, TDLP: test-day lactation performance.
Posterior means ± PSD for the genetic and phenotypic correlations among the investigated traits are presented in Table 5. Estimates of genetic correlations ranged from −0.44 for TDMY–TDPP to 0.73 for TDFP–TDPP. The phenotypic correlations were generally lower than the genetic correlations and ranged from −0.23 for TDMY–TDPP to 0.41 for TDFP–TDPP. The genetic and phenotypic correlation estimates among TDFP and TDPP were positive and statistically significant (95% of HPD intervals did not include zero). Genetic correlation estimates of TDSCS with TDFP, TDPP, and TDMUN were not statistically significant (95% of HPD intervals included zero). Still, the corresponding phenotypic correlation estimates were statistically significant (95% of HPD intervals did not include zero) and had low positive values (Table 5). Genetic correlations of TDFP, TDPP and TDSCS with TDMUN ranged from −0.20 (TDSCS–TDMUN) to 0.45 (TDFP–TDMUN). The corresponding phenotypic correlations ranged from −0.18 (TDFP–TDMUN). In the present study, the estimate of genetic correlation between TDSCS, an indicator of udder health, and TDMUN, as an indicator of N efficiency utilisation trait, was a negative value of −0.20. However, the corresponding phenotypic correlation was not statistically significant (95% HPD interval included zero).
Posterior means ± PSD for genetic (above the diagonal) and phenotypic (below the diagonal) correlations among the studied traits in Chinese Holstein dairy cows with 95% HPDa intervals in parentheses

a HPD: highest posterior density.
b TDMY: test-day milk yield, TDFP: test-day milk fat percentage, TDPP: test-day milk protein percentage, TDSCS: test-day somatic cell score, TDMUN: test-day milk urea nitrogen.
The posterior means ± PSD for the genetic and phenotypic correlation of the latent variable of TDLP with measured traits are shown in Table 6. Genetic and phenotypic correlations between TDLP and TDMY were positive, with estimates of 0.62 and 0.40, respectively. The genetic and phenotypic correlations of TDLP with traits related to milk composition were negative. The genetic correlations ranged from −0.96 (TDLP–TDPP) to −0.11 (TDLP–TDSCS), while those of phenotypic correlations ranged from −0.85 (TDLP–TDPP) to −0.07 (TDLP–TDSCS).
Posterior means ± posterior standard deviation for genetic (rg) and phenotypic (rp) correlations of TDLP latent trait with the traits in the Chinese Holstein dairy cows, with 95% HPDa intervals in parentheses

a HPD: highest posterior density.
b TDMY: test-day milk yield, TDFP: test-day milk fat percentage, TDPP: test-day milk protein percentage, TDSCS: test-day somatic cell score, TDMUN: test-day milk urea nitrogen.
Discussion
The primary aim of using CFA is to reduce dimensionality in a multivariate context, making the interpretation of interrelationships among variables simpler when several phenotypes are simultaneously involved (Silva et al., Reference Silva, Paiva, Botelho, Carrara, Lopes, Silva, Veroneze, Sterman Ferraz, Eler, Mattos and Gaya2022). In the current study, the measures of goodness-of-fit demonstrate the suitability of the CFA model presented for the latent trait of TDLP. In other words, the goodness-of-fit indices indicated that the proposed measurement model provided an appropriate fit to the data. The standardised factor loadings can be regarded as regression coefficients, representing the amount of association between measured traits and the underlying latent variable (Penagaricano et al., Reference Penagaricano, Valente, Steibel, Bates, Ernst, Khatib and Rosa2015). The factor loadings were statistically different from zero (P < 0.01), implying that the observed variables were appropriate indicators of the corresponding TDLP latent variable. A positive (negative) factor loading demonstrates that an increase in any measurable variable is accompanied by an increase (decrease) in the TDLP. In the present study, factor loading of TDMY, as a measure of milk quantity, was positive, while factor loadings of other milk composition and quality traits were negative. In other words, a one-unit increase in TDMY is accompanied by a 0.46-unit increase in TDLP. On the other hand, one unit increase in TDFP, TDPP, TDSCS and TDMUN is associated with 0.52, 0.70, 0.14 and 0.19 unit decreases in the TDLP (Table 3). Therefore, it may be concluded that for constructing the latent variable of TDLP in the first-parity Chinese Holstein dairy cows, emphasis should be on increasing TDMY and decrease of milk composition traits investigated, including TDFP, TDPP, TDSCS and TDMUN. In the present study, the standardised factor loadings of TDCSC and TDMUN were lower in magnitude than those of TDMY, TDFP and TDPP, implying a lower contribution of TDCSC and TDMUN than other observed traits for constructing the latent variable. By applying multivariate factor analysis, Macciotta et al. (Reference Macciotta, Cecchinato, Mele and Bittante2012) used records on milk yield, and some milk composition traits including fat and protein percentages, casein content, lactose percentage, somatic cell count, titratable acidity, and pH in the Italian Brown Swiss cows and extracted four latent variables as indicators of milk composition, coagulation, acidity and mammary gland health. Dadousis et al. (Reference Dadousis, Cipolat-Gotet, Bittante and Cecchinato2018) conducted a multivariate factor analysis and constructed 10 factors, as latent variables, underlying milk yield and quality, protein composition, curd firmness and cheese-making traits in Italian Brown Swiss cows. By applying multivariate factor analysis, Cecchinato et al. (Reference Cecchinato, Masciotra, Mele, Tagliapietra, Schiavon, Bittante and Pegolo2019) constructed 12 latent variables related to the milk fatty acid profile, milk composition (milk yield, contents of milk fat, protein, casein and lactose, and SCS) and udder health in Italian Brown Swiss cows. They performed genetic analyses for these latent variables. They reported the heritability estimates for traits involving milk yield, milk composition (fat and protein) and somatic cell score as a measure of udder health at 0.214, 0.271 and 0.138, respectively.
Due to low to medium posterior means for heritability estimates of the traits, more attention is required to nonadditive genetic and environmental effects when developing a breeding program for improving both observed and latent traits, rather than direct genetic effects. Therefore, managing the temporary environmental effects, such as nutrition and feed quality, and health managerial practices, is of crucial importance. By applying repeatability models, Ma et al. (Reference Ma, Luo, Brito, Chang, Chen, Lou, Zhang, Wang, Guo and Wang2023) estimated heritability values for TDMY, TDFP, TDPP, TDSCS and TDMUN in the Chinese Holstein dairy cows as 0.07, 0.06, 0.09, 0.07 and 0.05, respectively, and the corresponding repeatability estimates as 0.31, 0.14, 0.18, 0.21 and 0.12, respectively, which were lower than the corresponding estimates in the present study. Hossein-Zadeh and Ardalan (Reference Hossein-Zadeh and Ardalan2011) reported heritability estimates for TDMY, TDFP, TDPP, TDSCS, and TDMUN as 0.33, 0.23, 0.27, 0.21 and 0.14 in the first parity of Iranian Holstein dairy cows. Bobbo et al. (Reference Bobbo, Penasa, Rossoni and Cassandro2020) reported values of 0.10, 0.18, 0.36, 0.09 and 0.20 for TDMY, TDFP, TDPP, TDSCS and TDMUN in Italian Brown Swiss dairy cows, which were, in general, close to the obtained values in the current investigation. The differences found for heritability estimates in the literature can be justified, to some extent, by the variations in the data structure, such as herd size, number of records per cow, number of cows per sire and length of the period of data collection (Atashi et al., Reference Atashi and Hostens2021). On the other hand, differences in the genetic structure of the populations, such as inbreeding coefficient, family structure (e.g., number of half-sibs) and relatedness to international Holstein populations, may be important. Therefore, it should be noted that heritability is population-specific, and that direct comparisons with other studies should be done cautiously.
Estimates of genetic and phenotypic correlations between TDMY and other traits were negative and low to medium in magnitude, with the genetic correlations higher than the phenotypic ones (Table 5), implying that TDMY and milk composition traits may not generally be controlled by some common genes. In the present study, negative but low genetic (−0.12) and phenotypic (−0.04) correlations were found between TDMY and TDMUN; therefore, the selection to change MUN concentrations would have little effect on milk yield. Hossein-Zadeh and Ardalan (Reference Hossein-Zadeh and Ardalan2011) pointed out that high levels of MUN are generally considered an indicator of inefficient utilisation of protein, which is economically unfavourable. Such weak genetic correlation was also reported between milk yield and MUN in the Iranian Holstein dairy cows (Hossein-Zadeh and Ardalan, Reference Hossein-Zadeh and Ardalan2011). Generally, due to the weak correlation between MUN and milk yield in the studied population of Chinese Holstein dairy cows, it may be concluded that selection for increased MUN could favour high milk-producing cows in terms of the quantity of protein consumed.
By applying bivariate repeatability models, Ma et al. (Reference Ma, Luo, Brito, Chang, Chen, Lou, Zhang, Wang, Guo and Wang2023) reported genetic correlations between TDMUN and TDMY, TDFP and TDPP in Chinese Holstein dairy cows as low positive estimates that ranged from 0.02 to 0.26. They reported a value of −0.18 for the genetic correlation between TDMUN and TDSCS, which was close to the corresponding estimated value in our study (−0.20). Ma et al. (Reference Ma, Luo, Brito, Chang, Chen, Lou, Zhang, Wang, Guo and Wang2023) reported the phenotypic correlations of TDMUN with TDMY and TDFP as 0.03 and 0.08, and with TDPP and TDSCS as −0.03 and −0.10, respectively.
In the present study, by taking genetic correlations of TDMUN with milk yield and compositions, it may be concluded that the selection for lowering TDMUN would increase TDFP and TDPP and decrease TDMY and TDSCS. Bobbo et al. (Reference Bobbo, Penasa, Rossoni and Cassandro2020) estimated a weak genetic correlation of −0.14 between TDMY and TDMUN in Italian Brown Swiss dairy cows, which was in agreement with the corresponding value for genetic correlation between TDMY and TDMUN in the present study (−0.12). Miglior et al. (Reference Miglior, Sewalem, Jamrozik, Bohmanova, Lefebvre and Moore2007) estimated a value of −0.09 for the genetic correlation between MUN and milk yield. In contrast, they estimated positive genetic correlations between MUN and fat percentage (0.42) and between MUN and protein percentage (0.20) in Canadian Holstein dairy cows, which align with the corresponding estimates in the current investigation.
In the present study, due to a negative genetic correlation between TDSCS and TDMUN, genetic selection to increase organic nitrogen at the expense of inorganic nitrogen of milk would allow a reduction of milk somatic cell count in the studied population of Chinese Holstein dairy cows. The same results were also obtained by Bobbo et al. (Reference Bobbo, Penasa, Rossoni and Cassandro2020) in the Italian Brown Swiss dairy cows. Hossein-Zadeh (Reference Hossein-Zadeh2024) studied genetic correlations of MUN with milk production traits of dairy cows by applying a meta-analysis technique and stated that the genetic correlation estimates between MUN and production traits were low and varied from −0.070 (between MUN and SCS) to 0.357 (between MUN and protein yield). The author obtained a value for the genetic correlation of MUN-milk yield as 0.171, while those of MUN-fat percent and MUN protein percent were not statistically different from zero. Positive genetic and phenotypic correlations between TDMUN and milk composition traits of TDFP and TDPP (Table 4) demonstrate joint genetic and physiological mechanisms directing these traits and indicate that selecting against higher milk fat and protein percent results in an increase in MUN in the Chinese Holstein Dairy cows.
Posterior means for genetic and phenotypic correlations between TDLP and TDMY were positive, but those between TDLP and other investigated traits related to milk composition (TDFP, TDPP, TDCSC and TDMUN) were negative. A positive relationship between TDLP and TDMY was also confirmed by an associated positive factor loading (Table 3). On the other hand, negative relationships between TDLP and milk composition traits (TDFP, TDPP, TDCSC and TDMUN) were confirmed by the corresponding negative factor loadings (Table 3).
The highest negative factor loading and the strongest negative genetic and phenotypic correlations of TDLP are with TDPP, implying TDLP is almost inversely and highly related to milk protein content in the first-parity Chinese Holstein dairy cows. The lowest negative factor loading and the weakest negative correlation of TDLP is with TDSCS, suggesting TDLP is less influenced by the somatic cell score (an indicator of udder health) in the first-parity Chinese Holstein dairy cows.
Conclusion
Statistical evidence showed the adequacy of the application of LVM for constructing the latent variable of TDLP in the first-parity Chinese Holstein dairy cows. The obtained results showed the moderate contribution of direct genetic effects to the phenotypic variance of the measurable traits (except for TDSCS) and the TDLP latent variable of the Chinese Holstein dairy cows, which would provide the opportunity for genetic selection for improving these traits. It may be concluded that breeding for higher TDLP might increase milk yield (TDMY) but could reduce milk protein content (TDPP) and other milk composition traits. In general, the strong negative genetic correlations suggest a trade-off between milk quantity (yield) and quality (composition).
Acknowledgements
The authors would like to thank the Inner Mongolia Academy of Agricultural and Animal Husbandry Sciences, Hohhot, 010031, China, for supporting the study.
Funding statement
This research received financial support from Inner Mongolia Major Science and Technology Program (2021GG0102), Inner Mongolia Agriculture and Animal Husbandry Innovation Fund (2023CXJJM01), 2023 Inner Mongolia Grassland Talent Program, and Foreign Young Talents Program (QN2023005001L).
Competing interests
The authors certify that there are no conflicts of interest among authors and between authors and other people and organizations.
Ethical standards
Not applicable.
Author contributions
H.L., M.M., A.E. and R.T. developed the theoretical framework and analysed the data. J.T., G.S., M.Z., X.W., L.J., L.C. and J.Z. were involved in data collection and monitoring. H.L. and M.M. wrote the primary version of the manuscript. All authors have contributed to the manuscript revision and have read and approved the submitted version.
AI contributions to research content
AI was used to improve the writing quality of the manuscript.