In the United States, low Latino and Asian American voter registration and turnout is often attributed to language barriers that preclude active political engagement. When reviewing the Voting Rights Act (VRA) in 1975, Congress described discrimination on the basis of language as “national and pervasive in scope,” stating, “where State and local officials conduct elections only in English, language minority citizens are excluded from participating in the electoral process” (Schmidt Reference Schmidt2000, 2). Convinced by a state-by-state review of such discrimination, Congress subsequently added formal protections for “language minorities” to the VRA. As a result, many citizens who were once excluded from an English-only political process gained access to ballots, registration materials, and oral assistance in their native languages.
Over the past four decades, this federally mandated multilingual election assistance has sought to increase political participation among language minority citizens, including Latinos, Asians, and Native Americans who are not native English speakers. These individuals are counted among the growing limited English proficient (LEP) population in the U.S. which is multi-racial, multi-ethnic, and largely immigrant. In 2010, 25.2 million people reported speaking English “less than very well,” and consistent with recent immigration trends, 66% of the total LEP population is Spanish-speaking (Pandya, McHugh and Batalova Reference Pandya, McHugh and Batalova2011). The potential impact of VRA coverage for Latinos and Asian Americans is substantial, particularly as increasing numbers of immigrants become U.S. citizens. For example, approximately one-quarter of all potential Asian American voters are covered by the language provisions––that is, roughly one in four Asian Americans who are eligible to vote are LEP and reside in a county or municipality required to provide election materials in the citizen's native language (Tucker Reference Tucker2012). The intended impact of VRA coverage is also distinctly needed among these communities. Turnout rates among Asians and Latinos remain far lower than those among African Americans and non-Hispanic whites, even after accounting for citizenship status (File Reference File2013). Clearly, the provision of multilingual election assistance has the potential to increase the political participation of language minorities. But do these provisions actually impact voter registration and turnout for covered groups?
Focusing on jurisdictions that could be required to provide multilingual election assistance, this study examines the impact of VRA coverage on political participation among two large and fast-growing minority populations in the United States. We begin by reviewing the language provisions of the VRA, the expected mechanisms likely to impact Latino and Asian American participation, and evidence suggesting that election officials largely comply with VRA mandates. We then explore past findings regarding the impact of the VRA language provisions, demonstrating that few authors have utilized a research design appropriate for evaluating the direct impact of the provisions. Taking advantage of the discontinuity in coverage created by the population-based assignment mechanism, we join other recent political science research in using a regression discontinuity (RD) design to study treatment effects on a causal basis (Eggers et al. Reference Eggers, Fowler, Hainmueller, Hall and Snyder2015; Green et al. Reference Green, Leong, Kern, Gerber and Larimer2009; Hopkins Reference Hopkins2011). Our study leverages the availability of the precise Census data used to determine coverage status, combining this information with detailed measures of individual-level voter registration and turnout for Latinos and six Asian language groups across 1,465 counties and municipalities and thus analyzing the behavior of millions of Latino and Asian American citizens nationwide.
Comparison of 2012 voting and registration rates for jurisdictions just above and below the coverage threshold reveals distinct impacts of the VRA language provisions for both Latinos and Asian Americans. To briefly summarize our results, we find that VRA coverage increases voter registration for Latino citizens by 14–16 percentage points, while voter turnout of registered Asian Americans increases 15–18 percentage points relative to non-Asians from the same jurisdiction. These findings appear despite high variance in our estimates due to the relative paucity of jurisdictions near the discontinuity, and we confirm similar patterns among a subset of jurisdictions whose coverage status is determined “at random” due to the Census measurement error in establishing the requisite size of the language minority population. While the precise mechanism linking language assistance to Latino and Asian American mobilization remains a topic of future research, our findings indicate the VRA language provisions appear to function as intended.
The VRA Language Provisions
Voting is often characterized as a “costly” activity at the individual level, with voters weighing the costs and benefits of political participation (Downs Reference Downs1957; Riker and Ordeshook Reference Riker and Ordeshook1968). Frequently cited modern-day costs of voting include voter registration and political information acquisition, both of which are amplified for language minorities. For example, barriers to comprehension of English voter registration materials may lead to lower registration rates (Ong and Nakanishi Reference Ong, Nakanishi, Nakanishi and Lai2003), and limited English proficiency may limit access to political information (Highton and Burris Reference Highton and Burris2002). Yet even after registering to vote and gaining appropriate political information, language minorities face extra challenges in the ballot box as issues with ballot comprehension (e.g., Niemi and Herrnson Reference Niemi and Herrnson2003) are made all the more difficult for those who do not speak English in an English-only election. Thus, the relationship between low levels of English proficiency and lower political participation is well established (Cho Reference Cho1999; Barreto and Muñoz Reference Barreto and Muñoz2003; Wolfinger and Rosenstone Reference Wolfinger and Rosenstone1980).
The VRA language provisions are designed to address these disparities. The primary method of gaining language-based coverage for language minorities is outlined in Section 203 of the VRA.Footnote 1 If covered, a jurisdiction is required to provide voting assistance in both the primary language of the covered group and English for every election or referenda within the jurisdiction. This assistance includes not only multilingual ballots but also publicity, election materials, registration forms, and oral assistance through translators.Footnote 2 Congressional inquiries suggest the implementation of such assistance, when mandated, is widespread. For example, in 1984, Congress directed the Government Accountability Office (GAO) to study the cost and usage of multilingual voting assistance in elections nationwide. The GAO sent survey questionnaires to covered jurisdictions, finding multilingual voting assistance was “widely available” with 98% of polled jurisdictions providing assistance of some sort (GAO 1986). In 1997, a separate GAO report found 93% of surveyed areas provided some sort of multilingual voting assistance in the 1996 election (GAO 1997). More recently, a 2008 study surveying a small number of jurisdictions ascertained that 13 of 14 areas, approximately 93%, provided coverage (GAO 2008). Over the past several decades, government reports have consistently asserted that voting assistance is made available when mandated.
Political scientists have also assessed the implementation of the VRA language provisions, including two survey-based analyses of the distribution and quality of language assistance offered in covered jurisdictions. The first, a survey conducted by Tucker and Espino (Reference Tucker and Espino2006, Reference Tucker and Espino2007), mailed questionnaires to 810 covered jurisdictions in 33 states. The survey is far and above the largest ever conducted to determine VRA compliance related to the language provisions, with the authors finding that approximately 80% of responding jurisdictions provided either written or oral language assistance (Tucker and Espino Reference Tucker and Espino2007). The second study, consisting of on-site examination of language assistance availability in 89 covered jurisdictions in 15 states, found similar levels of compliance, with 86% providing written materials, 80% providing bilingual election personnel, and 68% providing both of these forms of assistance (Jones-Correa and Waismel-Manor Reference Jones-Correa, Waismel-Manor and Henderson2007). Although not as high as the numbers reported by the GAO, these surveys likewise indicate relatively widespread provision of language assistance.
Thus, the aims and directives of the VRA language provisions are well understood, and by all accounts, levels of compliance are high. However, the extent to which longstanding, persistent disparities in participation are remedied by the provisions remains much less clear. Amidst dramatic changes in the nation's racial and ethnic landscape, largely due to immigration from Latin America and Asia, the issue of multilingual election assistance has received increased attention as demographic shifts have led to greater numbers of minority voters and a concomitant growth in language minority voters. Studies of the impact of the language provisions on voter registration and turnout have the potential to inform policies and other efforts to politically incorporate these fast-growing immigrant populations. Moreover, the difference that voting rights-related policies make has become the subject of increased scrutiny. Divided on whether racial inequality and discrimination continue to threaten American democratic processes, the U.S. Supreme Court recently struck down Section 4 and, with it, effectively Section 5 of the VRA (Persily and Mann Reference Persily and Mann2013), raising concerns that federal mandates for language provisions may also be vulnerable in the future.
The Impact of the Language Provisions on Participation
Such concerns may stem from limited assessments of the participatory impact of the VRA language provisions. Only a handful of academic studies have examined the extent to which multilingual voting assistance increases registration and turnout for covered groups. Lien (Reference Lien2001) cites high levels of assistance use by Asian Americans, particularly for the first-time voters who would presumably be deterred by an English-only voting environment. Jones-Correa and Ramakrishnan (Reference Jones-Correa and Ramakrishnan2004) also find evidence of higher levels of voter registration by both Asians and Latinos in covered jurisdictions versus non-covered areas. Voter turnout, however, has not been shown to be significantly different in covered jurisdictions for Asian Americans, although it appears higher for Latinos (Jones-Correa Reference Jones-Correa2005). In a RD study addressing both Latino voter turnout and white backlash against language assistance, Hopkins (Reference Hopkins2011) finds a significant, positive impact of coverage on California block groups with a large proportion of LEP individuals, controlling for a variety of Census block, tract, and county demographics. Finally, we note that studies of the impact of the language provisions on Native American populations remain few, although one study of San Juan County, Utah, and the state of New Mexico finds evidence of increased voter turnout after VRA coverage was enacted in 1984 (McCool, Olson and Robinson Reference McCool, Olson and Robinson2007).
Taken together, the existing literature presents inconclusive findings on the extent to which multilingual election assistance increases political participation among covered groups. As noted by Hopkins (Reference Hopkins2011), the inconsistent results produced by past literature may imply weak identification of the mechanisms underlying potential increases in participation. Of course, coverage under the language provisions could function to reduce the aforementioned barriers to acquisition of election information posed by limited English proficiency, making it substantially easier to participate (Hopkins Reference Hopkins2011). On the other hand, some previous studies have found no direct effect of the provisions, asserting that multilingual election assistance encourages participation primarily by sending a symbolic “welcoming message”—that is, independent of actual availability or utilization of assistance (de la Garza and DeSipio Reference de la Garza, DeSipio and Garcia1997; Parkin and Zlotnick Reference Parkin and Zlotnick2014).
We clarify the impact of the language provisions through two important innovations over past work. First, the majority of previous studies have analyzed California-specific data, a state with longstanding (and, currently, statewide) coverage due to large immigrant populations, including and especially Latinos. Such an area may be most susceptible to the indirect, symbolic effect of the language provisions due to decades of coverage and, at the same time, most likely to have higher rates of language assistance use and mobilization of language minority groups. In an effort to unpack the mechanisms at work, this study aims to establish the short-term participatory impacts of multilingual election assistance, focusing on participation in the election immediately following the most recent round of coverage determinations in jurisdictions nationwide. Furthermore, since our analysis broadens the geographical scope to include jurisdictions outside of the Southwest, the empirical findings presented here may be more applicable to regions likely to gain coverage in the future—indeed, nearly all areas thought to be “traditional” immigrant destinations already have coverage. Exclusion of areas with long-term coverage also better reflects the early stages of implementation shared by many communities today and those likely to be experienced by newly covered jurisdictions going forward.
Second, in part due to data constraints, prior work has tended to examine Latinos only, with Asians left unexamined or leaving null or counterintuitive findings unexplored. Should we expect similar impacts for language minorities that are not Spanish-speaking or for communities without an extensive history of coverage under the VRA? Below we expand the scope of analysis to include Asian American communities. Asian Americans are not only the fastest-growing minority group but also comprise the largest share of new immigrant arrivals (Pew Research Center 2013). Our study features turnout and registration data for six ethnic/national origin groups—Chinese, Filipino, Indian, Japanese, Korean, and Vietnamese—which constitute 85% of the single-race Asian population in the U.S. according to the 2010 Census. Examining both Asians and Latinos in a single study allows for a more complete analysis of the effect of language assistance on participation for the vast majority of populations that could gain coverage in the future.Footnote 3
Research Design
As noted above, the VRA language provisions are designed to provide assistance to individuals in their native language if certain coverage triggers are met. The VRA provides two methods for coverage under Section 203(c). First, a county or equivalent political jurisdictionFootnote 4 may gain coverage if the LEP citizen voting-age population (VACLEP) is 10,000 or more and has an illiteracy rate higher than the average rate for non-language minority individuals in the jurisdiction. Second, a jurisdiction may gain coverage if 5% of the subdivision's population meets the same qualifications.Footnote 5
Such knowledge of the precise coverage mechanism provides a relatively rare opportunity to study the VRA language provisions as a natural experiment, estimating the treatment effect via a RD design. First introduced by Thistlethwaite and Campbell (Reference Thistlethwaite and Campbell1960), the most common type of RD design depends on a “sharp” discontinuity in treatment assignment, where subjects above a threshold on a known, continuous criterion receive treatment, while those below the threshold do not. If we compare subjects just above and just below the threshold, on average we should expect no difference between subjects on observable or unobservable characteristics, save treatment (Dunning Reference Dunning2012; Green et al. Reference Green, Leong, Kern, Gerber and Larimer2009; Imbens and Lemieux Reference Imbens and Lemieux2008). In this way, we can estimate the local average treatment effect (LATE), using appropriate parametric or non-parametric methods (Lee and Lemieux Reference Lee and Lemieux2010). Most political scientists using RD designs leverage close election results to examine political or economic outcomes in a causal fashion, leading to some debate regarding the possibility of non-random assignment due to electoral manipulation (Caughey and Sekhon Reference Caughey and Sekhon2011; Eggers et al. Reference Eggers, Fowler, Hainmueller, Hall and Snyder2015). However, in this case, we have little reason to suspect that interested parties can influence their jurisdiction's precise location near the threshold (Hopkins Reference Hopkins2011), and thus the discontinuity in treatment outcomes allows for estimation of a causal effect (Lee Reference Lee2008).
Following the technique pioneered by Hopkins (Reference Hopkins2011), we use individual-level information regarding the political participation of language minority citizens and requisite measures of the coverage mechanisms to estimate the impact of coverage under the VRA language provisions.Footnote 6 While the individual-level data used by Hopkins (Reference Hopkins2011) consisted of survey responses, we instead leverage official records of registration and turnout, combined with an estimate of individual ethnic/national origin group, aggregated to the jurisdiction level. Thus, for each county, municipality, or other relevant sub-state jurisdiction eligible for coverage, we calculate measures of turnout and registration by language minority group. With this, we can compare participation for jurisdictions near the discontinuity provided by the coverage mechanism.Footnote 7
While the next section details the data used to build these measures, if we are to hypothesize about the effect of VRA coverage on a specific group, we may want to account for jurisdiction-level variation in registration and turnout attributable to factors outside of coverage. In theory, the RD design accounts for preexisting differences in such factors across treatment and control conditions. However, because a relatively small number of jurisdictions lie near the discontinuity, and given the greater power required by RD designs to extract effects with precision similar to a true experiment (Schochet Reference Schochet2009), we supplement the RD with a non-parametric fixed effects approach in an attempt to enhance the efficiency of our estimates.Footnote 8 Such an approach entails the construction of jurisdiction-normalized measures of turnout for each language minority group, which accounts for any electoral or demographic factors that may influence turnout for everyone in the county or municipality.Footnote 9 After procuring the raw turnout/registration rate for each ethnic/national origin group, we subtract the turnout/registration rate of non-group members, yielding a measure of participation relative to others within the same jurisdiction.Footnote 10 Relative rates of voter turnout and registration were calculated for each covered group and in every jurisdiction, and these serve as an alternative dependent variable throughout the analysis. If the VRA language provisions have an impact on participation for a covered group, we should witness a positive difference in relative rates of voter turnout and registration when comparing jurisdictions in the treatment (covered) condition to those in the control (not covered) condition.
Data
The key to a sharp RD design is detailed data on the continuous variable used to determine treatment assignment. In this case, VRA coverage is determined by the total number and percentage of jurisdiction residents from a single language minority group who are (a) citizens, (b) LEP, and (c) of voting age, or the VACLEP population.Footnote 11 Historically, the Census Bureau provided data from long-form Census responses to the Department of Justice, which then reported the jurisdictions that qualified for coverage.Footnote 12 When the VRA was renewed in 2006, and upon elimination of the long-form Census, determinations regarding coverage were switched to a 5-year average of responses to the American Communities Survey (ACS). The first round of determinations using ACS results (from 2005 to 2009) were reported in 2011 and applied to 2012 elections.Footnote 13 In total, 248 jurisdictions qualified for coverage, covering 14.8 million citizen voting-age Latinos and 4 million Asian Americans. The Census Bureau subsequently released public use data on each jurisdiction, covered or not, including information on the number of LEP, voting-age citizens by language group.Footnote 14 We use these determinations data, extracting the VACLEP and its associated percentage as variables used to determine treatment assignment and placement along the continuum used for the RD design.Footnote 15
The first part of our dependent variable is constructed from a nationwide individual-level voter registration and turnout database. Developed by Catalist, LLC, a vendor to political campaigns, the database consists of sorted and merged state-level registered voter lists.Footnote 16 Catalist has 225 million individual-level records as of July 2013.Footnote 17 In addition to imputing all available information from the registration list, including indicators for individual turnout in a given election, Catalist, through a contract with CPM Ethnics, combines first, middle, and last name matching with Census block-level population estimates to predict the ethnic/national origin background of every registrant in the country. While existing studies have relied on name matching of registrants to Spanish surname lists (Barreto, Segura and Woods Reference Barreto, Segura and Woods2004; Henderson, Sekhon and Titiunik Reference Henderson, Sekhon and Titiunik2013), the technique used by Catalist provides information on national origin group as well. The proprietary method used by Catalist and CPM Ethnics is rooted in well-understood principles of individual race prediction (Elliott et al. Reference Elliott, Fremont, Morrison, Pantoja and Lurie2008); it is also highly effective when compared with self-reported race and ethnicity.Footnote 18 In addition to the Hispanic/Latino population, which is considered a single language minority group by the Census Bureau, we have jurisdiction-level statistics of voter turnout and registration by Asian Indian, Chinese (including Taiwanese), Filipino, Japanese, Korean, and Vietnamese individuals.Footnote 19
Because our counts of registrants and voters are from the 2012 election, the denominator of our dependent variable must approximate the eligible electorate in 2012. For measures of voter turnout, we use the count of registered voters by language minority group. Determining the population eligible to be registered for the 2012 election is more difficult. The ACS includes 2012 estimates of the citizen voting-age language minority group population for Latinos and Asian Americans; however, it only provides a special tabulation on specific Asian American groups for 2010. We construct an estimate of those eligible to register by language group by assuming the same rate-of-change for all Asian subgroups within a jurisdiction, then we adjust the 2010 figures to align with the 2012 5-year estimates.Footnote 20 By combining this with the Catalist registration figures, we can thus compute registration rates by group and county or municipality.Footnote 21
In addition to registration and turnout rates for language minority groups, we also build corresponding rates for the non-language minority population. We again draw on the Catalist database, extracting the total count of registrants and voters in the 2012 election and combining this information with ACS data on eligible adults (for registration rates) or official voter registration figures (for estimates of voter turnout). Subtracting these rates from the jurisdiction-level participation of the language minority group of interest yields the aforementioned relative rates of political participation. Again, these relative rates account for jurisdiction-level factors that impact registration and turnout for all citizens yet are unrelated to coverage under the language provisions.
Results
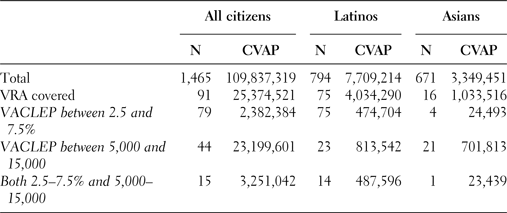
Prior to conducting the RD analysis, some recognition of the distribution of jurisdictions across coverage scenarios is in order. After removing the language groups that are not analyzed and places located in states that are covered in their entirety, the public use VRA determinations data contain 1,465 observations.Footnote 22 Again, observations are defined as jurisdiction-language group pairs, as a single jurisdiction may qualify for coverage for multiple languages, if each language group meets the required threshold. Table 1 indicates that only 91 of the 1,465 jurisdictions have VRA coverage for Spanish or any Asian language, constituting 6% of all observations. That said, the distribution of the population across coverage conditions is uneven, as 25 million voting-age citizens live in these 91 counties or municipalities, or 23% of individuals in the study. Breaking down estimates by language group, Table 1 also shows that nearly one-third of Asian American voting-age citizens and over half of voting-age Latinos in the dataset live in covered areas.
Jurisdiction counts and population size, by proximity to discontinuity

Note: Excludes jurisdictions covered due to statewide coverage. VACLEP represents voting-age limited English proficient citizens and includes language minority individuals from any group for All Citizens column. CVAP is voting-age citizens of any English ability. Jurisdictions listed in the final row of the table are not included in the prior two rows.
While relatively few jurisdictions have coverage in the dataset, how many are close to the coverage thresholds? The third through fifth rows of Table 1 indicate that approximately 138 jurisdictions are within 2.5 percentage points of the 5% VACLEP cutoff for VRA coverage, and/or within 5,000 persons of the 10,000 VACLEP population threshold. Asian language groups are far more likely to be close to coverage under the population threshold, while Latinos meet the percentage cutoff more frequently. As a result, RD estimates for both the population and percentage triggers for coverage will be analyzed, and results for Latinos, Asian Americans, and both sets of groups combined will be provided.
Voter Registration
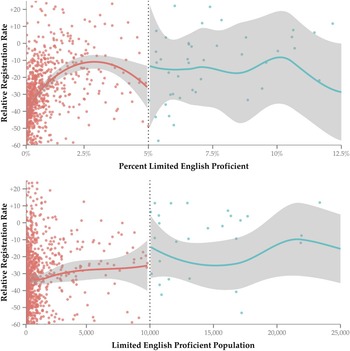
Figure 1 provides initial evidence for a possible discontinuity in outcomes resulting from crossing the coverage thresholds for the VRA language provisions. Each point in the scatterplot represents a jurisdiction-group pair, with the observation's group-specific percent or population LEP indicated on the x-axis and the relative voter registration rate on the y-axis.Footnote 23 Relative voter registration rates for language minority groups may increase slightly near the two discontinuities at 5% and 10,000 persons. However, the 95% confidence interval for the local linear regression indicates substantial uncertainty, both in the magnitude of the observed difference and the likelihood that covered and non-covered rates differ significantly near the discontinuity. In fact, a curvilinear relationship appears to form in relative rates below the percentage cutoff, as relative rates increase until approximately 2.5% of the jurisdiction comprises LEP language minority group members, then decrease until the threshold.
Relative Rate of Voter Registration, by Percent and Population VACLEP. Note: Points represent observed relative participation rates for jurisdiction-language group pairs and correspond to the subset of observations within the bounds indicated by the axes. Observations below the discontinuity are indicated in red and those above the discontinuity in blue. Solid line depicts tricubic weighted local linear regression fit to full dataset, with α = 0.75. 95% confidence interval is depicted in gray.

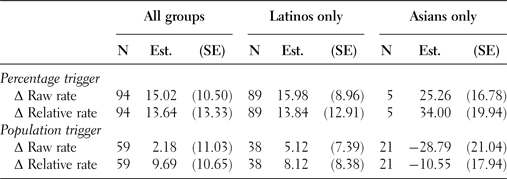
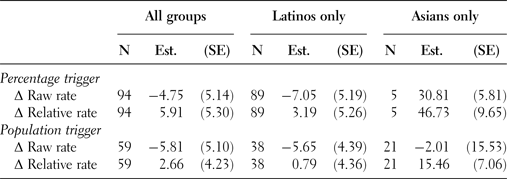
As noted in Lee and Lemieux (Reference Lee and Lemieux2010), visual evidence of a discontinuity should not be considered definitive evidence of a true causal effect found via an RD design. Table 2 instead provides estimates drawn from separate local linear regressions fit to observations on either side of the discontinuity, using a bandwidth of 2.5 percentage points in the case of the percentage trigger and 5,000 persons for the population trigger.Footnote 24 Examining the combined estimates for Latinos and Asian Americans, we find a positive LATE, indicating that the language provisions of the VRA lead to an increase in voter registration rates of as much as 15 percentage points. However, uncertainty in the estimates is quite high. For Asian language groups, with only five observations using the percentage threshold and 21 observations via the population criterion, estimation error appears particularly substantial. The clearest evidence of an effect is for Latinos when using the raw registration rate and percentage trigger, where the 16 percentage point increase is significant at the 90% level in a two-sided test. Given the error inherent in estimates of the eligible population by jurisdiction and the strict test posed by an RD design (Schochet Reference Schochet2009), the results in Table 2 provide at very least suggestive evidence of a positive impact of VRA coverage on voter registration.
Regression discontinuity estimates, voter registration rates

Note: RD estimates drawn from a kernel regression estimated on both sides of the discontinuity, using the rdd package (Dimmery Reference Dimmery2013). Bandwidth is 2.5 percentage points for the Percentage trigger and 5,000 persons for the Population trigger. Standard errors are robust to heteroskedasticity, with a degrees of freedom correction due to the small sample size near the discontinuity (Long and Ervin Reference Long and Ervin2000; White Reference White1980).
Voter Turnout
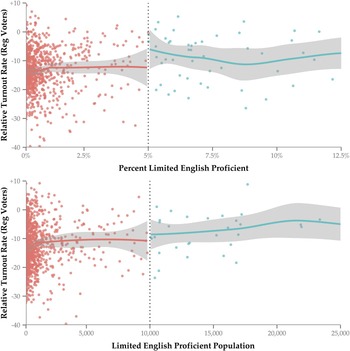
Building on the Hopkins (Reference Hopkins2011) study of voter turnout in VRA covered counties, Figure 2 indicates jurisdiction-level voter turnout among registrants. Again, a local linear regression serves to denote the trends found above and below the discontinuity. We see a similar pattern in distribution of points across the discontinuity, where again participation appears to be slightly, though not significantly, higher for observations just to the right of the coverage threshold. While variance in the estimates has been reduced substantially relative to Figure 1, again the plots only offer evidence suggesting a treatment effect attributable to VRA coverage.
Relative Rate of Voter Turnout, by Percent and Population VACLEP. Note: Points represent observed relative participation rates for jurisdiction-language group pairs and correspond to the subset of observations within the bounds indicated by the axes. Observations below the discontinuity are indicated in red and those above the discontinuity in blue. Solid line depicts tricubic weighted local linear regression fit to full dataset, with α = 0.75. 95% confidence interval is depicted in gray.

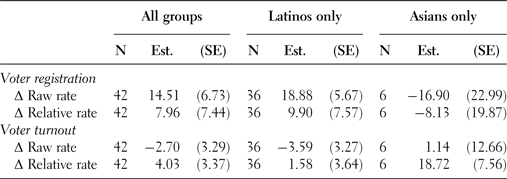
Corresponding estimates of the LATE drawn from local linear regressions on either side of the threshold may be found in Table 3. By design, Table 3 and Figure 2 have removed variation in turnout due to shifts in voter registration rates.Footnote 25 Limited evidence emerges for increased Latino turnout due to coverage under the language provisions, except through increased registration. Instead, results are perhaps most striking for Asian American turnout, where Table 3 indicates a 47 point increase in turnout for covered Asian language groups relative to others in the jurisdiction. With so few cases within the bandwidth, however, we may be concerned that the RD design has not accounted for systematic differences between treated and control observations. Examining the population trigger with a larger number of cases, we continue to see a substantial, though attenuated, 15 percentage point increase in Asian American turnout. To summarize, while no effects are found for Latinos, we see significantly higher turnout among Asian American registrants from covered language groups just above the discontinuity.
Regression discontinuity estimates, voter turnout rates

Note: RD estimates drawn from a kernel regression estimated on both sides of the discontinuity, using the rdd package (Dimmery Reference Dimmery2013). Bandwidth is 2.5 percentage points for the Percentage trigger and 5,000 persons for the Population trigger. Standard errors are robust to heteroskedasticity, with a degrees of freedom correction due to the small sample size near the discontinuity (Long and Ervin Reference Long and Ervin2000; White Reference White1980).
Cases with Coverage Determined “At Random”
While the above findings point to a shift in participation associated with crossing the coverage threshold, it is worth revisiting the notion that the RD design allows us to estimate the causal impact of the VRA language provisions. Of course, our methodological approach does not allow us to get around the fact that we are working with observational data; we are not conducting a true experiment (Dunning Reference Dunning2012). In the context of this study, it would be impractical to randomly assign some jurisdictions to provide materials while leaving language minorities in other areas without the assistance they need to participate in politics. However, the Census Bureau admits that substantial estimation error remains when assessing the size of the language minority population within a jurisdiction (Joyce et al. Reference Joyce, Malec, Little, Gilary, Navarro and Asiala2014). Specifically, the relatively small county- and municipality-level samples used in the ACS make it difficult to precisely measure the size and characteristics of the language minority population, especially when such a population is small enough to be near the coverage thresholds of 5% or 10,000 persons. As a result of this uncertainty, some jurisdictions are subject to coverage despite the fact that mismeasurement could plausibly throw into doubt the jurisdiction's position above or below the legally-defined threshold. While not truly random, as in expectation the reported coverage assignment is correct, we may assert that vagaries in survey responses, sampling techniques, or a host of other factors that go into the construction of the ACS figures could instead be responsible for coverage assignment.
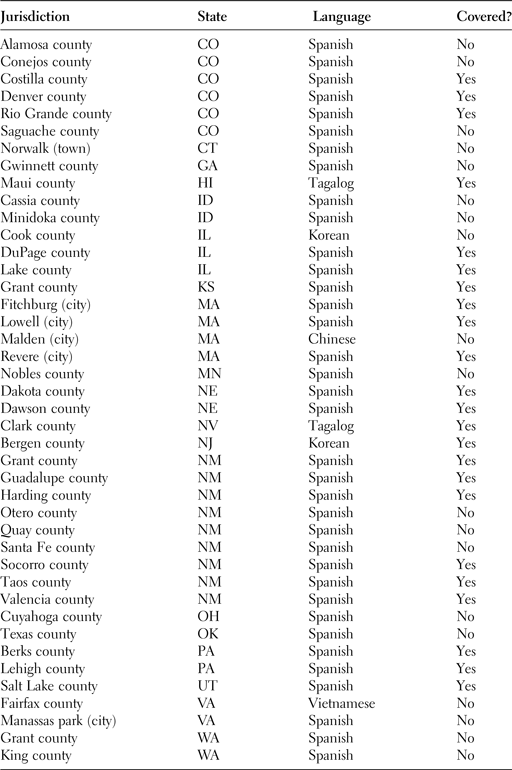
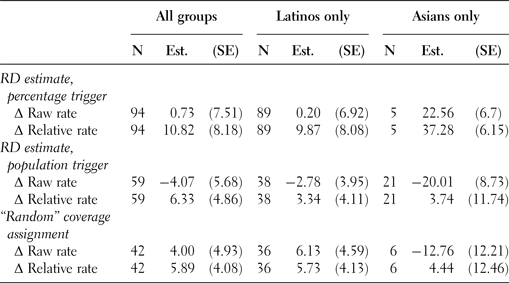
Using the margin of error statistics provided by the Census Bureau's VRA determinations file, we discovered 42 jurisdictions where the margin of error for the size or percent of the population that is VACLEP indicates a substantial chance that the “true” size of the population would result in a change in coverage assignment versus what the Census-provided statistic indicates.Footnote 26 In a substantive sense, these cases have been assigned coverage “at random.” A simple, non-parametric difference in means test conducted on these cases may then serve to approximate the causal impact of the VRA language provisions for these 42 jurisdictions.
Table 4 indicates that the key impacts found via the RD framework indeed appear when studying the subset of jurisdictions with “random” coverage assignment. Specifically, the 16 point boost in raw registration rates for Latinos found in Table 2 is similar to the 19 point increase displayed in Table 4. However, we do not see a consistent impact of coverage on Latino turnout.Footnote 27 Instead, the quite striking result found in Table 3 for Asian language groups, where relative rates of turnout increased significantly, is replicated in the “randomized” subset. A nearly 19 point increase in relative turnout further demonstrates that the results found through the RD design are not attributable to chance.
Difference in means, “Random” coverage assignment

Note: Only includes observations where Census calculated 90% confidence interval for percent VACLEP or VACLEP population estimate crossed the coverage threshold, such that there is a substantial chance coverage determination subject to estimation error. Estimates are difference of means tests for covered versus non-covered jurisdictions. Conventional standard errors are shown in parentheses.
Discussion
Out of 1,465 eligible jurisdictions in our dataset, 91 counties and municipalities have coverage for Latinos or any Asian language group. Despite a small set of jurisdictions near the coverage threshold, we observe two striking patterns that imply a significant impact for the language provisions of the VRA: a roughly 14–16 percentage point increase in Latino voter registration and a 15–18 point increase in relative turnout rates among registered Asian Americans. These findings likewise appear if we vary the bandwidth used to compute the treatment effect as well as when studying a smaller subset of 42 localities gaining coverage “randomly,” where mismeasurement of the variables used to assign coverage status approximates random assignment. Taken together, the results of this analysis should further encourage those concerned with whether language provisions in U.S. elections, and voting rights more broadly, yield positive participatory impacts as intended.
Yet we have also noted the high variance that appears with the small set of jurisdictions examined. What may be contributing to such imprecision? One possibility is variation in the availability of multilingual election assistance among non-covered jurisdictions. As previously discussed, numerous studies have confirmed that the provision of multilingual election assistance largely occurs in jurisdictions where it is federally mandated; however, it can also occur in jurisdictions where it is not. The language minority populations residing in these areas may be fast-growing but not large enough to trigger coverage, yet administrators may still make translated materials available, motivated by their own normative beliefs or in response to pressure from community groups.Footnote 28 Furthermore, among covered jurisdictions, the requirement to provide multilingual election assistance can be met in different ways. For example, some jurisdictions may focus on outreach to language minority populations through translated websites or online resources, while others may prioritize training bilingual poll workers, and still others may provide multilingual ballots only and nothing beyond (Higgins Reference Higgins2015). In short, we believe there is a more nuanced compliance story for future studies to unpack.
In addition, our findings underscore the need for close attention to the mechanisms that may produce higher rates of registration and turnout among language minority voters. To this end, we recognize the central importance of mobilization. One prominent theory suggests that mobilization may be encouraged by the presence of co-ethnic representatives or candidates for office (Barreto Reference Barreto2007, Reference Barreto2010; Bobo and Gilliam Reference Bobo and Gilliam1990), though we do not see evidence of higher rates of Latino or Asian American officeholding in jurisdictions just above the coverage threshold.Footnote 29 Yet factors aside from those related to formal political power may also impact the participation of Latinos and Asian Americans. For example, many organizations serving and advocating for underrepresented immigrant communities field extensive get-out-the-vote campaigns prior to upcoming elections (García Bedolla and Michelson Reference García Bedolla and Michelson2012). Similarly, Latino and Asian American media such as Spanish-language radio or Vietnamese-language newspapers can play a significant part in mobilizing language minority populations (Ramírez Reference Ramírez2013). Without a doubt, there exist multiple sources of exposure to campaigns, messages, and other mobilization efforts that may complicate our results and thus merit examination in greater depth.
Finally, we highlight the importance of these findings in the context of recent challenges to the VRA more generally. While issues of minority rights and representation have long been at the forefront of policymaking and public debate, the continued need for VRA protections has been increasingly called into question. The high-profile ruling in Shelby County v. Holder (2013) reinvigorated discussions of race and voting rights, igniting tensions over the extent to which the participation of minorities in U.S. elections still warrants federally mandated protection. Controversy surrounding the VRA language provisions, in particular, reflects both disagreements over the persistence of racial inequality and heightened anxieties over immigration—for example, beliefs that multilingual election assistance threaten national unity or national identity (e.g., Gaouette Reference Gaouette2006; Hernandez Reference Hernandez2006). Importantly, this controversy has also focused on disagreements over cost effectiveness, with opponents citing undue burdens on state and local governments and the need to explain spending on such measures to antagonistic constituents (Norby Reference Norby2006; Schmidt Reference Schmidt2000). By demonstrating a causal link between VRA coverage and increased political participation, our findings may help to advance the case that VRA protections for language minorities are indeed worth the cost.
We began this study by acknowledging the ultimate goal of the VRA language provisions: inclusion and incorporation of language minority citizens in the political process. While some past evidence suggested a positive impact of multilingual ballots and other election assistance on participation, we provide more conclusive evidence that registration and turnout among fast-growing language minority groups, both Latino and Asian, increase systematically due to coverage. Though much work remains to be done, particularly toward clarifying the long-term impact of the VRA language provisions, our analysis is well-positioned to inform policymakers and advocates seeking to understand whether this over forty-year-old policy is likely to advance the fuller political incorporation of immigrant communities going forward.
Acknowledgements
We thank Jennifer Hochschild, Dan Hopkins, Patrick Joyce, Karthick Ramakrishnan, Maya Sen, and anonymous reviewers for their helpful comments and advice, though the authors alone are responsible for any errors. Earlier versions of this project were presented at the 2010 and 2014 American Political Science Association Annual Meetings in Washington, DC.
APPENDIX
Robustness of RD Results
The results outlined in Tables 2 and 3 of the main text suggest that the VRA language provisions may induce a substantial increase in Latino voter registration and Asian American voter turnout. Though these results fit with past findings and our own hypotheses, we may be concerned that the identified effects are a product of the sample of cases we decided to examine. Would our results change if we looked at a different set of cases? In the RD literature, such a concern is conceptualized as robustness to the bandwidth selected by the researcher (Imbens and Kalyanaraman Reference Imbens and Kalyanaraman2012; Calonico, Cattaneo and Titiunik Reference Calonico, Cattaneo and Titiunik2014a ). Recall that the above estimates were calculated using a 2.5 percentage point bandwidth for the percentage trigger and a 5,000 citizen bandwidth for the population trigger. Would we find similar results when modifying the bandwidth to include a substantially larger or smaller subset of jurisdictions in the analysis?
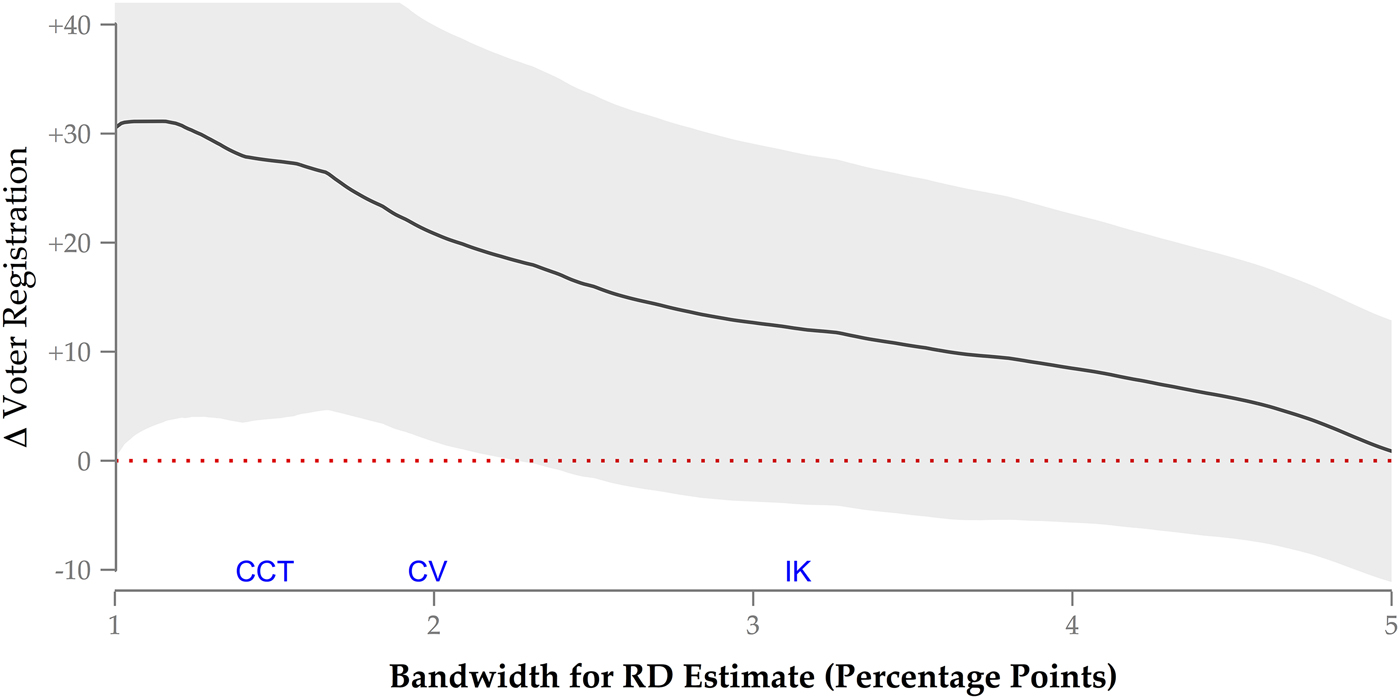
Figures 3 and 4 display the LATE calculated via RD analyses using various bandwidths. Starting with Figure 3, which analyzes changes in the rate of voter registration for Latino citizens,Footnote 30 we see that varying the bandwidth from 1 to 5 percentage points does induce some change in the estimated mean LATE. As the bandwidth increases, which indicates that more jurisdictions are used when calculating the treatment effect, the estimated effect size decreases on average, but it continues to be positive and is statistically significant at the 95% level at bandwidths below approximately 2.25 percentage points.Footnote 31 Using the cross-validation (CV) bandwidth selection criteria outlined in Ludwig and Miller (Reference Ludwig and Miller2007), the “optimal” bandwidth to estimate a LATE in this instance is approximately 2 percentage points, which (as denoted in Figure 3) would produce a substantially larger, significant impact of the language provisions on Latino voter registration than those found in Table 2 of the main text. The bandwidth selection criterion discussed by Calonico, Cattaneo and Titiunik (Reference Calonico, Cattaneo and Titiunik2014a ), labeled CCT in Figure 3, produces a similar result, while the Imbens–Kalyanaraman (IK) method indicates a slightly reduced LATE from that reported above.
RD Estimate by Bandwith, Latino Voter Registration. Note: Solid line indicates estimated local average treatment effect (LATE), drawn from a kernel regression estimated on both sides of the discontinuity, with the bandwidth indicated on the x-axis. A 2 percentage point bandwidth indicates that jurisdictions with a Latino limited English proficient citizen voting-age population from 3%–7% are included when computing the LATE. Cross-validation (CV), Imbens–Kalyanaraman (IK), and CCT bandwidths were calculated using software provided in Dimmery (Reference Dimmery2013) and Calonico, Cattaneo and Titiunik (Reference Calonico, Cattaneo and Titiunik2014b ). 95% confidence interval for the LATE is indicated in gray.

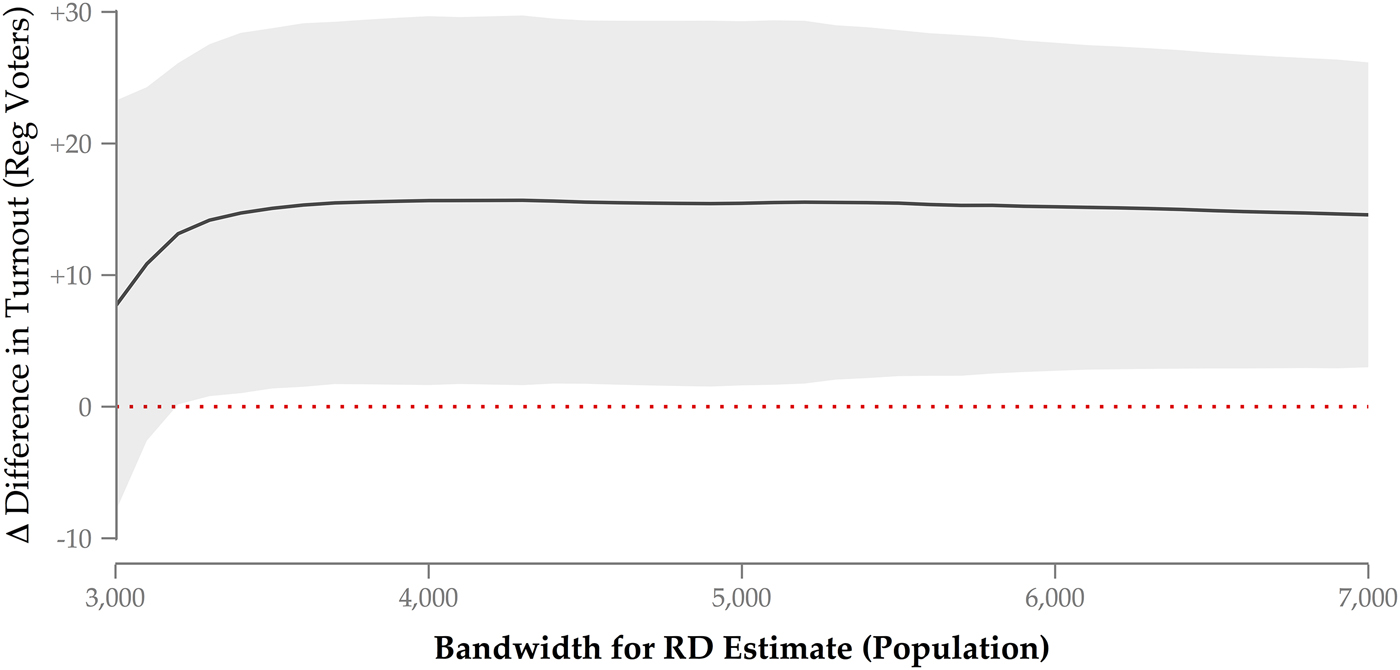
RD Estimate by Bandwith, Relative Turnout for Asian American Registrants. Note: Solid line indicates estimated local average treatment effect (LATE), drawn from a kernel regression estimated on both sides of the discontinuity, with the bandwidth indicated on the x-axis. A 4,000 citizen bandwidth indicates that jurisdictions with an Asian language group limited English proficient citizen voting-age population from 6,000–14,000 are included when computing the LATE. Optimal bandwidths calculated using the cross-validation (CV), Imbens–Kalyanaraman (IK), and/or CCT methods could not be calculated due to the small number of jurisdictions near the discontinuity. 95% confidence interval for the LATE is indicated in gray.

Turning now to rates of participation for Asian language minority citizens, Figure 4 provides further evidence that Asian American registered voters are more likely to turn out when their language group is covered under the VRA. When varying the population trigger based bandwidth from 3,000 to 7,000, we see a consistent, positive, and robust LATE of the language provisions on relative turnout of Asian American registered voters. Though clearly indicating room for further refinement of the precise effect of the VRA language provisions on participation for Latinos and Asian Americans, the direction (and under conventional conditions, magnitude) of the findings emphasized in the main text are confirmed even when expanding or contracting the range of cases examined via the RD framework.
Jurisdictions Assigned to Coverage “At Random”
As acknowledged in the main text, the Census Bureau notes substantial estimation error when measuring the size of the language minority population within a jurisdiction (Joyce et al. Reference Joyce, Malec, Little, Gilary, Navarro and Asiala2014). Table 5 lists the 42 jurisdictions where the 90% confidence interval for percent VACLEP or the VACLEP population crossed the coverage threshold of 5% or 10,000, respectively. In these areas, there is a substantial chance that repeated measurement of the size of the language minority population would result in a change in coverage assignment. While not truly random, as in expectation the reported coverage assignment is correct, we may assert that many factors that go into the construction of the ACS figures could be responsible for coverage assignment. Table 4 of the main text analyzes these 42 jurisdictions.
Jurisdictions assigned to coverage “at Random”

Effect of Coverage on Voter Turnout among Citizens
The main text focuses on changes in rates of voter registration among citizens and voter turnout among registrants. However, turnout is quite high for the registered voting population (Erikson Reference Erikson1981), and thus the measure of turnout featured in the main text does not capture the “combined” impact of the language provisions on participation for eligible adults. Below we examine turnout among citizens, using the same methodology featured in the main text.
Table 6 finds a substantial, positive LATE for relative voter turnout among citizens near the discontinuity. Similar to the results for turnout among registrants, we again see a very large, 37 point increase in turnout for covered Asian language citizens, relative to others in the jurisdiction. However, coverage appears to have a negative impact on the raw turnout rate for Asian language groups when examining the population trigger in Table 6. Relative turnout rates are higher on average, but results are still inconclusive even with the larger number of cases near the population threshold. Mixed findings also appear for Latinos, though nowhere near as large in magnitude.
Impact of coverage on voter turnout among citizens

Shifting to cases covered “at random,” we see some evidence that turnout as share of the eligible population increases for Latinos. However, the high variance in differences across treatment conditions indicates that such a finding is far from conclusive. No evidence emerges for increased Asian American voter turnout for “randomly” covered jurisdictions, and again directionality shifts depending on use of the raw rate of voter turnout versus the rate relative to others in the same county or municipality.