The target article by Bentley et al. makes an important contribution by providing a framework for categorizing different types of collective behavior. As more and more “big data” on human behavior are employed in research, these types of maps will become increasingly helpful in contextualizing old and new forms of collective behavior. The map Bentley et al. provide is based on discrete-choice approaches to decision-making, which naturally yields the east–west and north–south dimensions. Here, we make the case for an additional dimension that, based on our own work, would likely be informative in bridging microscopic behaviors and collective outcomes. This extra dimension is the network structure, or topology, on which social processes and behaviors occur.
Bentley et al. discuss the possibility of exploring the effects of other dimensions on decision-making towards the end of their article. Network structure, also mentioned by Bentley et al., has a key role in how dynamic processes unfold on social networks. For example, social influence, which by definition cannot exist in the absence of others, is particularly sensitive to the structural features of the social network in which the individuals are embedded. The effect on outcome can be dramatic. For example, Centola (Reference Centola2010) demonstrated empirically that the adoption rate of an online service is significantly increased for subjects whose social networks are highly clustered.
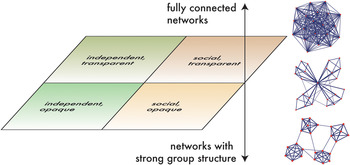
If there were an additional, (potentially) orthogonal network dimension to the north and southeast quadrants of Bentley et al.’s map, what might the extreme points of the axis represent? There are many possibilities, ranging from networks with narrow to broad connectivity distributions and from highly clustered to unclustered networks. However, for decision-making processes where social influence plays a role (Onnela & Reed-Tsochas Reference Onnela and Reed-Tsochas2010), we argue that the key feature is social group structure that limits the number of options available for social learning. We propose a network dimension (see our Figure 1), where in one extreme the network has multiple cohesive, fully connected social groups, but the groups themselves are linked by only a very small number of ties. In this case, social influence mainly originates from within each group. In the other extreme, we have fully connected networks where everyone is connected to everyone else, either directly or indirectly, such that each individual is able to observe everyone else's choices (e.g., Wikipedia). In between, we have networks that retain some group structure, but where highly connected hub nodes are able to influence members in several groups (e.g., Twitter).
Figure 1.
A proposed network dimension, relevant to the northeast and southeast quadrants. At one extreme are networks with very strong social group structure, limiting access to choices for social learning, and at the other extreme are networks where everyone is connected to everyone else.
As an example, consider the part of this augmented map with strong social group structure and purely social learning (“I'll have what she is having”) where each individual imitates a random network neighbor. This is the same mechanism as in the voter model of statistical physics (Castellano et al. Reference Castellano, Fortunato and Loreto2009). In this example, depending on the details of the decision-making process, the collective outcome may or may not depend on network structure. If the individuals update their choices perpetually as above, the model leads to a consensus where, regardless of network structure, a single choice prevails. However, if the individuals choose only once and stick to their choice, the distribution of the final popularity of choices heavily depends on network structure (Fortunato & Castellano Reference Fortunato and Castellano2007). Even with repeated choice updating, if an undecided state is added to the model, strong social group structure gives rise to long-lasting metastable states with each group sticking to its own choice (Toivonen et al. Reference Toivonen, Castelló, Eguíluz, Saramäki, Kaski and San Miguel2009). If each individual were to always pick the majority choice in its network neighborhood, each group would converge to its own choice, largely unaffected by those of other groups.
Consider now the other extreme of the network dimension, that is, a fully connected network where each individual sees the choices of all others. Here, blind imitation by copying the choice of a randomly chosen individual is equivalent to picking a decision with probability proportional to its popularity in the population. Thus, the mechanisms attributed to southeast (blind imitation) and northeast (choosing on the basis of popularity) are the same. This is preferential attachment, yielding a lognormal popularity distribution if the adoption probabilities are subject to random fluctuations, as Bentley et al. state. However, in the absence of such fluctuations, the resulting popularity distribution is a power law (Barabási & Albert Reference Barabási and Albert1999). Indeed, the profile of the popularity distribution of Wikipedia pages is consistent with a power law, not with a lognormal distribution (Ratkiewicz et al. Reference Ratkiewicz, Fortunato, Flammini, Menczer and Vespignani2010).
We would also like to argue that the distinction between the northeast and southeast quadrants (transparent vs. opaque payoffs) may at times be difficult as the payoffs may be socially generated – unrelated to intrinsic qualities of the options, but instead a product of how social influence is mediated through the network. Watts (Reference Watts2011) points out how the success of hits in different sectors of human activity, such as art (Mona Lisa), literature (the Harry Potter series), and technology (the iPod) caught experts by surprise. For example, eight publishers rejected the first Harry Potter manuscript. Experiments by Salganik and colleagues (Salganik et al. Reference Salganik, Dodds and Watts2006) showed that the same set of songs were ranked differently by comparable groups of subjects depending on the extent to which they were exposed to the decisions of others. The difference between a smash hit and failure may then be due to social cascades arising from initial random fluctuations, giving the incipient winner a decisive early advantage over its competitors (Fig. 1).





The target article by Bentley et al. makes an important contribution by providing a framework for categorizing different types of collective behavior. As more and more “big data” on human behavior are employed in research, these types of maps will become increasingly helpful in contextualizing old and new forms of collective behavior. The map Bentley et al. provide is based on discrete-choice approaches to decision-making, which naturally yields the east–west and north–south dimensions. Here, we make the case for an additional dimension that, based on our own work, would likely be informative in bridging microscopic behaviors and collective outcomes. This extra dimension is the network structure, or topology, on which social processes and behaviors occur.
Bentley et al. discuss the possibility of exploring the effects of other dimensions on decision-making towards the end of their article. Network structure, also mentioned by Bentley et al., has a key role in how dynamic processes unfold on social networks. For example, social influence, which by definition cannot exist in the absence of others, is particularly sensitive to the structural features of the social network in which the individuals are embedded. The effect on outcome can be dramatic. For example, Centola (Reference Centola2010) demonstrated empirically that the adoption rate of an online service is significantly increased for subjects whose social networks are highly clustered.
If there were an additional, (potentially) orthogonal network dimension to the north and southeast quadrants of Bentley et al.’s map, what might the extreme points of the axis represent? There are many possibilities, ranging from networks with narrow to broad connectivity distributions and from highly clustered to unclustered networks. However, for decision-making processes where social influence plays a role (Onnela & Reed-Tsochas Reference Onnela and Reed-Tsochas2010), we argue that the key feature is social group structure that limits the number of options available for social learning. We propose a network dimension (see our Figure 1), where in one extreme the network has multiple cohesive, fully connected social groups, but the groups themselves are linked by only a very small number of ties. In this case, social influence mainly originates from within each group. In the other extreme, we have fully connected networks where everyone is connected to everyone else, either directly or indirectly, such that each individual is able to observe everyone else's choices (e.g., Wikipedia). In between, we have networks that retain some group structure, but where highly connected hub nodes are able to influence members in several groups (e.g., Twitter).
A proposed network dimension, relevant to the northeast and southeast quadrants. At one extreme are networks with very strong social group structure, limiting access to choices for social learning, and at the other extreme are networks where everyone is connected to everyone else.
As an example, consider the part of this augmented map with strong social group structure and purely social learning (“I'll have what she is having”) where each individual imitates a random network neighbor. This is the same mechanism as in the voter model of statistical physics (Castellano et al. Reference Castellano, Fortunato and Loreto2009). In this example, depending on the details of the decision-making process, the collective outcome may or may not depend on network structure. If the individuals update their choices perpetually as above, the model leads to a consensus where, regardless of network structure, a single choice prevails. However, if the individuals choose only once and stick to their choice, the distribution of the final popularity of choices heavily depends on network structure (Fortunato & Castellano Reference Fortunato and Castellano2007). Even with repeated choice updating, if an undecided state is added to the model, strong social group structure gives rise to long-lasting metastable states with each group sticking to its own choice (Toivonen et al. Reference Toivonen, Castelló, Eguíluz, Saramäki, Kaski and San Miguel2009). If each individual were to always pick the majority choice in its network neighborhood, each group would converge to its own choice, largely unaffected by those of other groups.
Consider now the other extreme of the network dimension, that is, a fully connected network where each individual sees the choices of all others. Here, blind imitation by copying the choice of a randomly chosen individual is equivalent to picking a decision with probability proportional to its popularity in the population. Thus, the mechanisms attributed to southeast (blind imitation) and northeast (choosing on the basis of popularity) are the same. This is preferential attachment, yielding a lognormal popularity distribution if the adoption probabilities are subject to random fluctuations, as Bentley et al. state. However, in the absence of such fluctuations, the resulting popularity distribution is a power law (Barabási & Albert Reference Barabási and Albert1999). Indeed, the profile of the popularity distribution of Wikipedia pages is consistent with a power law, not with a lognormal distribution (Ratkiewicz et al. Reference Ratkiewicz, Fortunato, Flammini, Menczer and Vespignani2010).
We would also like to argue that the distinction between the northeast and southeast quadrants (transparent vs. opaque payoffs) may at times be difficult as the payoffs may be socially generated – unrelated to intrinsic qualities of the options, but instead a product of how social influence is mediated through the network. Watts (Reference Watts2011) points out how the success of hits in different sectors of human activity, such as art (Mona Lisa), literature (the Harry Potter series), and technology (the iPod) caught experts by surprise. For example, eight publishers rejected the first Harry Potter manuscript. Experiments by Salganik and colleagues (Salganik et al. Reference Salganik, Dodds and Watts2006) showed that the same set of songs were ranked differently by comparable groups of subjects depending on the extent to which they were exposed to the decisions of others. The difference between a smash hit and failure may then be due to social cascades arising from initial random fluctuations, giving the incipient winner a decisive early advantage over its competitors (Fig. 1).