Camel milk has attracted increasing scientific and commercial interest due to its unique composition, functional properties and potential health benefits (El-Sayed and El-Agamy, Reference El-Sayed, El-Agamy, Park and Haenlein2006; Konuspayeva et al., Reference Konuspayeva, Faye and Loiseau2009; Kumar et al., Reference Kumar, Verma, Chatli, Raghvendar Singh, Pavan Kumar, Nitin Mehta and Malav2016; Seifu, Reference Seifu2022; Kaskous, Reference Kaskous2016; Al-Ahmari et al., Reference Seifu2025). However, several physicochemical characteristics, including the freezing point (FP), remain insufficiently documented compared with cow milk. With expanding international trade, the risk of fraud has become more relevant, especially because camel milk is considerably more expensive than milk from other species. Two major forms of adulteration are commonly reported: mixing with other milks and dilution with water (Ait El Alia et al., Reference Ait El Alia, Zine-Eddine, Chaji, Boukrouh, Boutoial and Faye2025; Faye et al., Reference Faye, Konuspayeva, Kiselev and Nagy2025).
Cryoscopy is the internationally recognized reference method for detecting added water in cow milk, with FP values typically ranging from −0.52°C to −0.56°C (Henno et al., Reference Henno, Ots, Jõudu, Kaart and Kärt2008). In ewe and mare milk, FP ranges are reported at approximately −0.61°C (Janštová et al., Reference Janštová, Navrátilová, Králová and Vorlová2013) and −0.55°C (Cais-Sokolińska et al., Reference Cais-Sokolińska, Danków, Bierzuńska, Kaczyński, Chudy, Teichert and Pikul2018), respectively. Existing data on camel milk suggest a FP range of −0.53°C to −0.57°C (Konuspayeva et al., Reference Konuspayeva, Al-Gedan, Alzuraiq and Faye2023), but most cryoscopies are calibrated for bovine milk, which may lead to inaccuracies. The detection of low-level water adulteration is limited by the natural variability of milk FP and the low sensitivity of cryoscopic measurements at small dilution levels. Also, FP has a strong positive correlation with density, fat, solids, non-fat (SNF), lactose, ash and protein (Faye et al., Reference Faye, Konuspayeva, Messad and Loiseau2008). Establishing species-specific FP reference values and determining FP behaviour in adulterated camel milk are therefore essential.
The present study aims to determine well-defined reference FP values for dromedary and Bactrian camel milk and to evaluate the detectability of water dilution up to 30%. Additionally, relationships between FP and the components of non-adulterated raw milk were investigated.
Materials and methods
A total of 38 raw camel milk samples were collected from different stages of lactating Bactrian (n = 24) and dromedary (n = 14) healthy camels from the Turkestan and Atyrau regions of Kazakhstan (4–12 years old). Animals were milked by hand during the usual milking time. All analyses were carried out within 20–36 hours at −4°C, after milking to minimize changes in physicochemical properties. Each milk sample was analysed as raw milk (0%), then after adding 10%, 20% and 30% water.
For analysis, 2–3 mL of milk was transferred from each sample into cryoscopy-specific glass tubes. FP was assessed using a Funke Gerber CryoStar-I™ cryoscopy (Berlin, Germany) operating according to ISO 5764:2009. Measurements were fully automated, and FP values were recorded in °C. Each sample was analysed in duplicate, and mean values were used (accuracy ± 0.001°C). Basic milk parameters (pH, fat, protein, somatic cell count) were determined using standard commercial analysers (Ohaus pH meter; Lactan and Somatos Mini analysers). These measurements served as additional information to FP and to confirm the normality of raw milk in terms of gross composition. In total, 152 FP values (38 raw milk + 38 samples × 3 levels of added water) were recorded. Descriptive statistics (mean, SD, CV) were used to evaluate FP values. One-way ANOVA tested differences in FP, fat, protein, pH and somatic cell count between species and between water-dilution levels. Linear regression was applied globally and separately for both species to describe FP variation with water addition (y = ax + b). Pearson correlations examined relationships between FP and physicochemical variables. Based on the distribution of FP values, an additional analysis was performed by using four FP classes (<−0.58; −0.58 to <−0.60; −0.60 to <−0.65; and >−0.65°C). The milk parameters of raw milk (fat, protein, pH and SCC) were compared by ANOVA between those classes corresponding to low, low-medium, high-medium and high FP values. Finally, to detect the risks of confusion between undiluted milk and fraud based on low dilution (10%), a discriminant factorial analysis was applied to part of the data (FP of raw milk and diluted to 10%) for each species, the objective being to quantify the percentage of samples correctly classified in each of the categories (raw or diluted milk). Analyses were performed using XLStat (©Addinsoft, 2025).
Results and discussion
The main components (fat and protein) in raw milk were in the normal range for the two species, with significantly higher concentrations in Bactrian milk (Table 1). In contrast, there was no significant difference for pH and SCC, indicating a similar level of hygienic quality in both species.
Mean values of milk components, pH and SCC in the two species

Table 1 Long description
The table reports mean milk protein, fat, pH, and somatic cell count for Bactrian and dromedary camels, with variability shown alongside each mean. Bactrian milk averages 3.88 protein and 5.80 fat, compared with 3.13 protein and 3.88 fat in dromedary milk. The pH values are close, at 6.39 for Bactrian and 6.31 for dromedary. Somatic cell count is 203.06 for Bactrian and 319.84 for dromedary, with much larger variability in the dromedary value. The reported significance testing indicates species differences for protein and fat, but not for pH or somatic cell count. Letter groupings next to means indicate which species differ within a column, and results should be interpreted with the reported variability in mind.
a ,bDifferent subscripts in column are significant at p < 0.05.
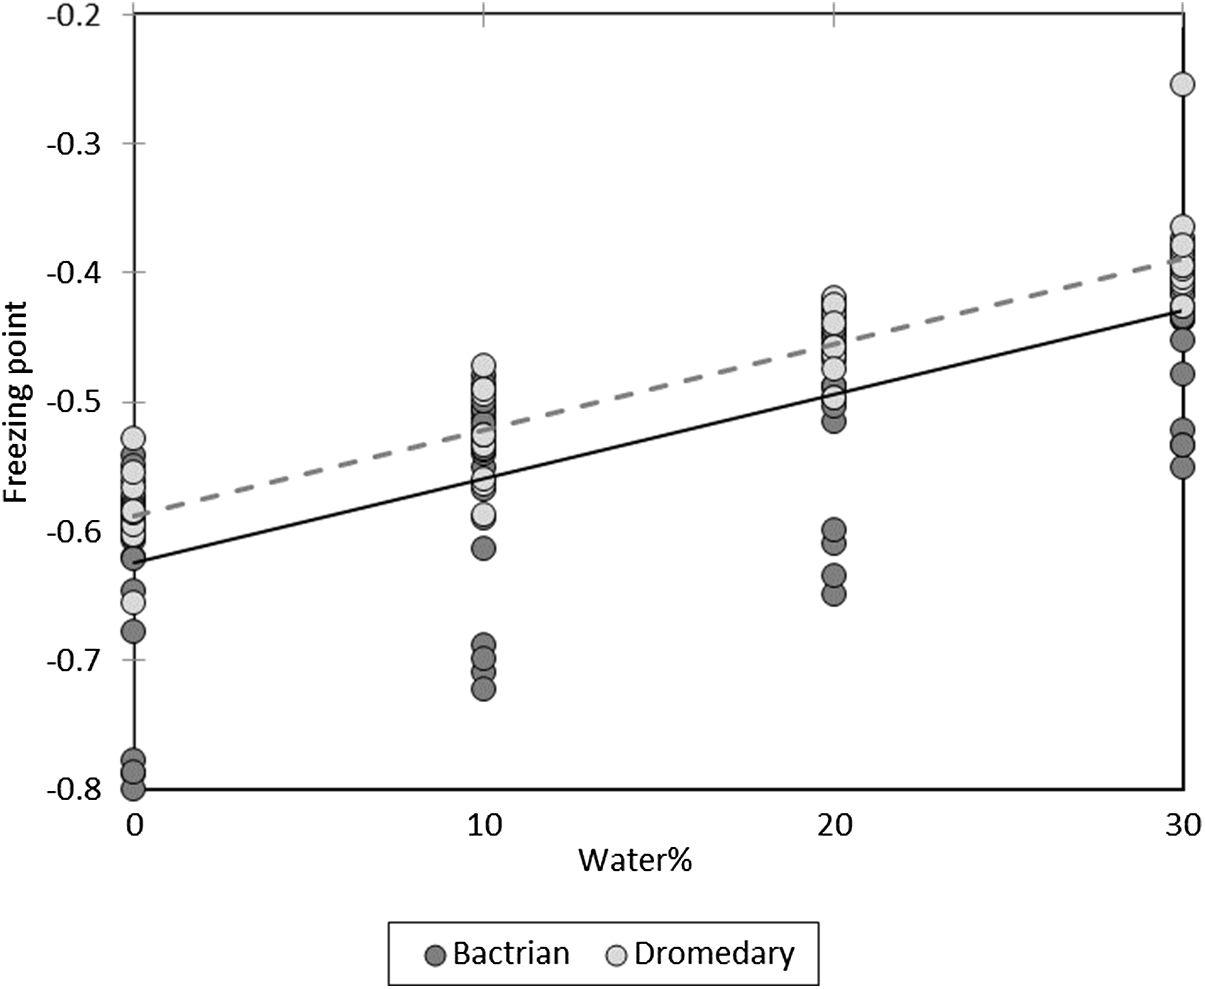
For pure Bactrian camel milk, FP ranged from −0.542°C to −0.799°C (mean −0.627°C). With 10%, 20% and 30% water, FP increased to −0.557°C, −0.487°C and −0.435°C, respectively. In dromedary camel milk, pure samples ranged from −0.527°C to −0.655°C (mean −0.586°C), increasing to −0.526°C, −0.456°C and −0.388°C with the same dilution levels. In both species, FP rose significantly with added water (p < 0.0001). The values for raw milk without adulteration are comparable to the values reported in the literature, both in dromedaries from Saudi Arabia (Konuspayeva et al., Reference Konuspayeva, Al-Gedan, Alzuraiq and Faye2023), India (Faye et al., Reference Faye, Konuspayeva, Messad and Loiseau2008), Sudan (Yoganandi et al., Reference Yoganandi, Mehta, Wadhwani, Darji and Aparnathi2014), Kenya (Elobied et al., Reference Elobied, Osman, Kashwa, Ali, Ibrahim and Salih2015), Iraq (Wangoh et al., Reference Wangoh, Farah and Puhan1998), Turkey (Al Salihi et al., Reference Al Salihi, Al Khatib and Alkoofee2017) and Algeria (Zahra et al., Reference Zahra, Ismail and Wahiba2021) and in Bactrian camels (Xiao et al., Reference Xiao, Yi, Ming, He and Ji2022). Based on the above-cited studies, the FP of raw camel milk has been reported to range from −0.485°C to −0.621°C (Konuspayeva et al., Reference Konuspayeva, Al-Gedan, Alzuraiq and Faye2023; Faye et al., Reference Faye, Konuspayeva, Messad and Loiseau2008; Yoganandi et al., Reference Yoganandi, Mehta, Wadhwani, Darji and Aparnathi2014; Elobied et al., Reference Elobied, Osman, Kashwa, Ali, Ibrahim and Salih2015; Wangoh et al., Reference Wangoh, Farah and Puhan1998; Al Salihi et al., Reference Al Salihi, Al Khatib and Alkoofee2017; Zahra et al., Reference Zahra, Ismail and Wahiba2021) in dromedary camels and from −0.52°C to −0.73°C in Bactrian camels (Xiao et al., Reference Xiao, Yi, Ming, He and Ji2022).
The FP increase confirmed cryoscopy’s sensitivity to water dilution: mean rises of 10.3%, 22.1% and 33.8% in dromedaries and 11.2%, 22.3% and 30.7% in Bactrian camels. Pure Bactrian camel milk showed a 7% lower FP than dromedary milk. Such a difference reflects higher solids and fat content in Bactrian milk (Table 1). FP variability was also greater in Bactrian camel milk (CV = 0.122% vs. 0.048%). Species-related differences in FP were not significant in raw milk and at 10% and 20% water dilution but became significant at 30% dilution (p < 0.01). For all samples, the regression equation was FP (°C) = 0.0065 × water (%) − 0.6106, with minor species-specific differences (Figure 1).
Comparative increase of FP in Bactrian and dromedary camel milk according to the percentage of added water.

Figure 1 Long description
A scatter plot with error bars and two marker types. The horizontal axis label is percent water in milk. The horizontal axis shows 0, 5, 10, 15, 20, 25, 30, 35. The vertical axis label is Freezing point (C). The vertical axis shows negative 0.30, negative 0.35, negative 0.40, negative 0.45, negative 0.50, negative 0.55, negative 0.60, negative 0.65, negative 0.70, negative 0.75. A legend below the plot shows Drom and Bact. Drom uses a filled circle marker. Bact uses an open circle marker. At percent water in milk 0, Drom is plotted near negative 0.60 and Bact is plotted near negative 0.63. At percent water in milk 10, Drom is plotted near negative 0.52 and Bact is plotted near negative 0.56. At percent water in milk 20, Drom is plotted near negative 0.45 and Bact is plotted near negative 0.49. At percent water in milk 30, Drom is plotted near negative 0.39 and Bact is plotted near negative 0.44. Each plotted point has a vertical error bar. The error bars extend above and below each marker by varying amounts across the four percent water in milk positions.
Relationships of raw milk components and FP
The FP showed weak overall correlations with protein (r = −0.344; p < 0.05) and pH (r = −0.399; p < 0.05), but these relationships disappeared when species were analysed separately. In dromedary milk, FP remained strongly correlated with pH (r = −0.704; p < 0.01) and positively associated with fat (r = 0.555; p < 0.05), while no significant correlations were found in Bactrian samples. Data on lactose and minerals – usually major determinants of FP in camel milk (Konuspayeva et al., Reference Konuspayeva, Al-Gedan, Alzuraiq and Faye2023), in cow (Costa et al., Reference Costa, Visentin, De Marchi, Cassandro and Penasa2019) and mare milk (Martuzzi et al., Reference Martuzzi, Summer, Formaggioni and Mariani2004) – were not available. SCC had no detectable effect on FP. Despite generally normal pH values (6.36 ± 0.22), FP decreased as pH increased, which was confirmed by FP classes (Table 2), where only pH differed significantly among groups.
Mean physical-chemical values in the different FP levels in camel milk samples

Table 2 Long description
The table reports mean protein, fat, pH, and somatic cell count for camel milk grouped into four freezing point levels defined by freezing point ranges. Protein varies from 3.4 to 4.1, with the highest mean protein in the lowest freezing point group and the lowest means in the middle groups. Fat ranges from 4.8 to 5.7, with the lowest mean fat in the third freezing point group and the highest in the lowest freezing point group. pH increases across groups from about 6.3 in the first two groups to 6.4 in the third and 6.5 in the lowest freezing point group, and this is the only measure with a statistically significant difference across groups. Somatic cell count ranges from 191.5 to 274.5, with the lowest mean in the third group and the highest mean in the second group, but differences are not statistically significant. P values indicate no significant group differences for protein, fat, or somatic cell count, so apparent changes in those measures should be interpreted cautiously.
a,b Different superscripts in the same column are significantly different at p < 0.05.
The results of the discriminant analysis showed that the FP values allow for the formal detection of water dilution fraud in 81.3% of the Bactrian milk samples and 87.5% of the dromedary milk samples, those values corresponding to the well-classed diluted samples. However, because of the higher variability of FP in Bactrian samples, only 50% of the raw Bactrian milk was well-classed in the category non-diluted milk vs. 90% for dromedary milk samples. In short, 18.7% of the diluted Bactrian milk samples and 12.5% of the diluted dromedary milk samples were not detected by their FP.
Conclusion
Contrary to most of the references available in the literature regarding FP in camel milk, our study was based on the reference method to determine this parameter in pure milk and milk adulterated by the addition of water. Globally, even with 10% of water, the FP value decreased significantly. However, the natural variability of the FP in relationships to the milk composition could lead to an inability to detect fraud (dilution) in some samples if the dilution did not exceed 10% (Figure 2).
Linear regressions and equations of regression between FP (in °C) and the percentage of water in camel milk.

Figure 2 Long description
The horizontal axis label is Water percent, with tick labels at 0, 10, 20 and 30. The vertical axis label is Freezing point, with tick labels at negative 0.8, negative 0.7, negative 0.6, negative 0.5, negative 0.4, negative 0.3 and negative 0.2. A legend below the plot lists Bactrian and Dromedary. Two fitted lines are drawn across the scatter: one solid line and one dashed line. Points are arranged in four vertical groups aligned with Water percent values near 0, 10, 20 and 30. The fitted lines slope upward from left to right. The plotted points span from about negative 0.8 up to about negative 0.25 on the Freezing point axis. The densest concentration of points appears between about negative 0.75 and negative 0.5, with additional points between about negative 0.5 and negative 0.35. A point near Water percent 30 lies close to negative 0.25.
Funding statement
The research was carried out under the Program-targeted financing of the Ministry of Agriculture of the Republic of Kazakhstan for 2024–2026, ‘BR22886598 Development of innovative methods of increasing genetic potential of camels of Kazakhstan populations, as well as application of effective technologies of production and processing of camel breeding products’.
Declaration of generative AI and AI-assisted technologies in the manuscript preparation process
During the preparation of this work, the author(s) used ChatGPT in order to synthesize complex literature, provide an overview of a field or research question and provide tailored support for tasks such as improving language and readability. After using this tool/service, the author(s) reviewed and edited the content as needed and take(s) full responsibility for the content of the published article.