

Introduction
As globalization progresses and food markets become increasingly diversified, understanding how consumers prioritize different food values has become a critical issue for both researchers and policy makers. In recent years, lifestyle changes, such as growing time constraints and the rise of dual-income households, have shifted dietary habits away from home cooking toward greater reliance on ready-to-eat (RTE) meals and dining out (Adams et al. Reference Adams, Goffe, Brown, Lake, Summerbell, White, Wrieden and Adamson2015; Gesteiro et al. Reference Gesteiro, García-Carro, Aparicio-Ugarriza and González-Gross2022; Zang et al. Reference Zang, Luo, Wang, Zhu, Wang, He, Wang, Guo, Chen, Wang, Guo, Zou, Jia and Wu2018). These changes in consumption patterns may also affect consumers’ decision-making structures and the relative priority they assign to different food-related values.
Prior research on the determinants of food choice has emphasized that consumers prioritize among multiple considerations, including taste, price, safety, nutrition, and convenience. The food values framework proposed by Lusk and Briggeman (Reference Lusk and Briggeman2009) is distinctive in that it seeks to capture relatively broad and general evaluative criteria that consumers apply to food in general, rather than preferences tied to specific product attributes or transient situational factors. While stated choices in experimental settings may vary depending on respondents’ momentary conditions or recent experiences, food values are often interpreted as reflecting more structural and stable evaluative orientations toward food.
The food values framework has been applied in a variety of contexts, including cross-country comparisons and analyses of changes before and after the COVID-19 pandemic (Bazzani et al. Reference Bazzani, Gustavsen, Nayga and Rickertsen2018; Cerroni et al. Reference Cerroni, Nayga, Pappalardo and Yang2022; Hempel and Roosen Reference Hempel and Roosen2024; Piracci et al. Reference Piracci, Casini, Contini, Stancu and Lähteenmäki2023; Sun et al. Reference Sun, Ortega and Lin2023). However, systematic empirical evidence remains limited regarding the extent to which the relative importance of food values is similar or different across distinct consumption contexts, particularly between RTE meals and dining out. Although both contexts involve out-of-home prepared foods, they differ in purchasing and consumption processes, price ranges, service components, and consumption motives (e.g., convenience-oriented versus experience-oriented) (Frash et al. Reference Frash, DiPietro and Smith2015; Greene et al. Reference Greene, Nguyen and Dolnicar2024; Lang and Lemmerer Reference Lang and Lemmerer2019). Therefore, examining how such contextual differences are reflected in consumers’ prioritization of food values is of clear academic interest.
In Japan, promoting the use of domestically produced agricultural products and improving food self-sufficiency remain important policy objectives, and consumer evaluations of origin and domestically produced ingredients are also of practical relevance. Existing studies have primarily focused on in-home consumption or specific product categories and have documented preferences for domestic products and the presence of so-called “domestic bias” (Bernard et al. Reference Bernard, Collange, Ingarao and Zarrouk-Karoui2020; Gineikiene et al. Reference Gineikiene, Schlegelmilch and Ruzevičiūtė2016; Loureiro and Umberger Reference Loureiro and Umberger2005). Similarly, evidence from Japan indicates domestic preferences for products such as rice, alcoholic beverages, seafood, and livestock products (Aoki et al. Reference Aoki, Akai and Ujiie2017; Kubota et al. Reference Kubota, Sawano and Kono2017; Onozaka et al. Reference Onozaka, Honkanen and Alitintzoglou2023; Washio et al. Reference Washio, Saijo, Ito, Takeda and Ohashi2023). By contrast, relatively little empirical evidence is available on how domestically produced ingredients are positioned relative to other food values – such as taste, price, safety, and nutrition – in the contexts of RTE meals and dining out.
The objective of this study is to descriptively examine the relative importance of food values among Japanese consumers in two consumption contexts – RTE meals and dining out – and to clarify the position of domestically produced ingredients within these broader value structures. Specifically, the study applies best–worst scaling (BWS) to elicit importance rankings for multiple food values, including taste, price, safety, nutrition, and convenience, and compares the resulting prioritization patterns across RTE meals and dining out. Additionally, heterogeneity in stated importance patterns is summarized using latent class analysis (LCA) applied to individual-level BWS scores to examine differences in value prioritization across consumer segments in both contexts.
This study targeted Japanese consumers for three main reasons. First, in Japan, the share of household food expenditure allocated to RTE meals and dining out has increased, making these contexts increasingly important for understanding contemporary food choice behavior (MAFF 2024). MAFF (2024) reports that RTE meals account for 13.8% and dining out for 20.6% of total household food expenditure in 2020 – together exceeding one-third of all food spending – and projects this share to rise to over 37% by 2040. Second, improving food self-sufficiency remains a key policy objective in Japan, and evidence on how consumers evaluate domestic ingredients can inform communication and marketing strategies (MAFF 2024). Third, although BWS-based research on food values has accumulated internationally (Bazzani et al. Reference Bazzani, Gustavsen, Nayga and Rickertsen2018; Lusk and Briggeman Reference Lusk and Briggeman2009), systematic evidence for Japan – particularly in RTE-meal and dining-out contexts – remains limited (Murakami et al. Reference Murakami, Nakatani, Ito, Abe, Kita and Nakashima2021; Sajiki and Lu Reference Sajiki and Lu2022; Yang et al. Reference Yang, Takashino and Fuyuki2022).
This paper offers three principal contributions. First, it provides new empirical evidence on the relative importance of domestically produced ingredients within a comprehensive food value framework in RTE meals and dining out. Second, by applying a unified BWS design to both RTE meals and dining out, the study offers one of the first systematic cross context descriptions of food value priorities in Japan using a consistent measurement approach, allowing a descriptive assessment of similarities and differences in the hierarchical structure of food values across consumption contexts. Third, by identifying latent consumer segments, the study offers evidence that can inform strategies aimed at encouraging the use of domestically produced ingredients.
The remainder of this paper is organized as follows: Section Literature review reviews the literature; Section Materials and methods describes the data, contextual framework, the BWS design, and analytical methods; Section Results presents the estimation results; Section Discussion discusses the findings; and Section Conclusions concludes.
Literature review
Food values as a framework for food choice
The food values framework conceptualizes food choice as involving prioritization among multiple competing considerations that reflect consumers’ broader evaluative criteria for food, rather than preferences for specific products or brands (Lusk and Briggeman Reference Lusk and Briggeman2009). Subsequent studies have applied this framework across countries and contexts, demonstrating that core food values – such as taste, price, safety, nutrition, and convenience – consistently play central roles in food choice, while the relative salience of other values may vary with social and market conditions (Bazzani et al. Reference Bazzani, Gustavsen, Nayga and Rickertsen2018; Murakami et al. Reference Murakami, Nakatani, Ito, Abe, Kita and Nakashima2021; Sajiki and Lu Reference Sajiki and Lu2022; Yang et al. Reference Yang, Takashino and Fuyuki2022).
Importantly, food values are often interpreted as relatively general and stable evaluative criteria compared with context-specific product attributes or short-term preferences. While stated choices in experiments may vary with situational factors or timing, food values provide a parsimonious lens for comparing the relative prioritization of underlying considerations across different consumption contexts. Nevertheless, systematic empirical evidence comparing food value prioritization across distinct out-of-home consumption contexts – such as RTE meals and dining out – remains limited.
RTE meals and dining out
RTE-meal and dining-out consumption encompasses diverse situations that differ in convenience, social environment, and consumer control over ingredient selection. In RTE-meal contexts, choices are influenced by factors such as appearance, packaging and hygiene, price, perceived quality and safety, preparation time, and brand image (Huseynli and Mammadova Reference Huseynli and Mammadova2022; Montero et al. Reference Montero, Garrido, Gallardo, Tang and Ross2021; Roy and Khatun Reference Roy and Khatun2024). In dining-out contexts, consumers prioritize food quality, service, price, location, and ambiance, while situational factors, such as dining occasion and social setting, also shape decision-making (Frash et al. Reference Frash, DiPietro and Smith2015; Galiñanes Plaza et al. Reference Galiñanes Plaza, Saulais and Delarue2022; Greene et al. Reference Greene, Nguyen and Dolnicar2024; Lang and Lemmerer Reference Lang and Lemmerer2019).
These findings suggest that the relative importance of food related considerations may vary across consumption contexts. However, most prior studies examine specific attributes or situational determinants in isolation, rather than positioning these considerations within a broader and comparable set of food values. This highlights the need for a unified framework that enables the systematic comparison of food value prioritization across RTE meals and dining out.
Positioning domestically produced ingredients within food values
A large body of literature documents that consumers often evaluate domestically produced foods more favorably than imported alternatives, a tendency commonly referred to as “domestic bias” (Bernard et al. Reference Bernard, Collange, Ingarao and Zarrouk-Karoui2020; Gineikiene et al. Reference Gineikiene, Schlegelmilch and Ruzevičiūtė2016; Loureiro and Umberger Reference Loureiro and Umberger2005). Most empirical evidence on domestic bias is derived from in-home consumption contexts or from analyses of specific product categories. Findings from Japan are broadly consistent with these patterns: consumers tend to prefer domestically produced rice and wine, and country-of-origin information interacts with perceptions of quality, safety, and sustainability (Aoki et al. Reference Aoki, Akai and Ujiie2017; Kubota et al. Reference Kubota, Sawano and Kono2017). Recent studies further demonstrate that origin and perceived quality influence choices for seafood and meat products (Onozaka et al. Reference Onozaka, Honkanen and Alitintzoglou2023; Raimondo et al. Reference Raimondo, Spina, D’Amico, di Vita, Califano and Caracciolo2024; Washio et al. Reference Washio, Saijo, Ito, Takeda and Ohashi2023).
Nevertheless, relatively little is known about how domestically produced ingredients are positioned relative to a broader set of food values – such as taste, price, safety, nutrition, and convenience – within RTE-meal and dining-out contexts.
Best-worst scaling for eliciting food value priorities
BWS has been widely adopted to measure the relative importance of such values because it reduces scale-use bias and elicits clear relative importance judgments (Finn and Louviere Reference Finn and Louviere1992; Louviere et al. Reference Louviere, Flynn and Marley2015). BWS is particularly well suited to the food values framework, as it directly elicits comparative judgments among abstract evaluative criteria rather than product-specific attributes. BWS applications have expanded internationally, providing transparent and comparable rankings of food values across populations (Bazzani et al. Reference Bazzani, Gustavsen, Nayga and Rickertsen2018; Murakami et al. Reference Murakami, Nakatani, Ito, Abe, Kita and Nakashima2021).
Despite this growing literature, evidence focusing on Japanese consumers – particularly in out-of-home consumption contexts, such as RTE meals and dining out – remains limited (Sajiki and Lu Reference Sajiki and Lu2022; Yang et al. Reference Yang, Takashino and Fuyuki2022). Accordingly, BWS provides a parsimonious and transparent approach to positioning domestically produced ingredients within consumers’ broader food value priorities in contemporary Japanese RTE-meal and dining-out markets.
Research gaps and positioning of the present study
Three key gaps emerge from the literature. First, while food values have been examined across countries and social conditions, systematic comparisons of food value prioritization across distinct out-of-home consumption contexts remain scarce. Second, most studies on domestic bias and country-of-origin effects focus on in-home consumption or specific product categories, leaving the positioning of domestically produced ingredients within a comprehensive set of competing food values underexplored in RTE-meal and dining-out contexts. Third, to the best of our knowledge, no study has applied a unified BWS design to compare food value prioritization across RTE meals and dining out in Japan using a consistent measurement framework.
Addressing these gaps, the present study applies BWS to examine the relative importance of food values in RTE-meal and dining-out contexts and to clarify the position of domestically produced ingredients within this broader value structure. Further, it uses LCA to explore heterogeneity in stated importance patterns across consumers.
Materials and methods
Experimental design
This section describes the BWS implementation and the selection of food values used to elicit stated importance rankings in the contexts of RTE meals and dining out. Following the food values framework proposed by Lusk and Briggeman (Reference Lusk and Briggeman2009) and subsequent applications (Bazzani et al. Reference Bazzani, Gustavsen, Nayga and Rickertsen2018), BWS was employed to elicit relative importance judgments among general evaluative criteria for food choice rather than product-specific attributes. Respondents were repeatedly asked to select the “most” and “least” important food values from a set of options.
A key motivation for using BWS is that it provides a parsimonious and cognitively simple way to reveal relative importance ranking. BWS is particularly useful for identifying which food values are perceived as most and least important across multiple dimensions (Lusk and Briggeman Reference Lusk and Briggeman2009). Compared with traditional rating scales, BWS avoids scale-use bias by relying on relative judgments. Unlike conjoint analysis, which evaluates tradeoffs among attributes within product profiles (Lancsar and Louviere Reference Lancsar and Louviere2008), BWS is well suited to ranking general values without tying them to specific product combinations (Krucien et al. Reference Krucien, Watson and Ryan2017; Lancsar and Louviere Reference Lancsar and Louviere2008). Importantly, BWS imposes relatively low cognitive burden because respondents identify only the most and least important items in each task, making it one of the simplest stated preference approaches for eliciting value rankings (Erdem et al. Reference Erdem, Rigby and Wossink2012; Marley and Louviere Reference Marley and Louviere2005).
For these reasons, BWS has been widely applied in marketing, psychology, and food research for capturing consumers’ food value perceptions and priorities (Bazzani et al. Reference Bazzani, Gustavsen, Nayga and Rickertsen2018; Giuggioli et al. Reference Giuggioli, Merlino, Sparacino, Peano, Borra and Massaglia2023; Török et al. Reference Török, Yeh, Menozzi, Balogh and Czine2023; Wu et al. Reference Wu, Yuan, Wang and Jin2024). However, its application to Japanese consumers in RTE-meal and dining-out contexts remains limited (Murakami et al. Reference Murakami, Nakatani, Ito, Abe, Kita and Nakashima2021; Sajiki and Lu Reference Sajiki and Lu2022; Yang et al. Reference Yang, Takashino and Fuyuki2022). Accordingly, this study applies BWS to analyze food value preferences between RTE meals and dining out in Japan.
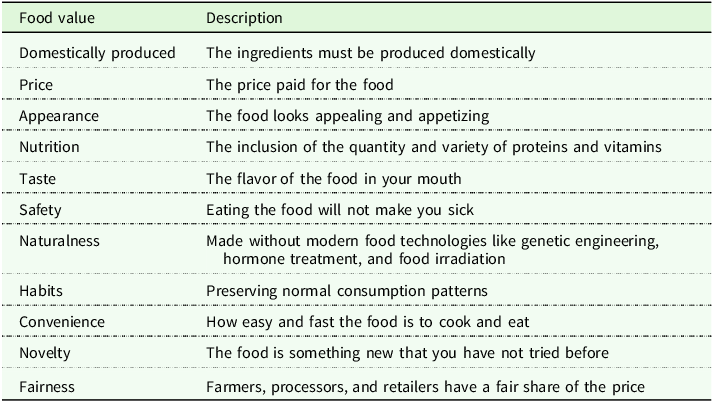
The concept of food values was adopted as defined by Bazzani et al. (Reference Bazzani, Gustavsen, Nayga and Rickertsen2018) and Lusk and Briggeman (Reference Lusk and Briggeman2009). These values are generalizable across food types and not tied to specific product contexts. In this study, 11 food values were used: domestically produced, price, appearance, nutrition, taste, safety, naturalness, habits, convenience, novelty, and fairness (Table 1).
Food values and description

Table 1. Long description
A table titled ‘Food values and description’ with two columns: Food value and Description. The table has 11 rows, each listing a different food value and its corresponding description. Row 1: Domestically produced, The ingredients must be produced domestically. Row 2: Price, The price paid for the food. Row 3: Appearance, The food looks appealing and appetizing. Row 4: Nutrition, The inclusion of the quantity and variety of proteins and vitamins. Row 5: Taste, The flavor of the food in your mouth. Row 6: Safety, Eating the food will not make you sick. Row 7: Naturalness, Made without modern food technologies like genetic engineering, hormone treatment, and food irradiation. Row 8: Habits, Preserving normal consumption patterns. Row 9: Convenience, How easy and fast the food is to cook and eat. Row 10: Novelty, The food is something new that you have not tried before. Row 11: Fairness, Farmers, processors, and retailers have a fair share of the price.
Some adjustments were made for contextual relevance. Domestically produced was used in place of the commonly used origin (where the agricultural commodities were grown) to emphasize the use of domestically produced ingredients. Animal welfare and tradition (preserving traditional consumption patterns) were excluded. Although animal welfare is gaining prominence in Europe (Barber and Gertler Reference Barber and Gertler2009), awareness remains low in Japan, with only 4.4–11.3% of consumers demonstrating familiarity with the concept (Iwamoto and Kubota Reference Iwamoto and Kubota2022; Kitano et al. Reference Kitano, Mitsunari and Yoshino2022; Toyota and Tan Reference Toyota and Tan2024). Similarly, tradition, which refers to preserving established consumption patterns, has diminished in importance owing to globalization and the diversification of food choices – particularly in the context of RTE meals and dining out (Bazzani et al. Reference Bazzani, Gustavsen, Nayga and Rickertsen2018).
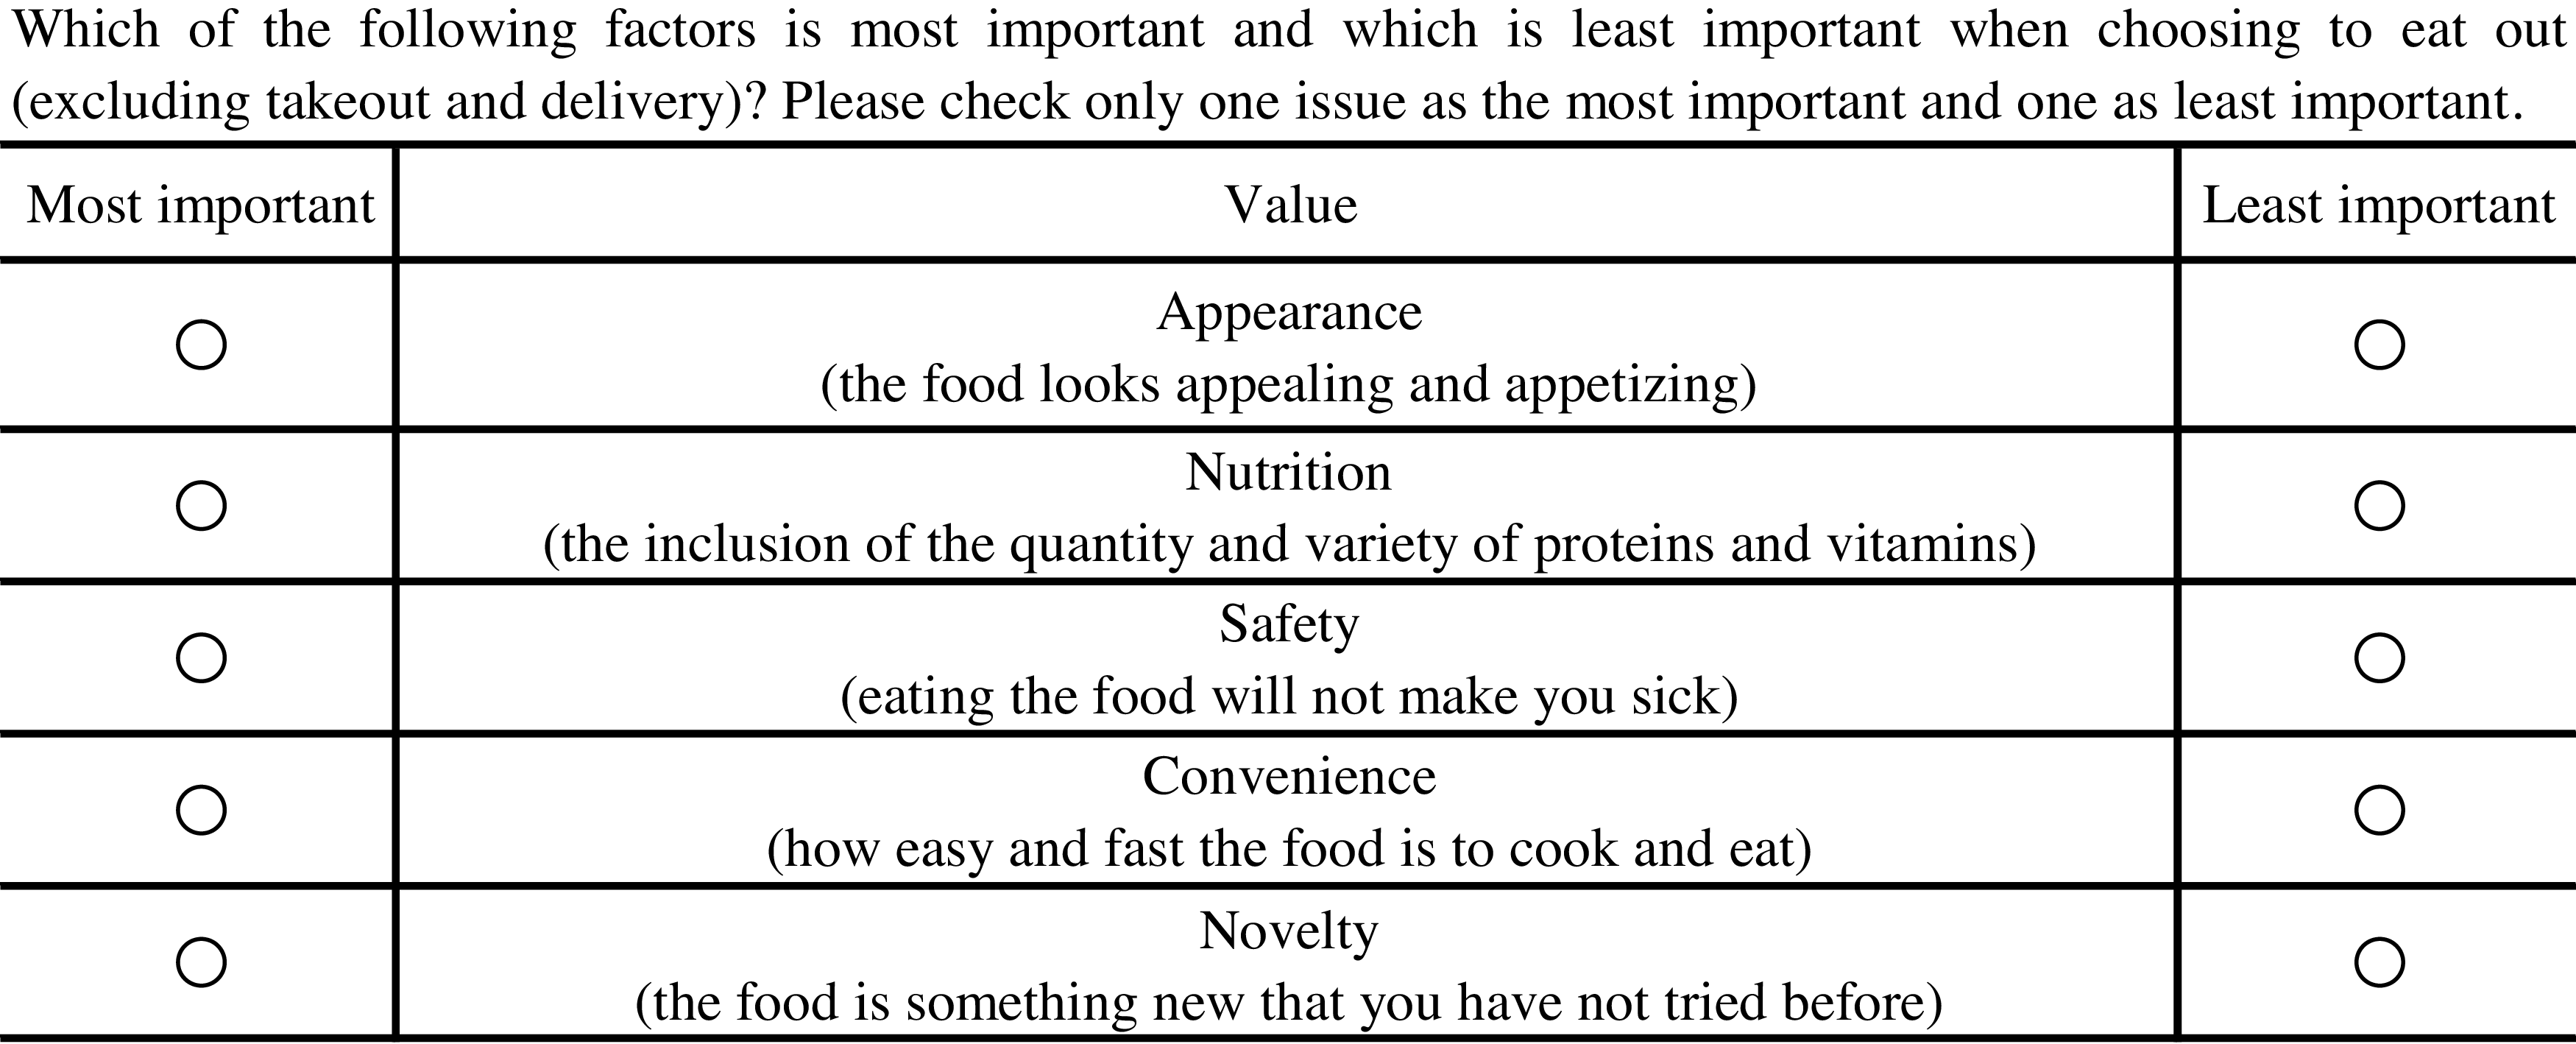
An object-case BWS design was employed to evaluate the importance of these 11 food values (Aizaki Reference Aizaki2015). A balanced incomplete block design (BIBD) was used to generate choice sets, a common approach in BWS studies (Aizaki Reference Aizaki2015; Sajiki and Lu Reference Sajiki and Lu2022; Yang et al. Reference Yang, Takashino and Fuyuki2022). The 11 food values were allocated to 11 choice sets, each containing five items, and each respondent completed all 11 BWS tasks by selecting the most and least important value in each set (Figure 1). All BWS tasks included short, standardized descriptions of each food value (Table 1 and Figure 1) to promote consistent interpretation across respondents and to minimize potential conceptual overlap among attributes such as domestically produced, taste, and safety.
Example of a best–worst question for dining out.
Note: For ready-to-eat meals, the following question was asked: “Which of the following factors is the most important and which is the least important when purchasing ready-to-eat meals – such as take-out bento boxes, rice balls, or side dishes – and eating them at home, at work, or in another location?”.

The BIBD was generated in R using the find.BIB function (Aizaki Reference Aizaki2015). This design ensures statistical efficiency through balanced and orthogonal properties (Caputo and Lusk Reference Caputo and Lusk2020; Erdem et al. Reference Erdem, Rigby and Wossink2012; Louviere et al. Reference Louviere, Flynn and Marley2015). Specifically, each food value appears the same number of times and co-occurs evenly with other values across sets, while keeping the number of comparisons manageable (Ajewole et al. Reference Ajewole, Dennis, Schroeder and Bergtold2021). The sequence of the food values within each BWS choice set was randomized across respondents to avoid ordering and position-effect biases. To ensure data quality and internal validity, the survey design relied on the balanced and orthogonal BWS structure together with randomized ordering of attributes (Aizaki and Fogarty Reference Aizaki and Fogarty2023; Louviere et al. Reference Louviere, Flynn and Marley2015). Finally, we emphasize that the primary objective of BWS is to elicit relative importance rankings in a simple and cognitively low-burden way, rather than to estimate WTP or causal effects. Importantly, the present design identifies relative importance rankings rather than economically interpretable trade-off rates or marginal rates of substitution.
Data analysis
Best–worst scores
As the simplest and most transparent summary of the BWS data, standardized best–worst (BW) scores were first calculated to describe the relative importance of food values. Following Aizaki and Fogarty (Reference Aizaki and Fogarty2023) and Ochieng and Hobbs (Reference Ochieng’ and Hobbs2016), the aggregated best–worst score (BWi) for item i was computed as
 $BW_{i}=B_{i}-W_{i}$
where Bi and Wi denote the number of times item i was selected as the “best” and the “worst,” respectively. The standardized BW score (std.BWi) was then obtained as
 $std.BW_{i}=BW_{i}/N$
where N is number of respondents. Additionally, the square-root ratio score (sqrt.BWi) and its standardized score (std.sqrt.BWi) were calculated as follows:
 $sqrt.BW_{i}=\sqrt{B_{i}/W_{i}}$
 $std.sqrt.BW_{i}=sqrt.BW_{i}/max.sqrt.BW$
where max.sqrt.BW refers to the highest sqrt.BW value among all the items. These standardized scores enable the direct comparison of the relative importance of food values and were used to provide a descriptive ranking.
Latent class analysis
As Lusk and Briggeman (Reference Lusk and Briggeman2009) pointed out, preferences for food values are heterogeneous among consumers. Furthermore, Rokeach (Reference Rokeach1973) argued that individuals and groups possess different priorities or hierarchies of values, referred to as value systems. Segments defined by value systems, rather than by a single value, are more reliable and offer greater interpretability. Individuals belonging to the same segment can be considered to share the same value system, represented by a set of unobservable utilities assigned to each value item.
Accordingly, to elucidate the heterogeneity in consumer preferences, this study applied LCA based on individual-level BW scores for 11 food value items. LCA is a finite mixture model that assumes the existence of unobservable discrete latent classes underlying multiple observed variables (Lazarsfeld and Henry Reference Lazarsfeld and Henry1968; Vermunt and Magidson Reference Vermunt, Magidson, Hagenaars and McCutcheon2002).Footnote 1
LCA assumes that the population consists of K mutually exclusive latent classes. The probability of observing an individual i’s vector of observed values is expressed as a weighted sum of the probability distributions for each class, as follows (Vermunt and Magidson Reference Vermunt, Magidson, Hagenaars and McCutcheon2002):
 ${f\left( {{{\bf{y}}_i}} \right) = \sum_{k = 1}^K{\pi _k}\prod _{j = 1}^J\phi \left( {{{{y_{ij}} - {\mu _{jk}}} \over {{\sigma _{jk}}}}} \right),}$
where
 ${\bf y}_{i}$
is the vector of BW scores for individual i across 11 items, K is the number of classes, πk is the probability of belonging to class k (with
 ${\sum }_{k=1}^{K}\pi _{k}$
=1), J is the number of items (11 in this study), φ is the standard normal probability density function, and μjk and σjk are the mean and standard deviation of item j in class k, respectively. This equation indicates that the observed data are represented by a mixture of K normal distributions.
The class membership probabilities πk are parameterized using a multinomial logit form (Lusk and Briggeman Reference Lusk and Briggeman2009), with the identifying constraint αK = 0:
 ${{\pi _k} = {{\exp \left( {{\alpha _k}} \right)} \over {\sum _{m = 1}^K\exp \left( {{\alpha _m}} \right)}}}$
Parameter estimation was conducted using the gsem command in StataNow 19.5, applying the Expectation–Maximization (EM) algorithm to obtain maximum likelihood estimates. The number of latent classes was determined by estimating models with K = 1 to K = 7 classes and jointly considering information criteria (BIC and AIC), model convergence and stability across multiple starting values, and the substantive interpretability and parsimony of the resulting class profiles, with particular attention to avoiding very small classes. Note that the LCA in this study is estimated based on individual-level aggregated BW scores rather than the raw best/worst choices from each choice task. Therefore, this analysis should be interpreted not as a structural latent class BWS model, but as a descriptive segmentation summarizing patterns in the ranking of food values.
Finally, each respondent was probabilistically assigned to the class with the highest posterior probability, and the associations between class membership and demographic variables (e.g., gender, age, and income) were analyzed.
Data collection
The main survey was conducted online by Cross Marketing Inc. from October 5 to October 7, 2024. Prior to the survey, the provider was requested to carry out standard data quality control procedures. These included consistency checks on response content (e.g., screening for contradictory or illogical responses), as well as the exclusion of respondents with extremely short completion times, and incomplete responses. The target population comprised Japan residents aged 20–69. A total of 3,000 respondents were selected using quota sampling based on the national population distribution by prefecture, sex, and age group.
The questionnaire was structured to collect information in three parts: (1) usage behavior regarding RTE meals and dining out over the past two years; (2) preference evaluation using BWS; and (3) demographic and socioeconomic characteristics, including household composition, education level, and household income. For the BWS questions, respondents were randomly assigned to one of three consumption contexts – home meals, RTE meals, or dining out – with 1,000 individuals allocated to each group.Footnote 2
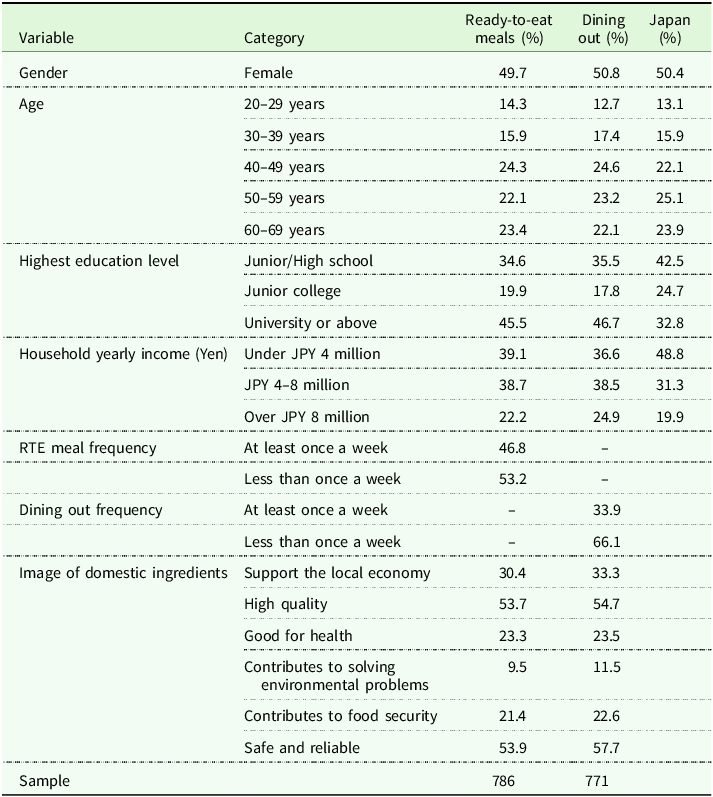
Furthermore, the analytical sample was limited to individuals who had personally paid for and had consumed the relevant meal type at least once within the past two years. The final valid sample used for analysis comprised 786 respondents for RTE meals and 771 respondents for dining out (Table 2). As the survey contexts were intentionally defined in broad terms (Figure 1), the results of this study should be interpreted as reflecting the average value structure for dining out and RTE meals as broad market categories, rather than as preferences tied to narrowly defined meal situations.
Characteristics of survey respondents
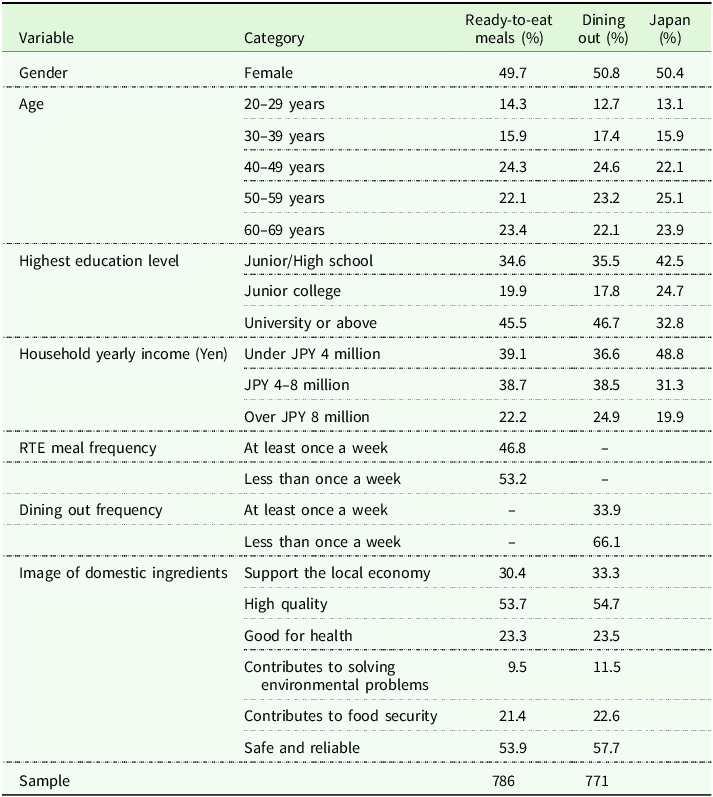
Table 2. Long description
A table comparing characteristics of survey respondents for ready-to-eat meals, dining out, and Japan. The table has 15 rows and 4 columns. The columns are labeled Variable, Category, Ready-to-eat meals (%), Dining out (%), and Japan (%). The rows are labeled with variables such as Gender, Age, Highest education level, Household yearly income, RTE meal frequency, Dining out frequency, and Image of domestic ingredients. Each row provides percentages for different categories within these variables. For example, under Gender, the percentages for Female are 49.7 for Ready-to-eat meals, 50.8 for Dining out, and 50.4 for Japan. The table also includes specific age groups, education levels, income ranges, and frequencies of meal consumption. Additionally, it captures perceptions of domestic ingredients, such as supporting the local economy, high quality, good for health, contributing to solving environmental problems, contributing to food security, and being safe and reliable.
Note: Own data and Comprehensive Survey of Living Conditions, 2023, conducted by the Ministry of Health, Labour and Welfare of Japan.
Exchange rate during the survey (October 7, 2024) was USD 1 = JPY 148.46, set by Financial Markets Dept. Bank of Japan. Percentages show the share of respondents who answered “yes” to each image associated with domestically produced ingredients under a multiple-response format.
Table 2 reports information related to the distribution of demographic and socioeconomic variables in the RTE-meal and dining-out samples. Compared with national statistics, the sample was slightly more educated and affluent. About 45% of respondents in both samples held at least a bachelor’s degree, exceeding the national average of 32.8%. Similarly, the proportion of households with annual incomes below JPY 4 million was somewhat lower than the national figure, suggesting a modest upward bias in socioeconomic status.
Additionally, 46.8% of respondents consumed RTE meals at least once a week, while 33.9% reported dining out at least once a week. Regarding perceptions of domestic ingredients, respondents held relatively positive views, particularly regarding safety and quality.
Results
Relative importance and ranking of food values
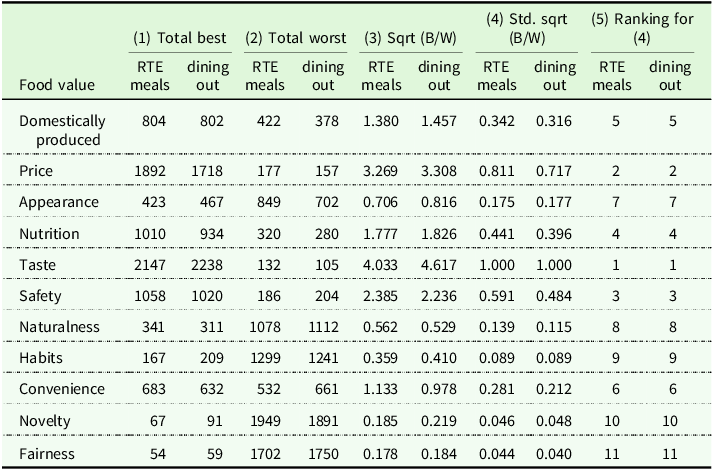
Table 3 presents the BW scores and standardized ratio scales for the food value items. Across both contexts, taste, price, and safety ranked as the three most important values, which is consistent with previous findings for Japanese consumers, indicating that these values are central considerations in food choice (Murakami et al. Reference Murakami, Nakatani, Ito, Abe, Kita and Nakashima2021; Sajiki and Lu Reference Sajiki and Lu2022; Yang et al. Reference Yang, Takashino and Fuyuki2022).
Best–worst scores and standardized ratio scales of food values
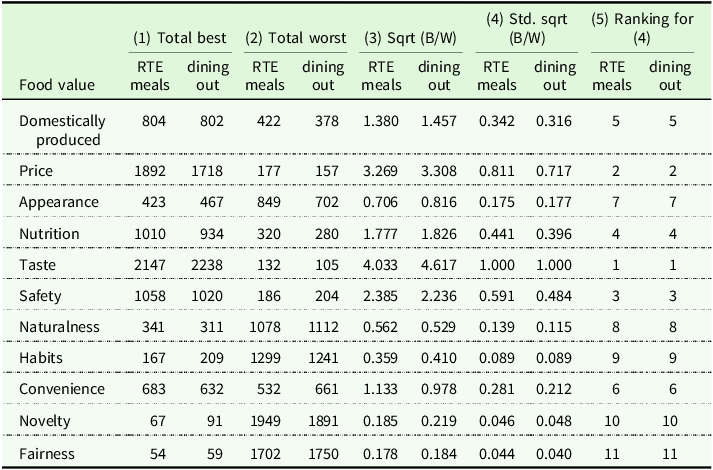
Table 3. Long description
The table presents a comparison of food value scores and standardized ratio scales across different contexts. It includes columns for total best, total worst, square root of best/worst, standard deviation of square root of best/worst, and ranking for standard deviation. The rows are labeled with different food values such as domestically produced, price, appearance, nutrition, taste, safety, naturalness, habits, convenience, novelty, and fairness. Each row contains values for RTE meals and dining out contexts. For example, the row for domestically produced shows values of 804 and 802 for total best, 422 and 378 for total worst, 1.380 and 1.457 for square root of best/worst, 0.342 and 0.316 for standard deviation of square root of best/worst, and a ranking of 5 for both contexts. The table provides a detailed comparison of how different food values are perceived in different contexts.
Regarding domestically produced ingredients, the BW scores were 0.342 for RTE meals and 0.316 for dining out, ranking fifth among the eleven food values in both contexts. This shows that, although domestic origin is positively valued, it is considered less important than core attributes, such as taste, price, safety, and nutrition.
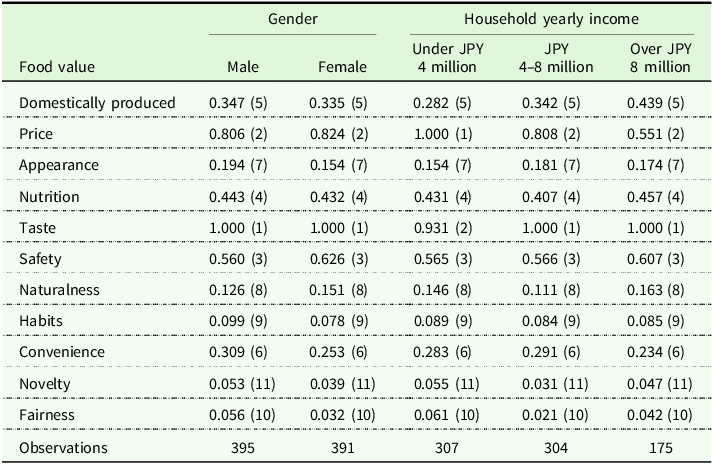
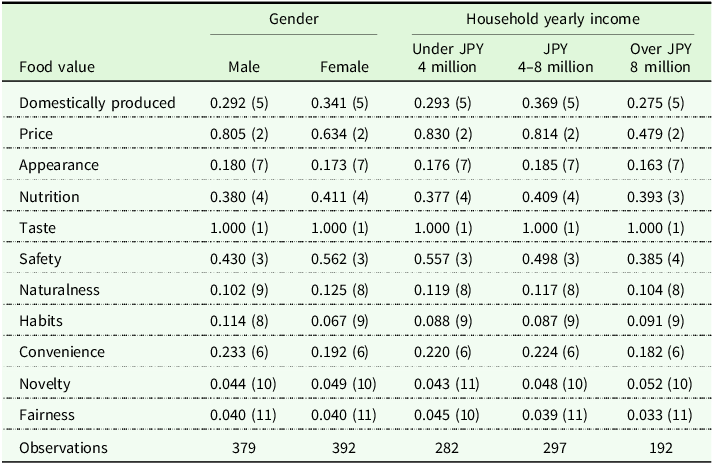
Importantly, the overall ranking patterns are highly similar across the two contexts. Core food values, such as taste, price, and safety, consistently occupy the top positions for both RTE meals and dining out, while domestically produced ingredients remain a mid-ranked attribute in each setting (Table A1).Footnote 3 This descriptive similarity suggests a substantial degree of stability in the relative prioritization of food values across consumption contexts. Additionally, the rankings based on BW scores were generally consistent across gender and income groups, suggesting that the priority order of food-related values is stable (Tables A2, A3).
Consumer segmentation based on latent class analysis
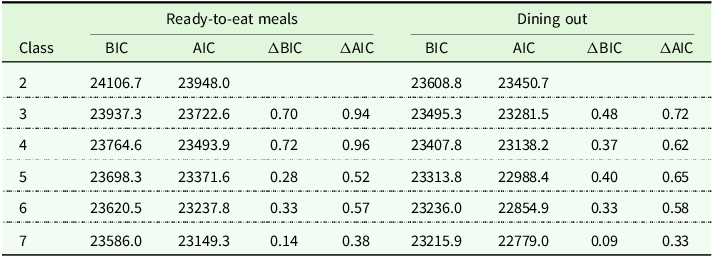
To determine the optimal number of classes, we evaluated the AIC and BIC (Table 4). For both RTE meals and dining out, the information criteria decreased as the number of classes increased. However, for RTE meals, the improvement (ΔBIC, ΔAIC) became modest after four classes, and for dining out, the marginal reduction in BIC diminished as the number of classes increased, particularly beyond five classes. These patterns indicate that the gain in model fit relative to increased complexity was limited. Therefore, considering model parsimony and interpretability (Lockshin and Cohen Reference Lockshin and Cohen2011; Swait Reference Swait1994), we adopted the four-class model as the optimal segmentation for both consumption contexts.Footnote 4 The following section describes the characteristics of each class based on standardized share of preference.
Criteria for determining the optimal number of latent classes

Table 4. Long description
A table comparing information criteria for determining the optimal number of latent classes for ready-to-eat meals and dining out. The table has 7 rows and 14 columns. Column headers are Class, BIC, AIC, ΔBIC, ΔAIC for ready-to-eat meals, and BIC, AIC, ΔBIC, ΔAIC for dining out. Row labels are class numbers from 2 to 7. Row 1: Class 2, BIC 24106.7, AIC 23948.0, ΔBIC, ΔAIC for ready-to-eat meals, BIC 23608.8, AIC 23450.7, ΔBIC, ΔAIC for dining out. Row 2: Class 3, BIC 23937.3, AIC 23722.6, ΔBIC 0.70, ΔAIC 0.94 for ready-to-eat meals, BIC 23495.3, AIC 23281.5, ΔBIC 0.48, ΔAIC 0.72 for dining out. Row 3: Class 4, BIC 23764.6, AIC 23493.9, ΔBIC 0.72, ΔAIC 0.96 for ready-to-eat meals, BIC 23407.8, AIC 23138.2, ΔBIC 0.37, ΔAIC 0.62 for dining out. Row 4: Class 5, BIC 23698.3, AIC 23371.6, ΔBIC 0.28, ΔAIC 0.52 for ready-to-eat meals, BIC 23313.8, AIC 22988.4, ΔBIC 0.40, ΔAIC 0.65 for dining out. Row 5: Class 6, BIC 23620.5, AIC 23237.8, ΔBIC 0.33, ΔAIC 0.57 for ready-to-eat meals, BIC 23236.0, AIC 22854.9, ΔBIC 0.33, ΔAIC 0.58 for dining out. Row 6: Class 7, BIC 23586.0, AIC 23149.3, ΔBIC 0.14, ΔAIC 0.38 for ready-to-eat meals, BIC 23215.9, AIC 22779.0, ΔBIC 0.09, ΔAIC 0.33 for dining out.
Note: AIC, Akaike information criterion; BIC, Bayesian information criterion.
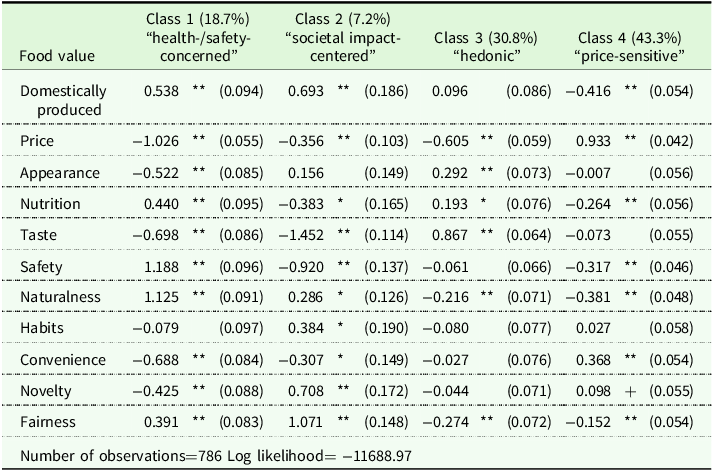
In the context of RTE meals, four latent classes were identified (Table 5). Class 1 comprises consumers who place particularly high importance on safety and naturalness and is therefore referred to as the health- and safety-concerned segment. Although other values, such as nutrition and domestically produced ingredients, are also positively valued in this segment, safety and naturalness clearly dominate their preference structure. Class 2 comprises consumers whose members attach relatively high importance to society-centered values, including fairness, novelty and domestically produced ingredients, and is labeled the societal impact-centered segment. Class 3 comprises consumers who rate taste as the most important food value, closely followed by appearance, and is therefore referred to as the hedonic segment. Class 4 represents price-sensitive consumers who perceive price as by far the most important value; this class is labeled the price-sensitive segment.
Class means (standard errors in brackets) of food values in RTE meals

Long description
The table presents the mean values and standard errors of different food values for four classes of consumers regarding ready-to-eat (RTE) meals. The table has 13 rows and 5 columns. The columns are labeled as Class 1 (18.7 percent), Class 2 (7.2 percent), Class 3 (30.8 percent), and Class 4 (43.3 percent), with each class representing a different consumer segment: health- and safety-concerned, societal impact-centered, hedonic, and price-sensitive, respectively. The rows list various food values: Domestically produced, Price, Appearance, Nutrition, Taste, Safety, Naturalness, Habits, Convenience, Novelty, and Fairness. Each cell contains a mean value and a standard error in brackets. Notable trends include high importance of safety and naturalness in Class 1, societal values in Class 2, taste and appearance in Class 3, and price in Class 4.
Note: **, *, and + indicate statistical significance at 1%, 5%, and 10% levels, respectively.
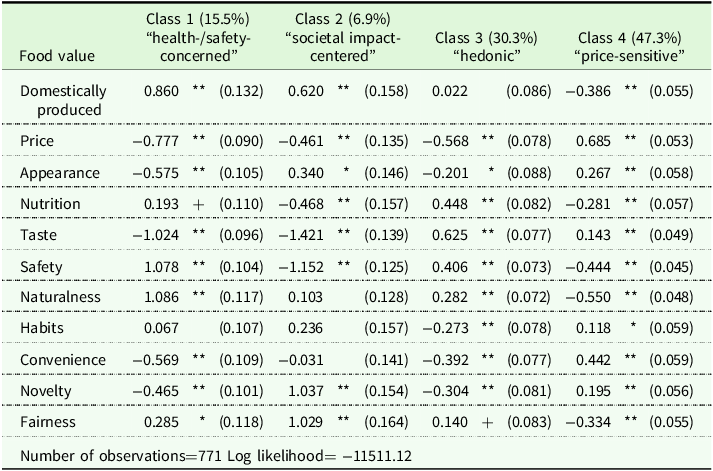
In the context of dining out, four latent classes were identified (Table 6). Class 1 comprises consumers who place particularly high importance on safety and naturalness and is therefore referred to as the health- and safety-concerned segment. Although domestically produced ingredients are also positively valued in this segment, safety and naturalness clearly dominate, while price and convenience are relatively less important. Class 2 comprises consumers who attach relatively high importance to society-centered values, including fairness, novelty, and domestically produced ingredients, and is labeled the societal impact-centered segment. Class 3 comprises consumers who rate taste as the most important food value, followed by nutrition and safety, and is therefore referred to as hedonic segment. Class 4 represents price-sensitive consumers who perceive price as by far the most important food value and is labeled the price-sensitive segment.
Class means (standard errors in brackets) of food values in dining out

Table 6. Long description
A table comparing food values across four consumer classes: health- and safety-concerned, societal impact-centered, hedonic, and price-sensitive. The table has 12 rows and 5 columns. Column headers are Class 1, Class 2, Class 3, and Class 4, each with a percentage in parentheses. Row labels include Domestically produced, Price, Appearance, Nutrition, Taste, Safety, Naturalness, Habits, Convenience, Novelty, and Fairness. Each cell contains a value with a standard error in brackets. Notable trends include high values for Safety and Naturalness in Class 1, high values for Fairness and Novelty in Class 2, high values for Taste in Class 3, and high values for Price in Class 4.
Note: **, *, and + indicate statistical significance at 1%, 5%, and 10% levels, respectively.
Although the overall segment structure is remarkably similar across the two consumption contexts, minor contextual variations are observed in the relative salience of secondary attributes. For example, appearance is more closely associated with hedonic preferences in RTE meals, whereas nutrition assumes a more prominent role in dining out decisions. Nevertheless, the size distribution of segments is broadly comparable across contexts, with the price-sensitive segment constituting the largest group in both cases (approximately 43–47%).
Consumer characteristics by class
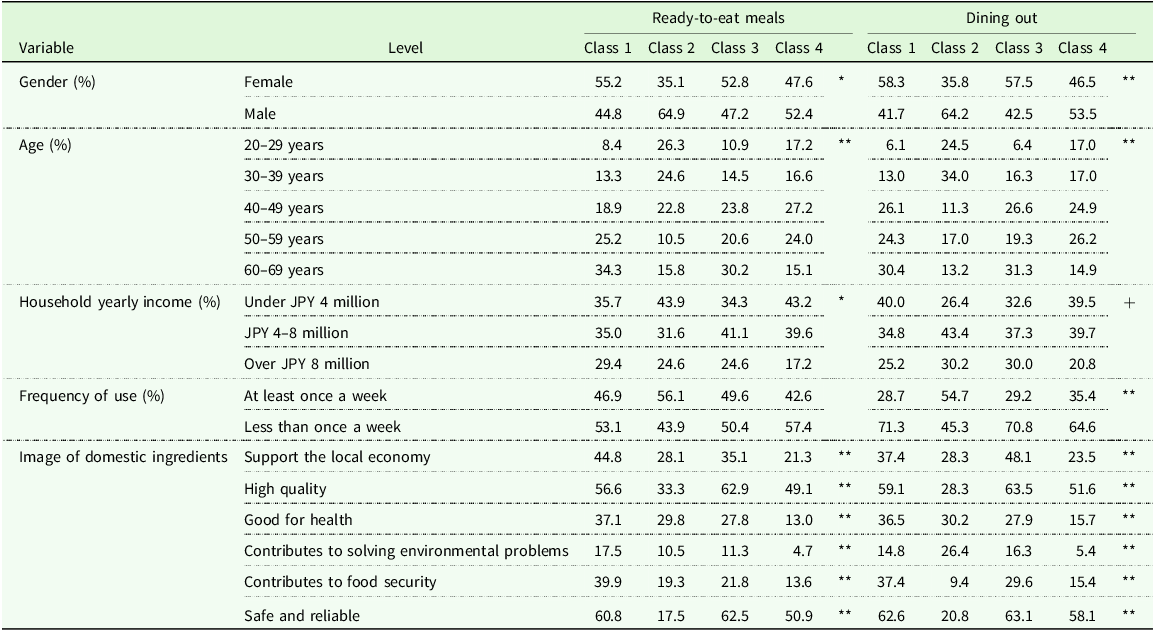
To further interpret the latent classes, class composition was examined using demographic and behavioral characteristics, including gender, age, income, frequency of RTE meal consumption or dining out, and evaluations of domestic ingredients (Table 7).
Composition of latent classes per household characteristics

Table 7. Long description
A table comparing demographic and behavioral characteristics across different classes for ready-to-eat meals and dining out. The table has 4 rows and 10 columns. Column headers are Variable, Level, Ready-to-eat meals Class 1, Ready-to-eat meals Class 2, Ready-to-eat meals Class 3, Ready-to-eat meals Class 4, Dining out Class 1, Dining out Class 2, Dining out Class 3, Dining out Class 4. Row labels include Gender, Average, Household yearly income, Frequency of use, and Image of domestic ingredients. Row 1: Gender, Female, 55.2, 35.1, 52.8, 47.6, 58.3, 35.8, 57.5, 46.5. Row 2: Gender, Male, 44.8, 64.9, 47.2, 52.4, 41.7, 64.2, 42.5, 53.5. Row 3: Average, 20-29 years, 8.4, 26.3, 10.9, 17.2, 6.1, 24.5, 6.4, 17.0. Row 4: Average, 30-39 years, 13.3, 24.6, 14.5, 16.6, 13.0, 34.0, 16.3, 17.0. Row 5: Average, 40-49 years, 18.9, 22.8, 23.8, 27.2, 26.1, 11.3, 26.6, 24.9. Row 6: Average, 50-59 years, 25.2, 10.5, 20.6, 24.0, 24.3, 17.0, 19.3, 26.2. Row 7: Average, 60-69 years, 34.3, 15.8, 30.2, 15.1, 30.4, 13.2, 31.3, 14.9. Row 8: Household yearly income, Under JPY 4 million, 35.7, 43.9, 34.3, 43.2, 40.0, 26.4, 32.6, 39.5. Row 9: Household yearly income, JPY 4-8 million, 35.0, 31.6, 41.1, 39.6, 34.8, 43.4, 37.3, 39.7. Row 10: Household yearly income, Over JPY 8 million, 29.4, 24.6, 24.6, 17.2, 25.2, 30.2, 30.0, 20.8. Row 11: Frequency of use, Once a week or more, 46.9, 56.1, 49.6, 42.6, 28.7, 54.7, 29.2, 35.4. Row 12: Frequency of use, Less than once a week, 53.1, 43.9, 50.4, 57.4, 71.3, 45.3, 70.8, 64.6. Row 13: Image of domestic ingredients, Support the local economy, 44.8, 28.1, 35.1, 21.3, 37.4, 28.3, 48.1, 23.5. Row 14: Image of domestic ingredients, High quality, 56.6, 33.3, 62.9, 49.1, 59.1, 28.3, 63.5, 51.6. Row 15: Image of domestic ingredients, Good for health, 37.1, 29.8, 27.8, 13.0, 36.5, 30.2, 27.9, 15.7. Row 16: Image of domestic ingredients, Contributes to solving environmental problems, 17.5, 10.5, 11.3, 4.7, 14.8, 26.4, 16.3, 5.4. Row 17: Image of domestic ingredients, Contributes to food security, 39.9, 19.3, 21.8, 13.6, 37.4, 9.4, 29.6, 15.4. Row 18: Image of domestic ingredients, Safe and reliable, 60.8, 17.5, 62.5, 50.9, 62.6, 20.8, 63.1, 58.1.
Note: **, *, and + indicate statistical significance at 1%, 5%, and 10% levels, respectively.
Values represent the percentage of respondents within each latent class who answered “yes” to each image associated with domestically produced ingredients. For example, in the RTE-meal context, 44.8% of respondents in Class 1 selected “supporting the local economy”; the corresponding non-selection share (55.2%) is omitted from the table for brevity.
Across both consumption contexts, the socio-demographic profiles of the latent classes are broadly consistent. While no statistically significant differences are observed across classes in the frequency of RTE meal consumption, differences in dining-out frequency are statistically significant. The health-/safety-concerned segment is characterized by a relatively higher proportion of female and older consumers and exhibits less frequent dining out, while holding consistently positive images of domestically produced ingredients, particularly regarding quality and safety. The societal impact-centered segment tends to be younger and more male-dominated, with a relatively higher share of lower-income households in the RTE-meal context and a higher share of middle-income households in the dining-out context, and relatively frequent dining out; although this segment evaluates domestic ingredients less positively overall, domestic origin is relatively more important for this group than for the other classes. The hedonic segment includes more female and older consumers and a relatively large share of middle-income households and evaluates the quality and safety of domestic ingredients particularly positively, while attaching less importance to domestic origin per se. The price-sensitive segment is more male-dominated and includes a higher proportion of low-income households, exhibits less frequent dining out, and places relatively limited emphasis on domestic origin despite moderately positive perceptions of quality and safety.
Discussion
This study examined the food values prioritized by Japanese consumers in RTE meals and dining out – with particular attention to the relative position of domestically produced ingredients within broader preference structures. Using BWS and LCA, we documented overall value priorities and heterogeneity in stated importance patterns.
First, BW score results revealed that taste, price, and safety consistently emerged as the three most important food values in both contexts. This aligns with previous studies on Japanese consumers identifying sensory quality, economic considerations, and food safety as central factors in food choice (Murakami et al. Reference Murakami, Nakatani, Ito, Abe, Kita and Nakashima2021; Sajiki and Lu Reference Sajiki and Lu2022; Yang et al. Reference Yang, Takashino and Fuyuki2022). An important descriptive finding is the high degree of similarity in food value prioritization across RTE meals and dining out. Despite differences in consumption contexts and procurement practices, the relative importance rankings of food values were highly similar across the two contexts. This shows that food values may function as relatively generalizable preference structures rather than being strongly context-specific, at least between these two common consumption modes in Japan. Additionally, domestically produced ingredients ranked fifth among the eleven food values. This pattern suggests that, while domestic origin is positively evaluated, it is generally positioned as a secondary consideration relative to core attributes that more directly shape consumption experiences. Similar moderate rankings of origin-related cues have been reported in BWS studies in other countries (Costanigro et al. Reference Costanigro, Kroll, Thilmany and Bunning2014; Lusk and Briggeman Reference Lusk and Briggeman2009). Therefore, the present results support the view that domestic origin functions as a complementary rather than primary driver of food choice in RTE-meal and dining-out contexts.Footnote 5
Second, the LCA results for RTE meals and dining out indicate that consumer segment structures are broadly stable across contexts, although their relative salience varies by consumption setting. In both contexts, the price-sensitive segment constitutes the largest group, followed by a substantial hedonic segment, whereas the health-/safety-concerned and societal impact-centered segments represent meaningful but still limited shares of the market. This distribution implies that attributes such as price and taste dominate the overall preference structure, while origin-related considerations are more concentrated within smaller segments. Prior studies have similarly shown that origin-related cues tend to occupy a secondary position relative to core attributes, such as taste, price, and safety, in consumers’ value hierarchies (Costanigro et al. Reference Costanigro, Kroll, Thilmany and Bunning2014; Lusk and Briggeman Reference Lusk and Briggeman2009). Moreover, evaluations of domestic origin are often mediated by perceptions of quality and safety rather than functioning as independent drivers of food choice (Gineikiene et al. Reference Gineikiene, Schlegelmilch and Ruzevičiūtė2016; Thøgersen Reference Thøgersen2023). Consistent with this literature, our results suggest that while segments that place relatively greater importance on domestically produced ingredients do exist, they account for only a minority of consumers in the overall sample.
Third, the socio-demographic profiles associated with latent classes are broadly consistent across the two contexts, suggesting that segment membership reflects relatively stable consumer characteristics rather than context-dependent sorting alone. Price-sensitive segments tend to include larger shares of lower-income and male consumers and exhibit lower dining-out frequency, whereas segments characterized by stronger emphasis on health and safety are more prevalent among older consumers and those with middle to higher incomes. These patterns are consistent with previous findings that older consumers tend to be more health- and safety-conscious (Lee et al. Reference Lee, Niode, Simonne and Bruhn2012; Liu and Grunert Reference Liu and Grunert2020), while lower-income consumers are generally more price-sensitive (Wakefield and Inman Reference Wakefield and Inman2003). Importantly, although price-oriented consumers recognize domestically produced ingredients as relatively safe and high-quality, they assign them limited importance in actual decision making. A similar pattern is observed for the hedonic segment, which positively evaluates the quality and safety of domestically produced ingredients but does not attach high importance to domestic origin per se. This suggests that favorable evaluations of domestic origin do not necessarily translate into high stated importance when other core attributes, such as price or taste, dominate decision making.
Finally, the findings offer tentative implications while recognizing the descriptive scope of the analysis. As the study does not estimate willingness to pay or predict market responses, the implications should be interpreted as suggestive rather than prescriptive. The results show that consumer priorities differ substantially across segments, confirming that preferences for domestically produced ingredients are not uniform. Additionally, the strong role of price sensitivity implies that domestic origin generally functions as a secondary attribute rather than a primary driver of choice in RTE meals and dining out, particularly among price-sensitive consumers who hold favorable perceptions of domestic ingredients yet do not prioritize origin in actual choice situations. Overall, the results provide benchmark evidence on where domestic origin sits within the hierarchy of food values and how that position varies across consumer segments, suggesting that origin cues alone may have limited influence unless credibly linked to tangible benefits, such as taste, safety, or competitive pricing.
Conclusions
This study examined how Japanese consumers prioritize food values in RTE meals and dining out, with particular attention to the relative position of domestically produced ingredients. Using BWS and LCA, we documented both overall value hierarchies and systematic heterogeneity across consumer segments.
Three main conclusions emerge. First, the hierarchy of food values is highly similar across the two contexts: taste, price, and safety consistently dominate, whereas domestically produced ingredients occupy a mid-level position. Second, substantial heterogeneity exists. A large price-sensitive segment coexists with a substantial hedonic segment and smaller segments that emphasize safety and societal values, indicating that average preferences mask meaningful differences in value prioritization. Third, although domestically produced ingredients are positively evaluated in terms of safety and quality, they are rarely prioritized in food choice, particularly among price-sensitive and hedonic consumers. These findings imply that strategies to promote domestic ingredients are unlikely to be effective if they rely solely on origin cues. Instead, domestic origin needs to be credibly linked to tangible benefits that consumers already value, such as price and taste.
This study has several limitations. First, although each food value was explicitly defined in the survey, the attribute “domestically produced ingredients” may partially capture unobserved perceptions, such as taste and safety, and these mechanisms were not explicitly disentangled in the analysis. Second, the sample is somewhat more educated and higher-income than the national average, which may limit generalizability. Finally, the consumption contexts were intentionally defined in broad terms; more fine-grained settings (convenience-store RTE, premium RTE, fast-casual dining, or full-service restaurants) may exhibit different value hierarchies.
Overall, this study provides descriptive benchmark evidence on the position of domestic origin within consumers’ food value hierarchies and on the stability of food value prioritization across RTE meals and dining out. By clarifying when domestic origin matters – and when it does not – the results offer a useful basis for both academic discussion and the design of marketing and policy approaches to support domestic agricultural products.
Data availability statement
Data supporting the findings of this study are available from the corresponding author upon request.
Funding statement
This study was supported by the Takahashi Industrial and Economic Research Foundation (Ref.14-003-121). The findings and conclusions of this study are those of the authors, and do not necessarily reflect the positions or policies of the Takahashi Industrial and Economic Research Foundation.
Competing interests
The authors declare that they have no competing financial interests or personal relationships that may have influenced the work reported in this study.
Ethical standards
This survey was approved by the Ethics Committee of the Graduate School of Agriculture, Kobe University. The reference number of ethics committee is 202409-1.
Appendix
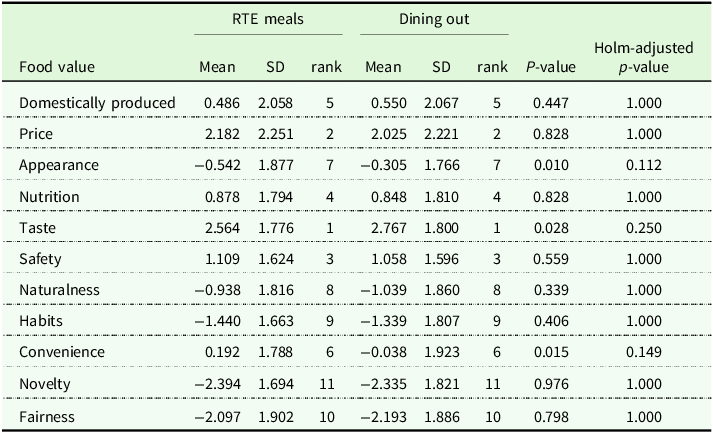
Mean BW scores and cross-context comparison of food values

Table A1. Long description
A table comparing food values for RTE meals and dining out. The table has 12 rows and 9 columns. The columns are labeled Food value, RTE meals Mean, RTE meals SD, RTE meals rank, Dining out Mean, Dining out SD, Dining out rank, P-value, and Holm-adjusted p-value. The rows are labeled with different food values such as Domestically produced, Price, Appearance, Nutrition, Taste, Safety, Naturalness, Habits, Convenience, Novelty, and Fairness. Each row contains mean values, standard deviations, ranks, P-values, and Holm-adjusted p-values for both RTE meals and dining out. Notable trends include Taste having the highest rank for both RTE meals and dining out, while Novelty and Fairness have the lowest ranks.
Note: P-values are based on nonparametric permutation tests of mean differences in mean BW scores between independent samples (10,000 replications). Holm-adjusted P-values are reported to account for multiple comparisons.
Comparison of aggregated BW scores for each activity in the RTE-meal context

Table A2. Long description
A table comparing food value scores by gender and household income. The table has 11 rows and 6 columns. The columns are labeled Gender and Household yearly income, with sub-columns Male, Female, Under JPY 4 million, JPY 4-8 million, and Over JPY 8 million. The rows are labeled with different food values: Domestically produced, Price, Appearance, Nutrition, Taste, Safety, Naturalness, Habits, Convenience, Novelty, Fairness, and Observations. Each cell contains a numerical score and a rank in parentheses. Notable trends include Taste consistently having the highest score across all categories, while Novelty and Fairness have the lowest scores. The number of observations varies across different groups.
Note: BW scores are standardized within each subgroup; numbers in parentheses indicate rank within subgroup.
Comparison of aggregated BW scores for each activity in the dining-out context

Table A3. Long description
A table comparing food value scores by gender and household income. The table has 11 rows and 6 columns. The columns are labeled Gender and Household yearly income, with sub-columns Male, Female, Under JPY 4 million, JPY 4–8 million, and Over JPY 8 million. The rows are labeled with different food values: Domestically produced, Price, Appearance, Nutrition, Taste, Safety, Naturalness, Habits, Convenience, Novelty, Fairness, and Observations. Each cell contains a numerical value representing the score for that food value category. The table shows the number of observations for each group at the bottom. Notable trends include Taste having the highest score across all groups, while Fairness and Novelty have the lowest scores.
Note: BW scores are standardized within each subgroup; numbers in parentheses indicate rank within subgroup.

 Open access

