I. INTRODUCTION
The experimental load-displacement curve obtained by probing the surface of a material in a nanoindentation experiment are analyzed to evaluate the reduced modulus of a material according to the fundamental relation given byReference Pharr, Oliver and Brotzen1
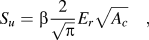 $$S_u = \beta {2 \over {\sqrt \pi }}E_r \sqrt {A_c } \quad,$$
where Su is initial unloading stiffness or contact stiffness, Ac is the projected area of elastic contact, Er is the reduced modulus of a material and β is the correction factor that takes the lack of axial symmetry of the pyramidal indenter into account. The contact stiffness is defined as the slope of the unloading curve evaluated at the maximum depth of penetration. The area of contact is either measured independently from the hardness impression or derived using the contact stiffness according to the procedure developed by Oliver and Pharr.Reference Oliver and Pharr2 To evaluate the slope, one needs a mathematical description of the unloading response, which is difficult to obtain analytically owing to the complexities involved in the indentation process.Reference Pharr and Bolshakov3 The unloading response is usually described by an algebraic function established by curve fitting of the experimental load versus displacement data.
In the most widely used Oliver and Pharr (OP) method, the unloading curve obtained using a Berkovich indenter is represented by a power law whose parameters are determined by the least square fitting. The exponent of the power law, according to Oliver and Pharr, is slightly material-dependent and may take a value in the range 1.25–1.51, which led them to conclude that the shape of a Berkovich indenter may be described as a parabola of revolution.Reference Oliver and Pharr2 This observation is contrary to the fact that a conical indenter closely approximates a Berkovich one, as they are geometrically self-similar. Later, Pharr and Bolshakov,Reference Pharr and Bolshakov3 however, justified this variation in the exponent by introducing the concept of “effective indenter shape.” A different interpretation of the unloading response obtained by a Berkovich indenter is also available in the literature. Gong et al.,Reference Marx and Balke4 using experimental data on the oxides of ceramics, argued that the unloading response acquired with the help of a Berkovich indenter indeed resembles that from a conical indenter, provided appropriate correction for residual stress that arises during indentation is applied. They suggested a modified form of power law having exponent of 2 with an additional term accounting for the residual stress effect. Their assumption appears reasonable from the viewpoint that the loading curves obtained by both Berkovich and the conical indenters can be represented by parabolas.Reference Sawa and Tanaka5 There are, however, many cases where the values of the exponent well above 2 have been observed,Reference Gong, Miao and Peng6–Reference Briscoe and Sebastian8 which may be difficult to explain based on aforementioned theories. Moreover, even for the same material, the power law parameters depend on peak indentation load. Their relationship is not unique and, therefore, stiffness value at one peak indentation loads cannot be determined from the other. Based on above discussion, it may be concluded that power law parameters lack clarity in their physical meaning.
Another disadvantage associated with the power law description is the uncertainty involved in the determination of its parameters, which is highly dependent on the fraction of the unloading data used in the curve-fitting process.Reference Tranchida and Piccarolo9, Reference Jha, Suksawang, Lahiri and Agarwal10 It should be noted here that power law parameters are often determined using the initial 30% of the unloading response in the OP method. They also depend on the initial guess and are very sensitive to the residual depth of indentation, thereby making the fitting process cumbersome.Reference Jha, Suksawang, Lahiri and Agarwal10 Fitting experimental data in the form prescribed by Gong et al.Reference Marx and Balke4 is even more tedious as it involves a process of trial and error. Again, instances where the power law poorly fits have also been reported; for example, Van Landingham et al.Reference VanLandingham, Villarrubia, Guthrie and Meyers11 showed that the spline curve fit provides a better approximation of the unloading responses from polymers they studied. However, the physical meaning of the spline parameters is hard to explain. Thus, uncertainties in their values, lack of clarity in their physical meaning, and amount of computational effort required to evaluate them warrant the development of an alternative method for the evaluation of the contact stiffness.
Energies measured in a nanoindentation experiment, or their ratios, are often used for the nanomechanical analysis of the response of a material.Reference Sakai12–Reference Attaf17 One of the important applications of the indentation energies is that they can be used to represent the load-displacement curves. AttafReference Attaf16 has shown that the total and elastic energy constants—defined with respect to reference indentation energy—can be used to model the loading and unloading indentation responses. However, the derivative of the energy-based power function evaluated at the maximum depth of penetration is usually overestimated, even in the case where this function perfectly models the experimental unloading curve. It would be expedient to investigate the reason behind the observed discrepancy in the derivative so that the advantage offered by the power function in modeling the unloading response could be exploited. Therefore, the intent of this study is to develop an efficient contact stiffness evaluation procedure from the derivative of the energy-based power function by considering the unloading responses of materials having a wide range of elastic recovery capabilities as well as elastic modulus and hardness values.
II. THEORETICAL
In the following section, for the sake of comparison, we briefly review the procedure used to determine the contact stiffness and depth in the standard OP method. Several terminologies generally used in the characterization of the indentation response and relevant in this study are also explained.
A. Overview of the Oliver and Pharr method
In the OP method, the initial unloading stiffness (SOP) is usually obtained by evaluating the differential of the power law at the maximum depth of penetration (h max) as:
 $$S_{OP} = mA_0 \left( {h_{\max } - h_f } \right)^{m - 1} \quad,$$
where A 0, m and hf are the parameters determined by the least square fitting of the initial 30% of the unloading portion of the load-displacement curves. Initial unloading stiffness so obtained is then used to determine the contact depth (hc) as:
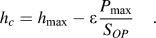 $$h_c = h_{\max } - \varepsilon {{P_{\max } } \over {S_{OP} }}\quad.$$
B. Elastic recovery and energy constants
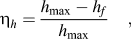
Response of a material to indentation is often characterized by a dimensionless elastic recovery ratio.Reference Hainsworth, Chandler and Page18, Reference Milman19 This parameter is a measure of a fraction of the deformation that are elastic and is generally expressed either in terms of depth (ηh) or work (ηh) recovery ratios as:
 $$\eta _h = {{h_{\max } - h_f } \over {h_{\max } }}\quad,$$
 $$\eta _w = {{W_E } \over {W_T }}\quad,$$
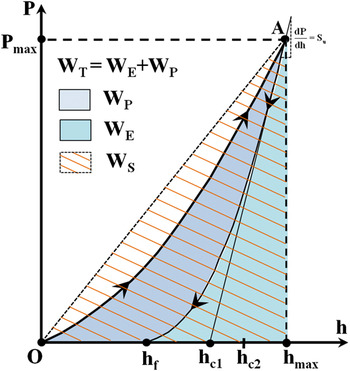
where WT is the total work done which can be additively decomposed into its elastic (WE) and plastic (WP) components. Total and elastic works are given by the area under the loading and unloading curves, respectively, as shown in Fig. 1. Depth and work recovery ratios are equal in magnitudeReference Milman19 and may fall in the range 0–1 in which lower and upper limits represent the elastic and fully plastic materials, respectively.
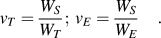
AttafReference Attaf13 introduced several energy-based parameters by assuming the absolute work, possible maximum energy that could be dissipated in an indentation experiment, as reference energy. Based on nanoindentation results on ceramics, he found that the absolute work (WS) is proportional to both total and elastic work done respectively, such that
 $$v_T = {{W_S } \over {W_T }};\,v_E = {{W_S } \over {W_E }}\quad.$$
Schematic illustration of load-displacement curves showing associated terminologies used in this study. Points hc 1 and hc 2 are contact depths corresponding to ε = 1.0 and ε = 0.75, respectively.

The absolute work is given by: WS = 0.5P maxh max. Ratios vT and vE are known as the total and elastic energy constants, respectively. Value for the total energy constant, which primarily depends on the indenter geometry, falls in the range 1.0–1.50 with the upper limit corresponding to perfectly sharp conical indenter. On the other hand, depending on the type of material, vE may vary in the range 1 to ∞ with extremes, like the elastic recovery ratio, representing elastic and perfectly plastic materials, respectively. We have shown elsewhereReference Jha, Suksawang, Lahiri and Agarwal10 that vT and vE are evaluated in a slightly different way when the experimental load-displacement curves also feature a dwelling portion.
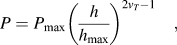
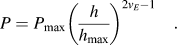
The energy constants defined above may be used to represent nanoindentation curves for a material. AttafReference Attaf16 derived the following expressions, on the basis of functional analysis, to represent the loading and unloading curves, respectively.
 $$P = P_{\max } \left( {{h \over {h_{\max } }}} \right)^{2v_T - 1} \quad,$$
 $$P = P_{\max } \left( {{h \over {h_{\max } }}} \right)^{2v_E - 1} \quad.$$
It is generally found that Eq. (7) can model the loading curve very accurately for all levels of loads. The approximating power of Eq. (8), however, depends on the type of material; this is more accurate in the case of materials that recover less upon unloading.Reference Jha, Suksawang and Agarwal20 For harder materials, only the initial portion of the unloading curve can be approximated, which is good enough to analytically evaluate the slope at the maximum penetration depth. The differentiation of Eq. (8) at h = h max leads to the following expressions for the slope or the initial unloading stiffness (SE).
 $$S_E = \left. {{{dP} \over {dh}}} \right|_{h = h_{\max } } = \left( {2v_E - 1} \right){{P_{\max } } \over {h_{\max } }}\quad.$$
The SE determined by Eq. (9) should in principle match the SOP obtained by Eq. (1). AttafReference Attaf17 also derived an expression for the contact depth  $\left( {h_c^E } \right)$ using Eq. (9) in the following form:
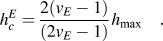 $$h_c^E = {{2\left( {v_E - 1} \right)} \over {\left( {2v_E - 1} \right)}}h_{\max } \quad.$$
The validity of Eq. (10) has also been confirmed in the previous studies.Reference Jha, Suksawang, Lahiri and Agarwal10, Reference Xiang, Fenghui, Jianye and Tiejun21Equation (10) implies that the difference between  $h_c^E $ and h max becomes smaller as we move from harder to softer materials. As will be discussed, the proximity between these two quantities has important bearing on the accuracy of initial unloading stiffness determined by Eq. (9).
III. EXPERIMENTAL
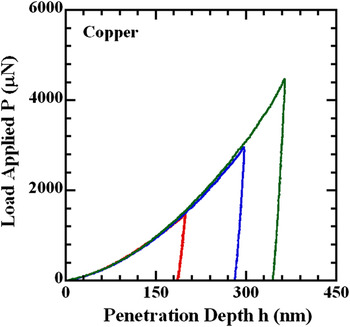
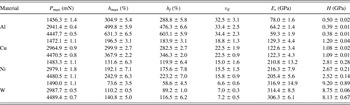
Nanoindentation experiments are conducted in the load-controlled mode using a Hysitron Triboindenter fitted with a Berkovich indenter at room temperature on four metal samples: single crystal aluminum, and copper; and polycrystalline nickel and tungsten. A triangular loading history with loading and unloading times each equal to 10 s is considered with three different peak indentation loads of magnitudes approximately equal to 1500, 3000, and 4500 μN. A total of nine indents are made corresponding to each peak indentation load on every polished sample having a surface roughness less than 100 Å. Representative load-displacement curves obtained from nanoindentation experiments for copper are shown in Fig. 2. The area function is established according to the OP method using a standard fused quartz sample. Table I summarizes mean and standard deviation of the reduced modulus and hardness for all these metals, which accord well with those reported in the literature.Reference Lee, Ko, Han, Park and Hwang22 Previously conducted indentation tests on plasma-sprayed Al-12 wt.% Si (referred as Al-Si hereafter, Ref. Reference Lee, Ko, Han, Park and Hwang22) coating are also used in this study.Reference Bakshi, Singh, Seal and Agarwal23 An Al-Si sample was subjected to a trapezoidal load history with loading, dwelling and unloading times respectively equal to 10, 2 and 10 s. Similarly, experimental data on silicon dioxide (SiO2), titanium dioxide (TiO2) and tantalum pentoxide (Ta2O5) are selected from Ref. Reference Attaf15 to constitute a set of materials that has a wide range of percentage elastic recovery and elastic energy constant. The load-displacement curves for coating and oxides of ceramics mentioned are acquired by using four different peak indentation loads of magnitude less than 10 mN. Finally, experimental data reported in the literatureReference Oliver and Pharr2, Reference Hainsworth, Chandler and Page18, Reference Jayaraman, Hahn, Oliver, Rubin and Bastias24 are also used to validate the proposed method for the evaluation of initial unloading stiffness when the peak indentation load is in excess of 100 mN. Note that the elastic modulus and hardness considered in this study vary in the range 68–440 and 0.20–27 GPa, respectively.
Load-displacement curves obtained in a nanoindentation experiment with a Berkovich indenter for copper at different peak indentation loads.

Reduced modulus and hardness of Al, Cu, Ni, and W measured in this study (Mean ± SD).

IV. RESULTS AND DISCUSSION
A. Determination of nanomechanical quantities
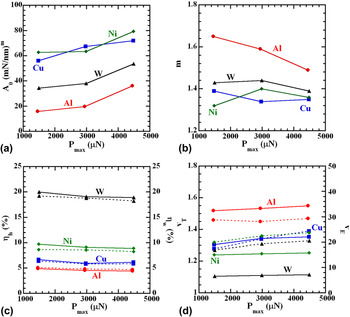
Experimental load-displacement curves are analyzed to determine various nanomechanical quantities such as depth and work elastic recovery ratios, energy constants, contact depth and initial unloading stiffness, as described in Sec. II. Figure 3 shows the variations in power-law parameters, recovery ratios and energy constants with the peak indentation load. It is evident that, unlike power-law parameters, recovery ratios and energy constants remain practically the same with respect to the peak indentation load for all these metals.
Plots showing the variations of (a) power-law coefficient; (b) power-law exponent; (c) elastic depth (dashed lines) and work (solid lines) recoveries; and (d) total (dashed lines) and elastic (solid lines) energy constants with the peak indentation load for aluminum, copper, nickel and tungsten.

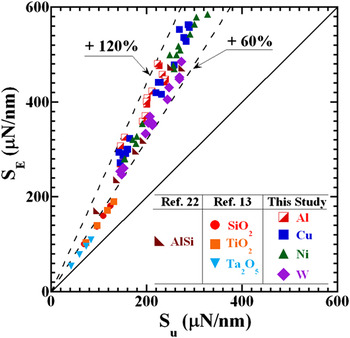
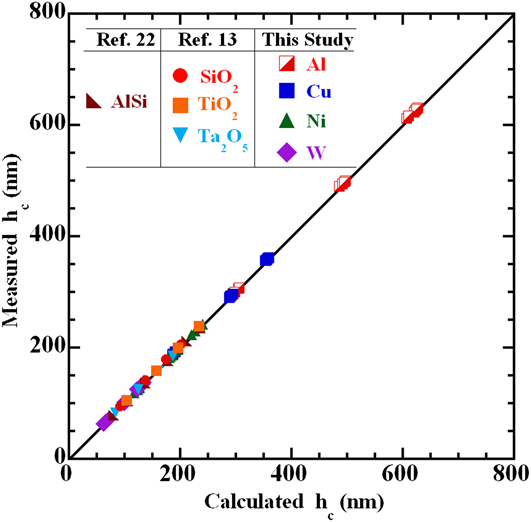
Figure 4 compares initial unloading stiffness determined by Eqs. (2) and (9) for all the materials considered in this study where significantly large deviation in the stiffness values is apparent. As can be seen, the error depends on materials; it is greater for the material that recovers less upon unloading. The average percentage of error for tungsten (W), nickel (Ni), copper (Cu) and aluminum (Al) falls in the range of 60–120%, in which cases Eq. (8) models unloading curves fairly accurately. On the other hand, contact depths determined by Eq. (10) are in close agreement with those obtained experimentally with a relative error better than 5%, as depicted in Fig. 5 for all the materials considered. At this point, a question arises as to why Eq. (9) yields erroneous stiffness while Eq. (10), derived using Eq. (9), predicts reasonable contact depth. This can be explained with reference to Fig. 1. The actual contact depth lies somewhere between hc 1 and hc 2, which corresponds to geometric factor, ε , equal to 1.0 and 0.75, respectively. Point hc 1 is referred to as plastic depth and is determined by extending the tangent to the unloading curve with slope SOP(SE) to the h-axis,Reference Doerner and Nix25 which is exactly followed by Attaf to derive Eq. (10) from Eq. (9). This means that  $h_c^E $ actually is the plastic depth (hc 1), not the contact depth (hc). However, the fact that
 $h_c^E \approx h_c $ and the initial unloading stiffness are always overestimated indicates that the energy-based power function given by Eq. (8) has larger initial curvature as compared with that of the power-law. As a result, the tangent to the unloading power function happens to pass through the actual contact depth, not the plastic depth. Therefore, Eq. (10) should be corrected for the curvature effect to evaluate the contact stiffness accurately.

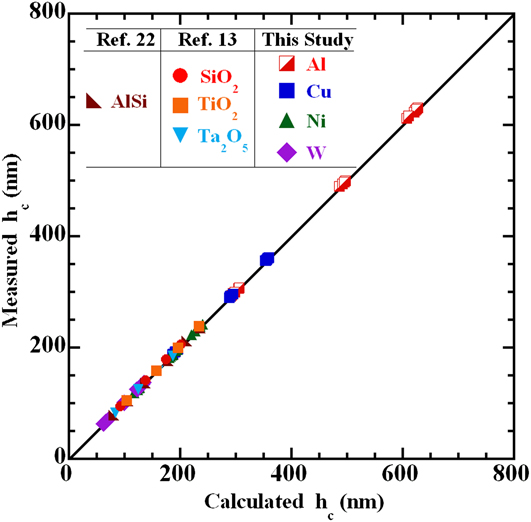
B. Proposed method to evaluate the contact stiffness
In the OP method, as discussed previously, contact depth is evaluated from the initial unloading stiffness. As the contact depth is known as a function of the elastic energy constant in advance, it may be used to evaluate the initial unloading stiffness in a reverse manner. To do this, Eq. (3), by substituting  $h_c = h_c^E $ and replacing SOP by SE, may be rearranged in the following form
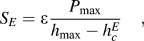 $$S_E = \varepsilon {{P_{\max } } \over {h_{\max } - h_c^E }}\quad,$$
which may also be written in terms of the elastic energy constant as:
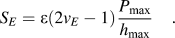 $$S_E = \varepsilon \left( {2v_E - 1} \right){{P_{\max } } \over {h_{\max } }}\quad.$$
It is evident that Eqs. (9) and (12) differ only by a factor ε. Comparison between SE calculated by Eq. (12) with that obtained by Eq. (11), as shown in Fig. 6, indicates that Eq. (12) yields a reasonably accurate value in the case of SiO2 only. Note that SiO2 has the maximum elastic recovery among the materials considered in this study. For the rest of the materials, the error in the initial unloading stiffness is still very large and increases with the decrease in the percentage elastic recovery. For example, the average error in SE determined by Eq. (11) or Eq. (12) is about 58% for aluminum, which has the least percentage elastic recovery in the list of materials considered. Note that the corresponding error in the contact depth  $h_c^E $ is only 0.84%. After careful examination of the data, we found this as an error, which arises due to the proximity between the contact and maximum penetration depths. This can be explained with the help of a numerical example in one of the indentation tests conducted on aluminum in this study, where we found P max = 1497.0 μN, h max = 311.80 nm, hc = 304.7 nm, hcE = 307.30 nm. Using the values of hc and hcE successively in Eq. (11), we found SOP and SE respectively equal 156.6 and 241.2 μN/nm. Clearly, the discrepancy between SOP and SE arises due to a large percentage difference in the denominator of Eq. (11) when evaluated using hc and
 $h_c^E $. For the set of data considered above, the difference between (h max–hc) and
 $\left( {h_{\max } \!- \!h_c^E } \right)$ is about 36%. This error is more pronounced when the h max and hc or hcE values are very close to each other. On the basis of this observation, one may conclude that significantly different initial unloading stiffness values are obtained if the contact and maximum depth of penetration are in close proximity no matter how accurately the contact depth is determined using Eq. (10). This error is insignificant for all those materials whose maximum and contact depths lie considerably apart on the load-displacement curves.
Comparisons of initial unloading stiffness evaluated by Eq. (12) with that obtained by the Oliver and Pharr method.

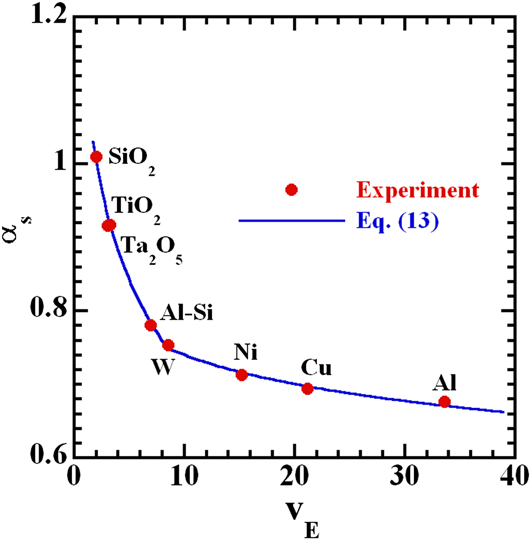
Dependency of this error on the elastic recovery of a material indicates that a correlation between the error due to proximity in the contact and maximum penetration depths and elastic energy may exist. To establish such a correlation, the ratio of stiffness calculated by the OP method to that by Eq. (12) for each material is plotted as a function of their elastic energy constant, as shown in Fig. 7. As can be seen, the ratio decreases as the elastic energy constant increases. The correlation may be fitted with the piecewise logarithmic equations as:
 $$\alpha _s = \left| {\matrix{ {A_1 - B_1 \log \left( {v_E } \right)\quad \quad v_E \,\le \,8.50} \cr {A_2 - B_2 \log \left( {v_E } \right)\quad \quad v_E > 8.50} \cr } } \right.\quad,$$
Piecewise logarithmic representation of stiffness correction factor αs as a function of elastic energy constant.
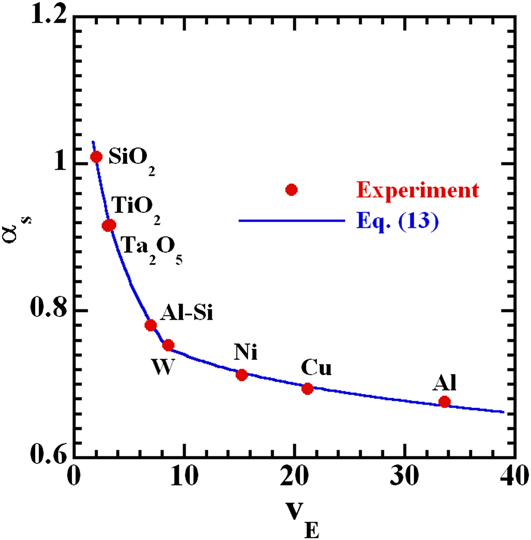
where αs = SOP/SE is termed as the stiffness correction factor, and A 1, A 2, B 1 and B 2 are constants equal to 1.124, 0.873, 0.404 and 0.132, respectively. Thus, a corrected expression for the initial unloading stiffness may be written as:
 $$S_E = \alpha _s \varepsilon \,\left( {2v_E - 1} \right){{P_{\max } } \over {h_{\max } }}\quad.$$
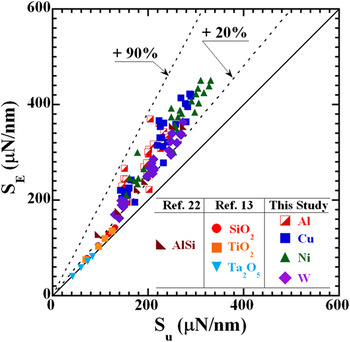
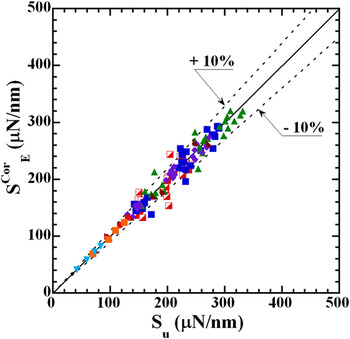
The initial unloading stiffness evaluated from Eq. (14) is once again compared with that obtained by the OP method, as shown in Fig. 8, where excellent agreement could be observed. The proposed method is further validated with the help of nanoindentation data available in the literatureReference Oliver and Pharr2, Reference Hainsworth, Chandler and Page18, Reference Jayaraman, Hahn, Oliver, Rubin and Bastias24; these data were acquired with a peak indentation load equal to or greater than 100 mN. For illustration, we consider the nanomechanical data pertaining to the fused silica mentioned in Ref. Reference Oliver and Pharr2 as P max = 118.43 mN, h max = 1045.0 nm, hf = 540.40 nm, A 0 = 0.050, and m = 1.24. The reduced modulus (Er) and hardness (H) of this material are reported to be 69.60 and 8.40 GPa, respectively. With these input parameters, unloading stiffness is calculated using both the power law and Eq. (14), and are found to be equal to 296.0 and 300.0 μN/nm, respectively, which are very close to each other. This quantity can also be back calculated from the known peak indentation load, reduced elastic modulus and hardness [obtained by substituting P max/H for A c in Eq. (1)].
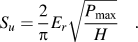 $$S_u = {2 \over \pi }E_r \sqrt {{{P_{\max } } \over H}} \quad.$$
Comparisons of initial unloading stiffness determined by the proposed method (after both the corrections are applied) with that obtained by the Oliver and Pharr method.

Equation (15) yields SOP = 295.0 μN/nm for fused silica, which revalidates the proposed method. Similar calculations for materials like aluminum, quartz, soda lime glass, sapphire, tungsten, copper, 1070 steel and silicon nitride (SiN4) were carried out. Excellent agreement, with accuracy better than 6% between the values evaluated by the two methods, was obtained for each material, as summarized in Table II. This accuracy in the stiffness values also confirms that the stiffness correction factor is independent of the peak indentation load.
Comparison of the initial unloading stiffness calculated using Eq. (14) with that obtained by the Oliver and Pharr method for materials subjected to the peak indentation load in excess of 100 mN.

C. Further simplification
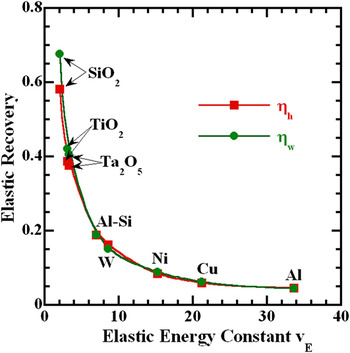
The method described in the previous section to determine initial unloading stiffness can further be simplified by using the relationship between the elastic recovery ratios and elastic energy constant, and the information contained in the loading curve. For this purpose, depth and work recovery ratios are plotted as a function of the elastic energy constant for SiO2, TiO2, Ta2O5, Al-Si, W, Ni, Cu and Al, as shown in Fig. 9. It is clear from the figure that recovery ratios decrease with the increase in the elastic energy constant. This relationship allows us to calculate the elastic energy constant without evaluating the elastic work done. Thus, the determination of initial unloading stiffness requires peak indentation load, maximum depth of penetration and residual depth as input parameters. All of these parameters can be readily obtained from the nanoindentation load displacement curves and thus require less computational effort, as compared with that applied in the conventional OP method. An important point worth mentioning is that the quantities ηh and ηw can differ significantly for harder material as shown in Fig. 9. Nevertheless, nearly same values of the elastic energy constant can be obtained from the graph.
Correlations between elastic energy constant and elastic recovery ratios for all the materials considered in this study.

If SE corresponding to one set of  $P_{{\max } }^1 $ and
 $h_{{\max } }^1 $ is known, then it may be scaled for the other set
 $P_{{\max } }^2 $ and
 $h_{{\max } }^2 $ without analyzing the unloading curve obtained associated with the second set, provided the indentation response is free from any residual stress effect.Reference Suresh and Giannakopoulos26 Such a combination of peak indentation load and maximum depth of penetration may be obtained from Eq. (7) as:
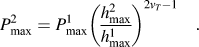 $$P_{\max }^2 = P_{\max }^1 \left( {{{h_{\max }^2 } \over {h_{\max }^1 }}} \right)^{2v_T - 1} \quad.$$
The evaluation of contact stiffness in this way is particularly advantageous when the load-displacement curves from thin films or coating etc. are to be analyzed. While performing nanoindentation on such materials, the maximum penetration depth is carefully selected to minimize the substrate effectReference Tuck, Korsunsky, Bull and Davidson27 on their measured hardness and elastic modulus. The contact stiffness determined at relatively smaller depth by Eq. (14) could be extrapolated at large depth. The discrepancy between the extrapolated and measured contact stiffness can be construed as a measure of the substrate effect. In this way, a critical maximum penetration depth can be ascertained.
The method described evaluates the contact stiffness using the elastic energy constant, which can be used to characterize a material’s response to indentation. Large value of this parameter signifies that the material is plastic and, thus, has clear physical meaning. It can be determined with great certainty and efficiency by evaluating the area under the unloading curve. Alternatively, it may be approximated from the known values of maximum and residual depths of penetration. Due to these reasons, we conclude that the method developed in this study is an attractive alternative to the conventional Oliver and Pharr method.
V. CONCLUSION
In this study, a method to evaluate the initial unloading stiffness (or contact stiffness) from the experimental unloading response is proposed. Direct differentiation of the energy-based power function used to model nanoindentation unloading curve yields erroneous contact stiffness. Further analysis of the experimental data revealed that the error in the stiffness values arises due to a larger curvature associated with this function and proximity between the maximum and contact depths of penetration. The derivative of the power function must, therefore, be multiplied by the geometric and stiffness correction factors to eliminate errors due to curvature and proximity, respectively. The proposed method essentially uses a nondimensional energy-based parameter known as the elastic energy constant, which can be used to characterize the unloading response of a material. The contact stiffness evaluated by this method is found to be in close agreement with that obtained experimentally for a broad class of materials having elastic modulus, hardness and elastic recovery, respectively, in the range 68–440 GPa, 0.20–27 GPa, and 4–60%. The data used for the validation have peak indentation loads in the range 0.15–120 mN. The proposed method actually requires peak indentation load, maximum and residual depths of penetration, which can be readily obtained from the characteristic load-displacement curve.
ACKNOWLEDGMENTS
KKJ gratefully acknowledges the Dissertation Year Fellowship (DYF) from the University Graduate School, Florida International University. AA would like to acknowledge support from the National Science Foundation CAREER Award (NSF-DMI-0547178), the US Air Force Office of Scientific Research Grant (Grant No. FA9550-09-1-0297), and the DURIP Grant (N00014-06-0675) from the Office of Naval Research.