

Introduction
According to the World Development Report, approximately 60% of international trade is comprised of intermediate products and services trade in the global value chains (GVCs) (United Nations Conference on Trade and Development (UNCTAD), 2014). However, with the increasing fragmentation of global production activities, income inequality has become more prominent, both at the international and domestic levels (Li Reference Li2020; Zheng et al Reference Zheng, Zhang and Ma2018). Since its accession to the World Trade Organization, China has actively integrated into the GVCs and become the core of the ‘Asian factory’, but it is also faced with the dual challenges of rapid economic growth and income inequality (Baldwin & Lopez-Gonzalez Reference Baldwin and Lopez-Gonzalez2015).
There has been extensive research in the academic community regarding the impact of international trade and globalisation on income distribution. Despite the belief that global economic integration helps narrow income gaps between different economies, Milanovic’s (Reference Milanovic2009) study suggests that it may exacerbate internal income inequality in certain countries, highlighting the complex effects of GVCs on income distribution within and across economies. At the macro level, research by Egger et al (Reference Egger, Egger and Kreickemeier2013) indicates that participation in GVCs widens income disparities, while Cai et al (Reference Cai, Zhang, Wang and Liu2023) find that a country’s position in GVCs lowers its Gini coefficient. Zhang et al (Reference Zhang and Lin2024) also discovered that higher participation in GVCs intensifies income inequality, whereas higher positions in GVCs help mitigate income inequality, primarily through the deterioration of labour-capital relations and the mechanisms of technological progress. Moving to the industry level, Geng & Hao (Reference Geng and Hao2018) analyse international inter-industry data and find that an industry’s higher position in the GVC reduces internal income disparities among skilled labourers. Wu & Ma (Reference Wu and Ma2018) point out that increased participation in GVCs in China leads to changes in the employment structure of different skilled workers. Carpa & Martínez-Zarzoso (Reference Carpa and Martínez-Zarzoso2022), based on research using the UNCTAD-Eora database (United Nations Conference on Trade and Development-Eora Global Value Chain Database), conclude that greater GVC embedding increases the Gini coefficient, while higher GVC positions reduce industry income inequality. Reshef & Santoni (Reference Reshef and Santoni2023) find that increased forward participation in GVCs decreases labour income differentials from the perspective of GVC embedding direction. Wang et al (Reference Wang, Thangavelu and Lin2021) discussed the wage premium and skill premium in the GVC from the perspective of integration into the GVC. At the micro level, Sheng & Hao (2021) study the impact of enterprise GVC embedding on skill premiums in Chinese enterprises and find a U-shaped relationship between the two.
China’s Gini coefficient has already reached the international warning line of concern, with income inequality issues posing potential threats to social stability and sustainable development. The widening income gap within companies is playing an increasingly significant role in the overall income inequality in Chinese society, contributing to one-third of income distribution inequality and even surpassing that of developed countries like the United States (Luo, Reference Luo2014; Barth et al Reference Barth, Bryson, Davis and Freeman2016; Song et al Reference Song, Price, Guvenen, Bloom and Von Wachter2015). Therefore, while advocating for Chinese enterprises to integrate into the global industrial division of labour and embrace the benefits of global market through high-quality ‘going out’ strategies, the internal income gap within companies and the resulting social inequality issues cannot be ignored. In this context, exploring the impact of GVC embedding on domestic corporate income inequality holds important theoretical and practical significance. Existing literature often focuses on broad measures of income inequality, such as the Gini coefficient and skill premiums (Aghion et al Reference Aghion, Akcigit and Bergeaud2019), which may not effectively reflect the income imbalances between different categories of employees within companies, particularly between top management and regular employees. At the same time, previous studies on executive compensation or corporate pay gaps often discuss their economic effects from an efficiency perspective, with limited research on the causes of internal income inequality within companies. There is a lack of in-depth discussion in existing literature on how GVC embedding affects internal income inequality within companies from a micro perspective, specifically through examining the salary disparities between top management and regular employees. Ohrn (Reference Ohrn2023) suggests that using micro-level enterprise data provides a way to analyse income disparities between the wealthiest and general population, especially in studies of social injustice where income data for the wealthiest individuals is hard to obtain.
In contrast with existing research, this study aims to fill the gap in existing literature by, for the first time, exploring the relationship between a firm’s GVC embedding position and its internal income inequality at the micro-level of enterprises. We establish a theoretical framework that integrates measures of GVC embedding status, firm rent sharing, and internal income inequality, using Chinese listed companies as a case study. We analyse how their position in the GVC shapes the wage income inequality between top management and frontline employees, and investigate the underlying mechanisms and heterogeneity. The theoretical exploration and empirical findings of this paper carry both theoretical value and practical significance, providing micro-level empirical evidence for the internal rent-sharing mechanisms of enterprises under the backdrop of globalisation, as well as offering new insights into the micro-level mechanisms of enterprises achieving high-quality globalisation and participating in the GVC process while considering the goal of inclusive prosperity.
Literature review and theoretical analysis
Rent in the global value chain
Porter (Reference Porter1990) first introduced the concept of the GVC, providing the starting point for the theory of GVCs. This concept broke through the traditional division of labour model in neoclassical trade theory, shifting the focus to the distribution of power, control, value creation, and capture within the global production network. Kaplinsky (Reference Kaplinsky2000) introduced rent theory into the GVC theory to analyse the distribution of benefits among different participants in the GVC structure. Kaplinsky’s research defines rent as the profits or excess profits of each functional link in the GVC. The core concept of rent lies in representing the profits or excess profits of various segments within the GVC, primarily derived from the competitive barriers established by companies around their unique resources. This includes the ‘Schumpeterian rents’ stemming from innovation, the ‘Ricardian rents’ based on unique and scarce resources, and the ‘monopoly rents’ obtained through market dominance, forming a diverse mechanism for rent realisation.
Research indicates that compared to the returns on tangible assets within the GVC, the benefits derived from intangible assets such as computerised information (databases and software), innovative assets (patents, trademarks, and copyrights), and economic capabilities (brand assets and organisational capital) are more significant, constituting the primary source of corporate rents. Schumpeter argues that due to the unique scarcity of innovation, companies will receive returns higher than the cost of innovation over a certain period. Therefore, it can be inferred that the main driving force for companies to pursue rents lies in obtaining Schumpeterian rents, with innovation playing a central role. Concurrently, corporate assets like brands and trademarks contribute significantly to the ‘Ricardian rents’.
Global value chain position, corporate rent and wage income
The position of enterprises in GVC determines their discourse power in profit distribution, and high-positioned enterprises often obtain more profits and rent. Through mechanisms such as power distribution, technological monopoly, and brand premium, high-status enterprises can enhance their bargaining power over low-status enterprises, which may exacerbate income inequality between and within enterprises.
Assuming that the export technology complexity of a certain export product (the GVC embedding position of the enterprise can be measured by the sum of the technology complexity of all export products within the enterprise) conforms to the Cobb Douglas production function, which depends on the distribution of power, technology, and brand value of the product in the value chain. The function is shown in formula (1):
 $$P{\rm{o = A(I,T,B)}} \times {{\rm{I}}^\alpha } \times {T^\beta } \times {B^\gamma }$$
Among them, Po represents the complexity of export technology for a certain product, A (I, T, B) represents the quality or value of the product (generally speaking, the more advanced the production technology, the higher the product quality), I, T, and B, respectively, represent the power distribution, technology, and brand value required for producing the product, and a, β, and γ, respectively, represent the output elasticity of power distribution factors, technical labour factors, and brand factors.
According to the definition of rent, we can conclude that the main driving force for enterprises to obtain rent is the Schumpeterian rent, with innovation playing a major role in it; and the rent from Ricardo brought by corporate brands, trademarks, and the like. Schumpeter believed that innovation has a unique scarcity during a certain period of time, which will create innovation benefits that are greater than the cost of innovation for enterprises. Embedding enterprises into the GVC will greatly improve their labour productivity through innovation, thereby affecting the rent that enterprises can obtain in the GVC. At the same time, the market power brought by brand values such as trademarks is also an important source of rent. Research has shown that the returns obtained from intangible assets such as computerised information (such as databases and software), innovative assets (such as patents, trademarks, and copyrights), and economic capabilities (such as brand assets and organisational capital) are much greater than those obtained from tangible assets in the GVC of manufacturing products, and are important sources of rent for businesses.
Assuming that management makes the main contribution to brand premium and ordinary employees make the main contribution to technological elements, the marginal production impacts of management and ordinary employees in the value chain are shown in formulas (2) and (3), respectively:
 $$\eqalign{ {{Po} \over {\partial B}}& = {1 \over {\partial B}}A \times {I^\alpha } \times {T^\beta } \times {B^\gamma } + \gamma *A({\sf I,T,B}) \times {{\sf I}^\alpha } \times {T^\beta } \times {B^{\gamma - 1}} \cr & = {1 \over {\partial B}}*{{Po} \over {A(\sf I,T,B)}} + \gamma *{{Po} \over B} \cr} $$
 $$\eqalign{ {{Po} \over {\partial T}} & = {1 \over {\partial T}}A \times {I^\alpha } \times {T^\beta } \times {B^\gamma } + \beta *A(\sf I,T,B) \times {{\sf I}^\alpha } \times {T^{\beta - 1}} \times {B^\gamma } \cr & = {1 \over {\partial T}}*{{Po} \over {A({\sf I,T,B})}} + \beta *{{Po} \over T} \cr} $$
Assuming intangible assets (such as patents, brands, technology, etc.) are an important source of GVC rent for enterprises, and high-status enterprises are better able to effectively utilise these rents. Let the enterprise rent function be:
 $$R = g\left( {\rm E,PM} \right)$$
Among them, E is the value of intangible assets owned by the enterprise, PM is the indicator of the enterprise’s position (or power) in GVC, and R is the first-order function of PM. Considering the mechanism of rent misappropriation, a model can be constructed to analyse how PM affects the allocation of rent R. At this point, the rent obtained by the enterprise in the GVC is Rfirm,
 $${R_{firm}} = \theta \left( {Po} \right) \cdot R$$
Aizenman et al (2012) proposed that international trade activities between countries will ultimately give rental income to industries or enterprises with strong competitiveness in the global market, while those with weaker competitiveness will be punished by the market. In addition, Autor et al (Reference Autor, Dorn, Katz, Patterson and Van Reenen2017) and Grullon et al (Reference Grullon, Larkin and Michaely2019) revealed a common phenomenon from empirical surveys at both industry and corporate levels: a few ‘top enterprises’ stand out in each industry, forming a pyramid structure where a few large enterprises dominate the market and accumulate a large amount of rent. We can infer that companies located at the top of the GVC will be able to create value more effectively and earn higher rents through market dominance, technological innovation, and brand attractiveness.
Among them, R is the total rent generated by the GVC system. Rfirm represents the portion of rent that a company receives from GVC.
θ(Po) represents the rent misappropriation function of the enterprise’s position Po in GVC, and assuming θ(P)>0, that is, as the enterprise’s position in GVC increases, the proportion of rent it can misappropriate also increases. Po represents the GVC position indicator represented by the total complexity of export technology for all products of the enterprise. It is a comprehensive indicator that includes multiple dimensions such as technological innovation capability, brand influence, and market control.
As Po increases, θ (Po) also increases, leading to an increase in Rfire. This shows that in GVC, high-positioned enterprises with their stronger bargaining power and control over key resources can more effectively misappropriate the rent generated by intangible assets. Specifically, employees have the opportunity to share the economic rent created by intangible assets such as company patents (Zhang Kezhong 2021), and this sharing mechanism is mainly reflected in the increase of average employee wages (Zhang Chen et al Reference Chen, Xiangyu and Xiaoman2023). On the one hand, due to the existence of agency problems, there may be conflicts of interest between corporate executives and major shareholders, and executives have the motivation to maximise their own interests. At the same time, principals may also choose to link executive compensation to corporate performance to alleviate agency problems (Jensen Meckling Reference Jensen and Meckling1976). On the other hand, increasing salaries is also an important means of motivating employees, which is beneficial for companies to create higher profits in the future (Chen Donghua et al Reference Donghua, Conglai and Yongjian2015). Therefore, when a company embeds into the GVC to improve its performance, employees will share in the company’s rent.
However, the distribution of rent in this way is uneven in its impact on management and employees. When a company is represented by the position Po in the GVC of a certain product, and PM approximates Po, then equation (6) yields:
 $$R_{firm} = \theta \left( {Po} \right) \cdot R\left( {Po} \right)$$
So, in terms of the impact on management and ordinary employees, we can obtain:
 $$\small{\eqalign{ {{\partial {R_{{\rm{firm}}}}} \over {\partial B}} & = \theta \cdot R({P_O})*\left[{1 \over {\partial B}}{{{P_O}} \over {A(I,T,B)}} + \gamma * {{{P_O}} \over B}\right] + \theta ({P_O}) * {{\partial R({P_O})} \over {\partial B}} * \left[{1 \over {\partial B}}{{{P_O}} \over {A(I,T,B)}} + \gamma * {{{P_O}} \over B}\right] \cr & = \theta (R({P_O}) + {P_O})*\left[{1 \over {\partial B}}{{{P_O}} \over {A(I,T,B)}} + \gamma * {{{P_O}} \over B}\right] \cr}}$$
 $$\small{\eqalign{ {{\partial {R_{{\rm{firm}}}}} \over {\partial T}} & = \theta \cdot R({P_O})*\left[{1 \over {\partial T}}{{{P_O}} \over {A(I,T,B)}} + \gamma * {{{P_O}} \over T}\right] + \theta ({P_O}) * {{\partial R({P_O})} \over {\partial T}} * \left[{1 \over {\partial T}}{{{P_O}} \over {A(I,T,B)}} + \gamma * {{{P_O}} \over T}\right] \cr & = \theta (R({P_O}) + {P_O})*\left[{1 \over {\partial T}}{{{P_O}} \over {A(I,T,B)}} + \gamma * {{{P_O}} \over T}\right] \cr}} $$
 $$\small{\eqalign{ {{\partial {R_{{\rm{firm}}}}} \over {\partial B}} - {{\partial {R_{{\rm{firm}}}}} \over {\partial T}} & = \theta (R({P_O}) + {P_O})*\left[{1 \over {\partial B}}{{{P_O}} \over {A(I,T,B)}} + \gamma * {{{P_O}} \over B}\right] - \theta (R({P_O}) + {P_O})*\left[{1 \over {\partial T}}{{{P_O}} \over {A(I,T,B)}} + \beta * {{{P_O}} \over T}\right] \cr & = \theta (R({P_O}) + {P_O}) * {P_O}*\left[{1 \over {\partial B}}{{{P_O}} \over {A(I,T,B)}} + \gamma * {1 \over B} - {1 \over {\partial T}}{{{P_O}} \over {A(I,T,B)}} - \gamma * {1 \over T}\right] \cr & = \theta (R({P_O}) + {P_O}) * {P_O}\left[{1 \over {A(I,T,B)}}({1 \over {\partial B}} - {1 \over {\partial T}}) + ({\gamma \over B} - {\beta \over T})\right] \cr}} $$
From the above equation, it can be seen that the impact of corporate rent misappropriation on income inequality depends not only on the difference between the reciprocal of the marginal production capacity of brand elements and the reciprocal of the marginal production capacity of technology but also on the ratio of brand elasticity coefficient to brand elements and the ratio of technology elasticity coefficient to technology elements. When both of the above are greater than the latter, the impact of misappropriating rent on income inequality is widening, and vice versa.
From a deeper perspective, when the influence of management on brand elements is greater than that of ordinary employees on technical elements, it widens the salary gap, and vice versa narrows the salary gap. Although the productivity improvement brought by the embedding of GVCs and the economies of scale of globalisation are conducive to increasing the rent-sharing scale between enterprises and employees, the significant differences in rent-sharing between management and ordinary employees may further affect internal income inequality. Due to the differences in bargaining power among different types of employees, the distribution of total income generated by productivity growth in enterprises is uneven between executives and ordinary employees. Usually, compared to ordinary employees, executives have relatively less supply elasticity in the labour market and therefore have stronger bargaining power. Because of the large and rapidly mobile labour force in China, ordinary employees face a highly competitive labour market. In contrast, the current development time of China’s market economy has been relatively brief, and not surprisingly the number of senior professional managers is still relatively small; often the executives of state-owned enterprises adopt an appointment system, lacking market mobility, resulting in ordinary employees facing higher labour market supply elasticity and higher substitutability than management (Xiaomei et al Reference Xiaomei, Qihui and Liansheng2016). Research has shown that employees of different categories have varying bargaining power and share in company rent, which may lead to widening income inequality within the company (Fuest et al Reference Fuest, Peichl and Siegloch2018; Kline et al., Reference Kline, Petkova and Williams2019; Saez et al Reference Saez, Schoefer and Seim2019). Compared to labour remuneration, the distribution of profits or rent is more unequal, which means that the income gap between people will further increase. The inequality of internal income within enterprises expands with the increase of enterprise rent.
As the above equation indicates, as the position of embedding in the GVC increases, the rent-sharing effect of enterprises makes them allocate more to management, and the brand benefit is mainly the premium effect of brand elasticity γ.
However, at the same time, the improvement of the embedded position in the GVC may be achieved through learning and competition effects, adjusting the structure of human capital, increasing the proportion of high-skilled labour within the company, and promoting an overall increase in employee compensation levels. On the one hand, the GVC may enhance the productivity of enterprises, promote cost savings, verticalisation of tasks, and digitisation through economies of scale and learning effects, resulting in production technology upgrades and increased investment in high-quality digital talents, prompting enterprises to increase the proportion and salary level of such positions. On the other hand, technological changes greatly reduce the demand for simple and repetitive labour positions, thereby reducing the proportion and salary level of such employees. Ultimately, the overall salary level of employees tends to rise, and the salary gap between executives and employees tends to narrow. According to the above equation, as the GVC status Po increases, the wages of ordinary employees, especially high-skilled workers, increase, narrowing the wage gap with executives. The optimisation of human capital structure has a negative moderating effect on the causal relationship between the two.
Recent research has revealed the existence of rent distribution mechanisms within companies. As elucidated by Pissarides (Reference Pissarides2009) in the standard labour market frictions model, the mismatch between enterprises and employees leads to friction in the process of companies seeking suitable individuals to fill job vacancies, resulting in additional profits earned by companies in the market having to be shared with employees. This rent distribution mechanism implies that companies provide employees with a system arrangement of compensation exceeding standard wages based on their performance in the market. In other words, the benefits and excess profits obtained at various stages of the GVC are distributed between top-level managers and frontline employees within the company. Therefore, as long as there is a labour relationship between companies and employees, employees may share the additional profits obtained by the company in the product market through this rent distribution mechanism.
So, is the distribution of higher rents between executives and regular employees equal within companies? Will it exacerbate or reduce the wage-income gap within the company?
The distribution of corporate rent between executives and ordinary employees
The mechanism of employees sharing company rents is influenced by various factors. Firstly, due to agency problems, there may be conflicts of interest between the management and shareholders within companies: the tendency of managers to pursue personal interests may not fully align with the interests of shareholders. To address this challenge, according to Jensen and Meckling’s (Reference Jensen and Meckling1976) innovative compensation structure, shareholders typically link management’s compensation to company performance, aligning the interests of management and shareholders.
The effective wage theory and tournament theory support the use of increased compensation to motivate employees, which can not only address potential inefficiencies among employees but also promote better company operations, leading to higher future returns (Chen, D. et al 2015). Research by Zhang et al (2023) demonstrates the existence of a rent-sharing development relationship between companies and employees. With the improvement in company performance resulting from the elevation of their position in the GVC, both executives and regular employees have the opportunity to share the company rent generated as a result.
However, due to heterogeneity in salary negotiation abilities, the proportion of different types of employees sharing company rents is not the same, which may exacerbate income inequality within companies (Kline et al., Reference Kline, Petkova and Williams2019; Saez et al Reference Saez, Schoefer and Seim2019). Specifically, although participating in the GVC can improve employment and wages in developing countries (Haskel 2000), the significant gap in rent sharing between management and ordinary employees may increase internal income inequality. In the labour market, due to the scarcity of senior management personnel and the unique nature of the Chinese labour market, such as the widespread appointment system and competition in the context of a rapidly moving workforce, executives may have an advantage in rent sharing (Han Xiaomei et al 2016). Research has shown that differences in bargaining power among employees directly affect their degree of sharing of company rent, leading to an exacerbation of internal income inequality within the company (Kline et al., Reference Kline, Petkova and Williams2019; Saez et al Reference Saez, Schoefer and Seim2019). Ultimately, the distribution of rent tends to be more unequal, leading to a widening income gap, and resulting in a negative correlation between corporate rent and internal income inequality.
The ultimate result may be that, compared to wages, the distribution of rent tends to be more unequal, leading to an expansion of income disparities, and creating a negative correlation between company rents and internal income inequality. Therefore, as the economic rent that management can share is higher than that of regular employees, the elevation of their position in the GVC may have a positive impact on the wage gap between the two.
Based on the above, we propose the following hypotheses in this study:
H1: The position of a company in the GVC will widen income inequality within the company.
H2: The position of a company in the GVC affects internal income inequality through the rent-sharing effect.
However, as a company elevates its position in the GVC, it may enhance productivity through learning and competitive effects, drive cost reduction through task verticalisation and digitisation, and upgrade production technology, leading to increased investment in high-quality talent by the company. This prompts the company to increase the proportion and salary levels of such positions, adjust its human capital structure, and raise the proportion of high-skilled labour within the company. On the other hand, technological advancements significantly reduce the demand for simple repetitive labour positions, resulting in a decrease in the proportion and salary levels of such employees. Ultimately, the overall salary levels of employees tend to rise, and the salary gap between executives and employees tends to shrink. Based on the above analysis, we propose the following hypothesis:
H3: In the GVC, the impact of a company’s position on internal wage income inequality is moderated by the level of employees’ human capital.
Data and methodology data
This study utilises microdata from Chinese listed companies, matching data from various sources including financial, micro-governance of listed companies, Chinese macroeconomic statistics, and customs import and export data. The processing of the listed company data in this study includes the following steps: (1) exclusion of financial and insurance companies, companies subject to special treatments like ST, *ST, companies undergoing PT or delisting, and companies with missing key variables; (2) removal of companies with fewer than 100 employees, as these companies may have operational abnormalities or data disclosure errors; (3) excluding companies where the average management salary is lower than the average employee salary, as the disclosed executive compensation in such companies may only consist of allowances or be erroneous; (6) elimination of samples with missing key variables. Additionally, all continuous variables are winsorised at the 1st and 99th percentile levels to address outliers. Based on data availability, a total of 12942 valid samples from 2000 to 2016 were obtained. It is necessary to clarify that the sample interval is based on the availability of customs data. At the same time, the distributional effects of changes in GVC embedding status of enterprises depend on the evolution of comparative advantages of Chinese enterprises and do not rely on the timeliness of data. It is sufficient to draw conclusions that align with the comparative advantages and their changing trends within the study interval.
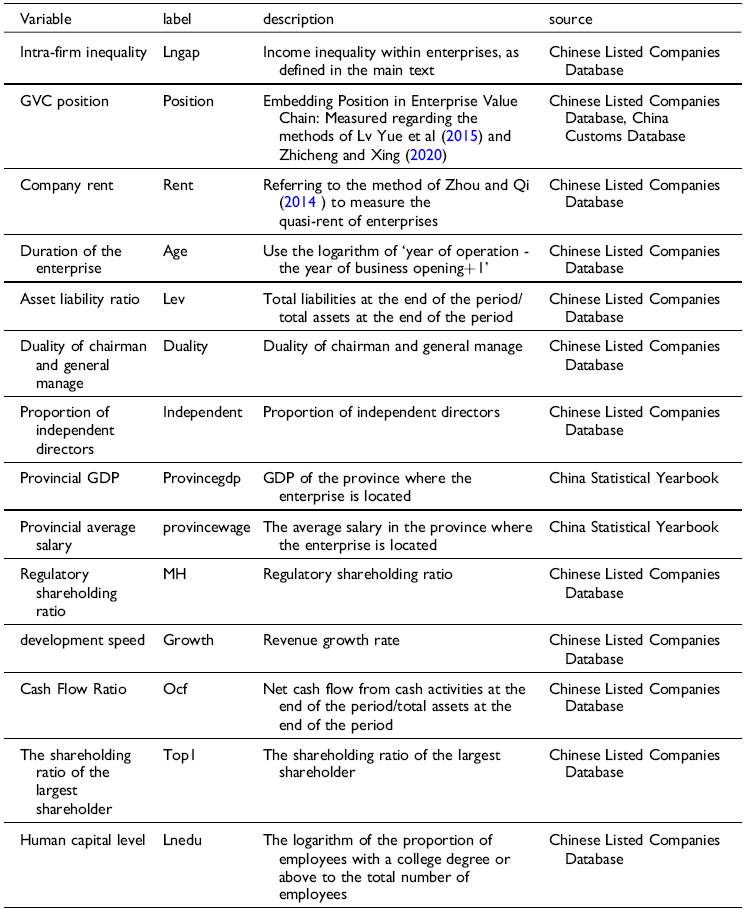
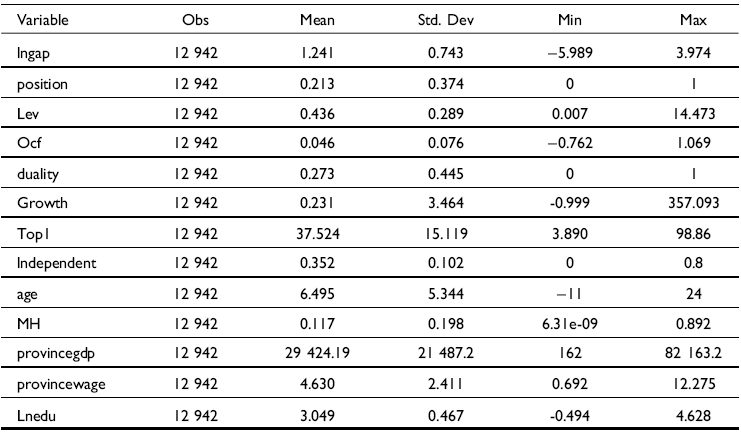
The specific meanings and sources of the main variables in this study are detailed in Table 1, and the descriptive statistical results are provided in Table 2.
Data description and sources
Descriptive statistics
Variable selection and definition
Dependent variable
Internal income inequality within companies: To analyse income inequality within companies, the ideal approach would be to obtain salary information for all employees. However, data limitations often make this task impractical. Following the studies of Kline et al (Reference Kline, Petkova and Williams2019) and Kezhong et al (Reference Kezhong, Fan and Yongying2021), this paper measures the uneven internal income distribution within companies by examining wage disparities between different categories of employees. Specifically, this study utilises the wage gap between management and frontline employees as a proxy indicator of internal income inequality within companies, represented by the ratio of average management wage to average employee wage. The average management wage is calculated by dividing the total annual remuneration of directors, supervisors, and senior management by the number of individuals in this group. The average wage of regular employees is determined by subtracting the annual salary of management from the total employee wages and then dividing it by the total number of regular employees. This measurement approach provides a means to analyse income disparities between the wealthiest and general populations (Ohrn 2019), particularly in studies of social inequality where data on the income of the wealthiest individuals are challenging to obtain. Kezhong et al (Reference Kezhong, Fan and Yongying2021) also believe that it is reasonable to use the wage gap between management and ordinary employees to measure internal income inequality within a company under existing data conditions.
Main independent variable
GVCEmbedding Position: When measuring the embedding position of enterprises in the GVC, this study relies on the import and export database of Chinese customs and the database of Chinese listed companies.
The research on GVCs at the national and industry levels is relatively mature, but the expansion of GVC research to the enterprise level is still in its infancy, and GVC participation is ultimately a phenomenon at the enterprise level. Because traditional methods such as HIY (Hummels et al., Reference Hummels, Ishii and Yi2001) and KWW (Koopman et al., Reference Koopman, Wang and Wei2014) are based on input-output tables to measure the GVC positioning GVC index, they are not applicable at the level of micro heterogeneous enterprises. The scholars who first proposed the micro-level GVC participation measurement method were Upward et al (2013). They further subdivided trade types into processing trade and general trade based on the macro-level approach proposed by Hummels et al (Reference Hummels, Ishii and Yi2001). On the basis of KWW method, they used micro-matching data between Chinese customs and industrial enterprises to depict the foreign-added value of Chinese export enterprises. The methodology posits that enterprises allocate their imported goods as intermediate inputs under distinct trade regimes: processing trade imports are exclusively dedicated to export production, whereas general trade imports are partitioned between domestic sales and exports based on a predefined ratio. This operational distinction underpins the calculation framework for the foreign value-added ratio (FVAR). Based on this, other types of improved measurement methods were derived.
Lv et al (Reference Lv, Luo and Liu2015), Zhang Xing (2020), and others have further improved the measurement of indicators based on this measurement method. Because the previous calculation method implies that the imported products of the enterprise are entirely used for reproduction, that is, all imported products are intermediate products. This assumption is more reasonable in the import of processed trade products, while in general trade imports, in fact, some imported products are directly sold as final products to the Chinese market, rather than being input into the production process. Therefore, the second calculation method, based on the first calculation, identifies the share of consumer goods and capital goods in imported products according to the correspondence between Broad Economic Categories (BEC) codes and HS codes, and removes them to obtain the import of general trade intermediate products, and re-measures FVAR. In addition, they also discussed FVAR calculation under the consideration of intermediary trade agents, so each evolution of calculation method is a modification and improvement of the previous calculation method. In order to ensure the completeness and academic authority of the indicator measurement in the existing research background, this article refers to the measurement methods of Lv et al (Reference Lv, Luo and Liu2015) and Zhang Xing (2020) to measure the degree of enterprise GVC integration.
Specifically, this article adopts the measurement method of Lv et al (Reference Lv, Luo and Liu2015) and Zhicheng and Xing (Reference Zhicheng and Xing2020) for the position of enterprise GVC. The detailed calculation method is as follows: (1) First determine the actual amount of intermediate products imported by the company. Initially, companies containing terms such as ‘import and export’, ‘foreign trade’, ‘technology trade’, or ‘foreign economy’ are identified as intermediaries in trade. Next, the percentage of accumulated import amounts via intermediary traders in specific goods is determined as a portion of the company’s total import volume. Finally, the categorisation of general trade and processing trade is used to infer the actual amount of intermediate product imports by the company. Specifically, estimates are made for the actual amounts of intermediate product imports by the company in general trade (MoAm) and processing trade (MPA). (2) The aforementioned indicators, together with the company’s domestic sales and actual general trade export amounts, can allow calculation of the company’s foreign product value-added ratio, FVAR. (3) Utilising non-competitive input-output tables, divide the output into a domestic value-added ratio (DVAR) and FVAR. The sum of domestic and foreign value-added ratios equals one. We can finally obtain the position of enterprises in the GVCs, the specific measurement formula is as follows:
 $$GVC = \ln \left( {1 + DVAR} \right) - \ln \left( {1 + FVAR} \right)$$
Among them, FVAR is the degree of embedding in the GVC of enterprises, and the specific measurement formula is as follows:
 $$FVAR = {{{V_{AF}}} \over X} = {{M_A^P + M_{Am}^o \cdot [{X^o}/(D + X_{}^o)] + 0.05({M^T} - M_A^P - M_{Am}^o)} \over X}$$
The sum of the foreign value-added rate and the foreign value-added rate of exported products is 1, DVAR=1-FVAR. Therefore, we substitute FVAR and DVAR into equation (10) to obtain GVC, which is the indicator of the embedded position of enterprises in the GVCs.
Mediating variable
Economic Rent of Enterprises: Following the research of Wei et al (Reference Koopman, Wang and Wei2014), economic rent is defined as the difference between the per capita sales revenue of an enterprise and the industry’s average wage. This difference measures the excess profit of the enterprise, reflecting the company’s payment capacity. Economic rent measures the profit that the current sales revenue of the enterprise can generate under the assumption that the company’s production costs are equal to the industry’s average level. Therefore, there is a significant positive correlation between economic rent and the actual rent level of the enterprise, avoiding a negative relationship between the company’s real costs and rent, thus mitigating direct endogeneity issues. Existing literature commonly uses economic rent as a proxy variable to measure the level of enterprise rent.
Moderating variable
The moderating variable is the level of human capital in the enterprise. Human capital is generally measured by the educational level of employees, and the structure of human capital in a company can be characterised by the proportion of employees at different educational levels. Specifically, we use the proportion of employees with a college education or above as a representative indicator of the level of human capital in the enterprise.
Control variables
Drawing from the research methodology of Lei et al (Reference Lei and Zaoyun2023), we select a series of control variables to eliminate the potential impact of these factors on internal income inequality within companies. Company Age (AGE): We calculate the logarithm of ‘the current year minus the year of establishment of the company plus one’ to capture the length of time the company has been in operation; Company Size: Quantified by the natural logarithm of the total sales revenue of the company; Capital Intensity: Represented by the ratio of capital to labour in the company. Additionally, other control variables include Return on Equity, the proportion of ownership by the top ten shareholders, and a dummy variable indicating the combination of the roles of chairman and general manager. To eliminate the influence of industry competitiveness, this study further incorporates the Herfindahl-Hirschman Index as a control variable.
Methodology
Based on the theoretical foundation of the previous text, we construct the following econometric model to empirically test the impact of GVC position on income inequality within enterprises:
 $$I{\rm{nequality}}_{i,t} = \alpha 0\ln position_{i,t} + \alpha 1{\rm{c}}ontrol_{i,t} + year_{i,t} + code_{i,t} + \varepsilon_{i,t}$$
In the aforementioned model, lnequality represents internal income inequality within companies and serves as the dependent variable of the econometric model, while lnposition signifies the GVC position of the company, which is the main explanatory variable of interest in this study. The subscripts i and t represent the company and year, respectively, and control denotes a series of control variables. Year and code represent year and industry fixed effects, respectively. The focus of this study is on the coefficient of the GVC position in the model, which depicts the impact of enhancing the GVC position on internal income inequality within companies.
Empirical result analysis
Benchmark estimation results
To determine the regression model, this study first conducted a Hausman test on the data. The test results indicated a p-value of 0.0000, rejecting the null hypothesis of the random effects model at the 1% significance level. Therefore, we utilised a fixed effects model for the regression analysis.
The focus of this empirical study is whether there is a positive causal relationship between a company’s GVC embedding position and income inequality within the company. If there is a causal relationship, the coefficient of the GVC embedding position variable should be significantly positive. The empirical results are shown in Table 3. In the first column of the ordinary least squares (OLS) regression, we regressed only the core explanatory variable, enterprise GVC position, on the indicator of internal wage income inequality. The results show that the coefficient of position was significantly positive at the 1% significance level. This implies that an increase in the GVC position will widen the wage income inequality within the company. As the company’s position in the GVC improves, internal wage income inequality expands. In columns (2)–(4), individual, time, industry, and province fixed effects are included. In each case, the coefficient of lnposition is found to be significantly positive. Specifically, according to the results in column (4), it can be seen that when a company’s GVC embedding position increases by 1%, the wage gap between executives and ordinary employees within the company will widen by 5.15%. Therefore, it can be concluded that the GVC position of Chinese listed companies has a positive impact on the income inequality between executives and ordinary employees within the company, confirming our hypothesis 1.
Regarding the other control variables, variables such as the asset-liability ratio, cash flow ratio, growth rate, and Gross Domestic Product (GDP) of the province where the company is located all exhibit significant positive effects on internal income inequality within companies. In contrast, variables such as the combining of chairman and general manager roles, the ownership proportion of the largest shareholder, and management ownership proportion show significant negative effects on internal income inequality. The age of the company variable does not have a significant impact on internal income inequality within companies. The regression results of the above control variables are basically consistent with the research of Li and Wang (Reference Li and Wang2023).
Robustness analysis
Utilising a higher dimension of fixed effects
In the benchmark regression analysis, column (1) first includes all control variables and uses OLS for regression; The second column includes individual fixed effects on this basis, while the third and fourth columns further control for industry and province fixed effects. The reason for choosing to gradually increase these controls for high-dimensional fixed effects regression in empirical analysis is mainly based on the characteristics and research needs of panel data of listed companies. We gradually increased the fixed effects of provinces, years, industries, and enterprises in empirical regression. To some extent, this extended control can address endogeneity issues arising from omitted variables, such as potential omissions of policy support from central or provincial governments and industry-specific foreign trade shocks. It can be seen that regardless of the fixed effects used, the coefficients of the explanatory variables in the regression results are significantly positive, indicating that the benchmark regression results in this article are robust. This enhances the robustness of the study’s findings.
Changing the measurement method of the original indicators
For the measurement indicators of the GVC position of enterprises, we draw on the approach of Sheng and Wang (Reference Sheng and Wang2022), using Export Value Added Rate (DVAR) to measure; we also draw on the approach of Ma et al. (Reference Ma, Ren and Wu2016), using Export Technology Sophistication (ETS) to measure. The regression results are shown in the first and second columns of the following table. To assess internal income inequality within companies, we replaced the measure of average managerial salary with various new metrics to quantify income disparities. These new measures include ‘gap: internal income inequality within companies without taking logarithms’, ‘lnwfi: the ratio of the logarithm of average managerial salary to average employee salary’, and ‘Kagap: The salary gap between executives and employees exists within the same company, as well as between management and employees within the same industry’. Therefore, this article refers to Kulik and Ambrose’s (1992) method of measuring salary inequality and constructs a replacement variable for income inequality within the enterprise The specific measurement method is as follows:
 $$KAGAP = {{MPP} \over {EPP}}*IPG$$
 $$MPP = {{AMP} \over {(I{\rm{ndustry}} - year)median\,of\,AMP}}$$
 $$EPP = {{AEP} \over {(I{\rm{ndustry}} - year)median\,of\,AEP}}$$
 $$IPG = {{(Industry - year)median \,of\, AMP} \over {(Industry - year)median \,of\, AEP}}$$
In the above equation, MPP represents the management compensation premium, which is expressed by dividing the average management payment (AMP) by the annual median of the same industry, as shown in equation (14); EPP represents the premium of ordinary employee salaries, which is also expressed as the ratio of ordinary employee salaries to the annual median of the same industry. It reflects the comparison of ordinary employee salaries between companies in the same industry, as shown in equation (15). IPG stands for industry pay gap, which is the ratio of the median average salary of management in the same industry to the median average salary of ordinary employees. The regression results of replacing the above three indicators of income inequality within enterprises in the model are shown in Table 4.
GVC position and income inequality within enterprises

Robust standard errors are in parentheses.***p < 0.01,**p < 0.05,*p < 0.1.
Replacing the dependent variable

Robust standard errors are in parentheses.***p < 0.01,**p < 0.05,*p < 0.1.
The results shown in Table 4 are the estimated results after replacing the measurement method of GVC embedding position (columns 1 and 2) and replacing the indicator of income inequality within the enterprise (columns 3 to 5). Each column is controlled for time, industry, and individual, and high-dimensional fixed effects of industry and year, province and year interaction terms are added. The empirical results show that the coefficient of GVC embedding position is significant at least at the 5% level, and the sign and benchmark regression are consistent, indicating that the impact of enterprise GVC embedding position on income inequality within the enterprise is positive, that is, the improvement of enterprise GVC position will expand income inequality within the enterprise. The substitution of variables did not alter the fundamental conclusions of this study.
Endogeneity testing
We have controlled for unobserved individual, time, industry, province-specific characteristics, and other variables that may be related to internal income inequality within companies through high-dimensional fixed effects. However, there may still be alternative explanations for the relationship between GVC position and internal income inequality. We employ the widely recognised Bartik instrument variables constructed using the share shift method for IV estimation to address endogeneity issues. Specifically, we refer to the approach proposed by Kui et al (Reference Kui, Qingsong and Wei2021) for constructing Bartik instrument variables.
Bartik instrument variables are obtained by taking the cross-product of the initial state and exogenous industry national growth rate. After appropriately controlling for city, industry, and year-fixed effects, this variable is not correlated with the residual terms that influence income disparities within companies. As a result, Bartik instrument variables can effectively address endogeneity issues arising from omitted variables or reverse causality, yielding consistent estimation results. By multiplying a company’s initial status in the GVC by the exogenous industry-level GVC growth rate (Gj), we calculate the Bartik instrument variable for the GVC position.
If company i in industry j in year t has a GVC position of y, and G represents the growth rate of the industry j’s GVC position level relative to the initial year t0, the Bartik instrument variable for the company’s GVC position is as follows:
 $$\ln position\_iv_{ijt} = \sum\nolimits_{{j^\prime} \in jN} \ln position_{ij't0} \times (1 + G_{j't})$$
The regression results using the Bartik instrumental variable method are shown in Table 5. After adding high-dimensional fixed effects and replacing the dependent variable, the coefficients of the instrumental variable are at least significant at the 5% level, consistent with the benchmark regression, indicating that our conclusion is robust.
Regression results of Bartik instrumental variable method
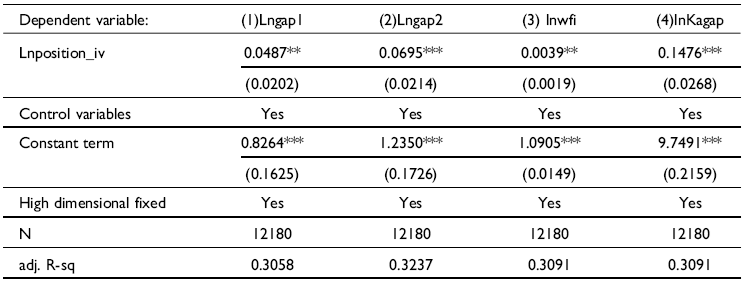
Robust standard errors are in parentheses.***p < 0.01,**p < 0.05,*p < 0.1.
At the same time, we can see that the impact of explanatory variables on the dependent variable in instrumental variable regression is smaller than estimated in benchmark regression. This may be because benchmark regression overestimates this relationship, possibly due to overlooked reverse causality or other endogenous sources of influence. Benchmark fixed effects regression may have some endogeneity issues. When using the instrumental variable method, introducing an instrumental variable that is related to the explanatory variable but not to the error term can more accurately isolate the causal effect of the explanatory variable on the dependent variable, thereby correcting the bias caused by endogeneity. Therefore, the instrumental variable method corrects for bias in benchmark regression by providing more reliable causal estimates, and the coefficient changes in the results reflect this, helping to reveal more accurate causal relationships between variables.
Heterogeneity analysis
Profit distribution methods of enterprises
The income disparity among employees in enterprises is closely related to the profit distribution methods. Non-state-owned enterprises have profit maximisation as their direct goal, while state-owned enterprises, in addition to pursuing profits, also bear significant policy tasks related to national strategic planning and societal stability. There are significant differences in profit distribution methods between the two types of enterprises (Lin et al 2004). Compared to private enterprises, state-owned enterprises are influenced by factors such as administrative intervention, overall regulation, and corporate culture in their compensation systems, leading to lower levels of marketisation and constraints on the salary growth of senior executives. Moreover, the primary objective function of state-owned enterprises is government and public interests rather than their profits, resulting in a relatively lower sensitivity to the GVC position. Finally, employees in state-owned enterprises may have higher bargaining power compared to those in private enterprises. On one hand, the management structure of state-owned enterprises resembles government agencies, with most employees having a position in the establishment. On the other hand, private enterprises tend to have relatively smaller scales, lower levels of labour skills, and higher labour substitutability. Therefore, compared to state-owned enterprises, the impact of the GVC position on internal income inequality may be more pronounced in private enterprises. The influence of GVC position on internal income inequality may vary across enterprises with different profit distribution methods.
Given these considerations, we divide the overall sample into state-owned enterprises and non-state-owned enterprises for analysis based on ownership nature. The regression results in columns (1)–(3) of Table 6 examine the impact of GVC position on internal income inequality in state-owned enterprises using different indicators of internal income inequality, while results in columns (4)–(6) correspond to private enterprises. The regression results indicate that the estimated coefficient of GVC position is significantly negative in state-owned enterprises, while it is significantly positive in non-state-owned enterprises. This suggests that an enhancement in the GVC position in state-owned enterprises will reduce internal income disparities, whereas, in private enterprises, an improvement in GVC position will widen internal income inequality. This is mainly because the salary system of state-owned enterprises in China is significantly different from that of non-state-owned enterprises, and there are institutional constraints such as ‘salary limit orders’. The salaries of executives have a certain upper limit, so the improvement of the GVC integration status may not have a substantial impact on the relatively stable salary mechanism of state-owned enterprises. The profit distribution method of non-state-owned enterprises is mainly based on the distribution of production factors. The profit distribution of enterprises is strongly related to the technical production efficiency and the contribution of labour skills, which leads to a more prominent impact of the embedded position in the GVC on income inequality within non-state-owned enterprises.
Heterogeneity by ownership nature

Robust standard errors are in parentheses.***p < 0.01,**p < 0.05,*p < 0.1.
Heterogeneity of enterprise market power
Top enterprises with high market power, as important carriers of market share and influence, often occupy a more prominent position in the GVC. These types of enterprises, with their extensive market coverage and deep resource accumulation, not only demonstrate stronger bargaining power in international competition but also tend to obtain more favourable conditions and higher profit shares through strategic negotiations. Top enterprises usually have more mature strategic planning and efficient operational management mechanisms, making their positioning in the GVC more advantageous. This strategic advantage not only promotes the realisation of cost control and maximisation of benefits but may also lead to an exacerbation of income distribution inequality to a certain extent. The talent assignment hypothesis of economics of superstars suggests that management talents with more talent will be matched with larger companies, while the quality of ordinary employees is unlikely to be affected by company size. If employee salaries are paid based on their marginal output, the wage gap between management and ordinary employees in superstar companies will be larger than in ordinary companies (Mueller et al 2017). Therefore, it is expected that top companies with higher positions in the value chain will experience more significant internal income inequality. We divide the sample into top 10% of enterprises based on their position in the value chain, and another group represents other enterprises. As shown in Table 7, in the top enterprise group, the coefficient of GVC embedding position is significant at least at the 10% significance level, indicating that the positive impact of GVC embedding position on income inequality within the top enterprises is more significant, while it has no significant impact on internal income inequality in other enterprises, which is in line with our theoretical expectations. Specifically, from the regression results in column (2), it can be seen that when the GVC position of the top enterprise increases by 1%, the salary gap between executives and ordinary employees within the enterprise will widen by 19.46%, which is a considerable proportion.
Heterogeneity by enterprise size
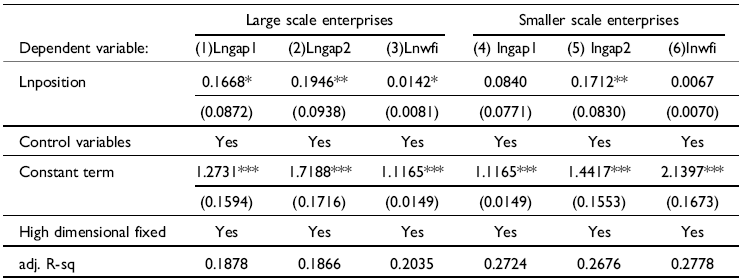
Robust standard errors are in parentheses.***p < 0.01,**p < 0.05,*p < 0.1.
Heterogeneity of employee bargaining power
Bargaining power is a crucial factor influencing the sharing of rents among employees within a company (Fuest et al Reference Fuest, Peichl and Siegloch2018). The internal workforce is not a homogeneous entity and different employees exhibit significant differences in the degree of rent sharing due to variations in their bargaining power, thereby leading to an expansion of internal income inequality within the company (Fuest et al Reference Fuest, Peichl and Siegloch2018; Kline et al Reference Kline, Petkova and Williams2019). If ordinary employees possess higher bargaining power within the company, they can share more rents resulting from tax benefits, thus alleviating internal income inequality. The increasing GVC position may have a greater impact on income inequality within companies with lower bargaining power. Therefore, we use the proportion of employee supervisors on the board to measure employee bargaining power, where a higher proportion indicates higher bargaining power among employees (Wang and Liu, Reference Wang and Liu2014).
We utilise data on the proportion of employee supervisors on the board and classify the sample into two categories based on the median value of bargaining power. The results in Table 8 indicate that in companies with lower employee bargaining power, the coefficient of the GVC position is significantly positive, suggesting a positive impact on internal income inequality within the company. Conversely, in companies with higher employee bargaining power, the influence of the GVC position on internal income inequality is not significant. This implies that as the GVC position deepens, income inequality within companies with lower employee bargaining power gradually expands. In contrast, there is no significant change in income inequality within companies with higher employee bargaining power, aligning with our expectations.
Heterogeneity of employee bargaining power
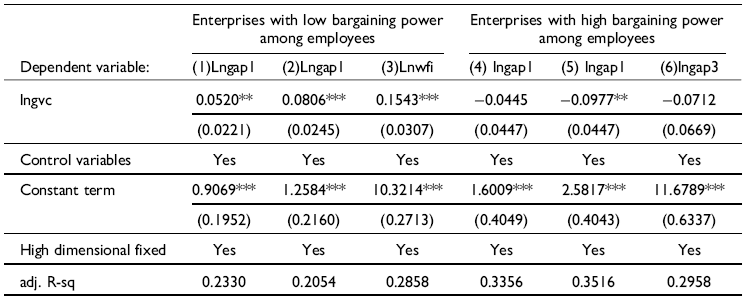
Robust standard errors are in parentheses.***p < 0.01,**p < 0.05,*p < 0.1.
Heterogeneity of enterprise factor intensity
In the process of analysing the impact of GVC status on internal income inequality within enterprises, it is crucial to conduct heterogeneity analysis of enterprises according to factor intensity. Enterprises with different factor densities have varying degrees of dependence on human resources, technology, and capital in the production process. This difference may lead to different competitive pressures and development strategies for enterprises in GVC, thereby affecting internal compensation structures and income gaps between executives and ordinary employees. This article divides the enterprises in the sample into three groups based on factor intensity, namely labour-intensive. The regression results for capital-intensive and technology-intensive are shown in Table 9. The increase in GVC status of labour-intensive enterprises has a positive impact on income inequality within the enterprise, while the increase in GVC status of capital and technology-intensive enterprises has a negative impact on income inequality within the enterprise. The possible reason is that in labour-intensive enterprises, participating in the GVC increases the demand for efficient management and decision-making abilities, and executives therefore receive higher salaries as a reward for the company’s participation in global market competition, with the management incentive effect playing a major role. In technology-intensive and capital-intensive enterprises, the GVC status of the enterprise reduces income inequality. This may be because these industries typically rely heavily on technological innovation and capital investment and participating in GVC provides ordinary employees with more opportunities to learn and adapt to new technologies, improving their overall skill level and production efficiency, thereby driving up the income of ordinary employees and narrowing the salary gap with executives. In addition, technology and capital-intensive enterprises may also tend to implement more equitable compensation policies aimed at incentivising employee innovation and optimising resource utilisation to address global market challenges.
Heterogeneity of enterprise factor intensity

Mechanism test
Rent-sharing mechanism examination
Building upon the theoretical and empirical analyses presented earlier, to explore the mechanism through which the GVC influences internal income inequality within enterprises, we proceed to replace the dependent variables in the baseline model with the average wages of management and employees. This allows us to investigate how the specific position of a company within the GVC impacts the wages of management and employees, thereby affecting internal income inequality within the company. The regression results are as follows.
The regression results in Table 10 demonstrate that the coefficients of the GVC position indicator are all significantly positive. This indicates that the position of a company within the GVC has a significant positive impact on both the average wages of senior management and ordinary employees within the company. This conclusion remains robust even after incorporating high-dimensional fixed effects and altering the measurement method for the average wages of management. However, the coefficient of the impact of the GVC position on the average wages of senior management is much larger than that on the average wages of ordinary employees, suggesting that the increase in average compensation for managers due to the elevation of the GVC position is greater than that for ordinary employees, leading to an expanding gap between them.
Comparative analysis

Robust standard errors are in parentheses.***p < 0.01,**p < 0.05,*p < 0.1.
Based on the theoretical analysis presented earlier, we attribute this result to the rent-sharing effect. The position within the GVC may significantly influence internal income inequality within a company through the rent-sharing effect. To validate this mechanism, we refer to Matray (Reference Matray2021) and Jiang and construct the following regression model:
 $$I{\rm{nrent}}_{i,t} = \beta 0\ln {\rm{position}}_{i,t} + \beta 1{\rm{c}}ontrol_{i,t} + year_{i,t} + code_{i,t} + \varepsilon_{i,t}$$
Where lnrent represents quasi-rents of the company. Following Zhou and Qi (Reference Zhou and Qi2014), quasi-rents are defined as the difference between per capita sales revenue and industry average wages, measuring the magnitude of excess profits in the enterprise and reflecting the company’s capacity to pay. Furthermore, we utilise the logarithm of intangible asset income as a measure of company rents, keeping other indicators consistent with the baseline model.
The results in Table 11 indicate that the GVC position has a positive impact on the quasi-rents of the company. Furthermore, quasi-rents have a positive effect on internal income inequality within the company, indicating that rent-sharing is the mechanism through which the GVC position exacerbates internal income inequality. This suggests that an improvement in a company’s GVC position leads to an increase in company rents, with rent distribution within the company being more inclined towards management, resulting in a gradual widening of the wage gap between management and ordinary employees within the company.
Intermediary effect of enterprise quasi-rent

Robust standard errors are in parentheses.***p < 0.01,**p < 0.05,*p < 0.1.
The moderating effect of human capital level
The source of company quasi-rents lies in specific human capital and non-human capital (Mashiko Reference Masahiko1984; Williamson, Reference Williamson1985). Human capital is a crucial factor influencing rent acquisition. Based on the analysis presented earlier, within the GVC, a company’s human capital structure may tend towards sophistication as the company’s GVC position improves, leading to a continuous enhancement of human capital levels. This will result in an increase in the average salary levels of employees, reducing the gap between them and the average wages of management, thereby mitigating the exacerbation of internal income inequality brought about by the improvement in GVC position. To validate this hypothesis, we construct the following equation based on Model 1.
 $$I{\rm{nequality}}_{i,t} = \alpha 0\ln position_{i,t} + \alpha 1M + a2{\rm{c}}ontrol_{i,t} + year_{i,t} + code_{i,t} + \varepsilon_{i,t}$$
Where M represents the interaction term between the company’s GVC position and the level of human capital within the company. All other variables remain consistent with the baseline model. The regression results for Model 3 are presented in Table 12.
The moderating effect of enterprise human capital level

Robust standard errors are in parentheses.***p < 0.01,**p < 0.05,*p < 0.1.
The results in Table 12 indicate that regardless of whether the regression is conducted using OLS, individual fixed effects, high-dimensional fixed effects, or with the replacement of the measurement standard for internal income inequality, the coefficients of the interaction term M are significantly negative in all columns. This implies that an increase in the level of human capital within the company will mitigate the effect of the elevation of the GVC position on the expansion of internal income inequality within the company.
Conclusion
Based on matched data from Chinese listed companies and Chinese customs, this study investigates the impact of a company’s position within the GVC on internal income inequality. The research findings suggest that the improvement of a company’s position within the GVC leads to an increase in the wages of all employees within the company. However, concurrently, it results in widening the wage gap between management and regular employees, thus amplifying internal income inequality. It is also observed that higher levels of human capital can partially alleviate the inequality effects resulting from the elevation of the GVC position. Notably, state-owned enterprises (SOEs) and private enterprises exhibit differences in the impact of GVC position improvement on internal income inequality. The internal income gap in SOEs tends to narrow, while inequality within private enterprises exacerbates.
Further analysis reveals the moderating effects of firm size and employees’ bargaining power in this process. It indicates that large enterprises and firms with lower bargaining power experience a greater impact on internal income inequality due to the elevation of GVC position, whereas this effect is not significant in small enterprises and those with lower bargaining power.
China has proposed comprehensive deepening reforms, expanding openness, and promoting active integration of enterprises into the GVC to enhance its position in the international division of labour and strengthen international competitiveness. With the significant elevation of China’s position in the GVC, enterprises can not only enjoy a broader market and richer resources but also raise the wages of their employees. Therefore, companies should focus on strengthening their core competitiveness, adopting more advanced technologies, optimising products and services, and striving to ascend to the middle-to-high end of the GVC to achieve higher-level development. However, while pursuing development, attention must also be paid to issues of fairness. When sharing the benefits of the GVC, companies should follow national guidelines on optimising income distribution structure, enhance the transparency and fairness of distribution, ensure that ordinary employees receive fair rewards in the company’s development, and reasonably adjust the wage gap between high-income groups and ordinary employees to prevent the widening of unjust income disparities.
For private enterprises, particular attention should be paid to governance and labour relations during the GVC integration process to reduce social inequality brought about by globalisation. Additionally, to enhance employees’ bargaining power, companies should establish sound internal training systems and regulatory mechanisms. By promoting employee skill enhancement and career development, strengthening labour protection, improving social security, and fostering harmonious and stable labour relations, companies can create a conducive environment for long-term stability and sustainable development. National policies should continue to support enterprises in driving productivity growth through technological innovation and ensuring fair income distribution through institutional innovation. Promoting a fair domestic labour market and policies for GVC integration not only contribute to improving overall economic efficiency but are also crucial for long-term social stability and sustainable development, fostering a conducive economic and social environment for long-term stable progress.
Although the paper offers valuable insights into the relationship between a company’s GVC position and internal income inequality, it is subject to certain research limitations. Firstly, due to data and methodological constraints, causal interpretations of the results may require further experimental or long-term tracking data support. Secondly, the focus of this study is on publicly listed companies, which may overlook the situations of non-listed companies playing different roles in GVC structures and experiencing distinct dynamics of wage and income inequality. Furthermore, future research could consider cross-cultural comparisons to analyse the relationship between a company’s GVC position and internal income inequality under different institutional and cultural backgrounds in various countries.
Alai Yeerken (1989), female, Kazakh, from Xinjiang, China, PhD in Economics, Teacher at the School of International Economics and Trade, Xinjiang University of Finance and Economics. Her research focuses on global value chains, digital service trade and income distribution. Contact email: xjdxjgxy@126.com
Deng Feng (1970), male, the Han nationality, born in Hubei, China, a professor at the School of Economics and Management of Xinjiang University. He holds a Ph.D. in Management and is a doctoral supervisor. His research focuses on technological innovation and economic growth. Contact email: xjdxjgxydf@163.com



