I. INTRODUCTION
Transition metal diborides, especially ZrB2 and HfB2, have high melting temperature, high thermal conductivity and excellent oxidation resistance, which makes ultrahigh temperature ceramics (UHTCs) be the most promising candidates used in the re-entry and hypersonic vehicles as leading edge components. Reference Upadhya, Yang and Hoffman1–Reference Monteverde and Scatteia7 Moreover, within the family of UHTCs, ZrB2 has the lowest theoretical density (6.09 g/cm3), which is a desired property in aerospace field. Reference Fahrenholtz, Hilmas, Talmy and Zaykoski8,Reference Tandon, Dumm, Corral, Loehman and Kotula9 However, when the temperature is higher than 1200 °C, the oxidation resistance of ZrB2 is poor, for the products of B2O3 volatilize fast, leaving the porous and nonprotective ZrO2 layer. Reference Tripp and Graham10–Reference Berkowitz-Mattuck13 Great efforts have been made to improve the oxidation resistance of ZrB2 at over 1200 °C. Reference Chamberlain, Fahrenholtz, Hilmas and Ellerby3,Reference Tripp, Davis and Graham14–Reference Han, Hu, Zhang, Han and Meng17 The addition of SiC can significantly improve the oxidation resistance at elevated temperature. Reference Monteverde and Bellosi15,Reference Monteverde and Bellosi18–Reference Zhu, Fahrenholtz and Hilmas21 The formed glassy borosilicate is more viscous and has lower evaporation pressure. Besides, it is a better barrier to oxygen diffusion than boria. Reference Karlsdottir, Halloran and Henderson22,Reference Karlsdottir and Halloran23 So the glassy borosilicate can provide more efficient protection than boria.
The oxidation mechanism of UHTCs is very complicated. Numerous investigators have performed a lot of experiments to observe and analyze the microstructure evolution and the oxidation products during oxidation of UHTCs and have a certain understanding on the oxidation mechanism. Reference Rezaie, Fahrenholtz and Hilmas24–Reference Wang, Liu, Hou, Hu, Sun and Zhou35 Wang et al. Reference Wang, Liu, Hou, Hu, Sun and Zhou35 synthesized ZrC–SiC powders and investigated the oxidation behavior. At low temperature, ZrC quickly oxidizes to form a nonprotective ZrO2 layer, while protective SiO2 forms to improve the oxidation resistance at ∼1000 °C. Zhao et al. Reference Zhao, Jia, Duan, Yang and Zhou34 analyzed the microstructure and phase composition for ZrC–30 vol% SiC oxidation from low temperature to ultrahigh temperature. Li et al. Reference Li, Dong, Wang, He, Zhou, Yang, Wu and Hu33 fabricated three-dimensional needled Cf/ZrC–SiC and studied the mechanical properties, microstructure and high-temperature properties. They concluded that the excellent high-temperature properties are due to the formation of ZrSiO4 on the surface. Zhang et al. Reference Zhang, Hu and Han31 investigated the structure evolution and oxidation behavior of ZrB2–SiC in a wide temperature range. The SiC content significantly affects the structure evolution over 1800 °C while it has no apparent influence below 1600 °C. Brent Bargeron et al. Reference Bargeron, Benson, Jette and Phillips32 studied the oxidation behavior of hafnium carbide in the temperature range 1400–2060 °C. Three distinct layers are found in the cross section, and the interlayer oxide is the best barrier for oxygen diffusion in the three layers. Lately, theoretical progress of UHTCs oxidation has been achieved. Parthasarathy et al. Reference Parthasarathy, Rapp, Opeka and Kerans36,Reference Parthasarathy, Rapp, Opeka and Cinibulk37 proposed several models to describe the oxidation progress. The model can calculate the weight gain and oxidation kinetics and the results are in reasonable agreement with the experimental data. However, the growth strain in the oxidation process is not considered. The growth strain accompanying the metal oxidation process has been known for a long time. Reference Evans38–Reference Schütze41 Several theories have been proposed to explain the mechanism of the origin of the growth strain. Reference Bedworth and Pilling42–Reference Panicaud, Grosseau-Poussard and Dinhut45 The Clarke’s model is the most adopted. A lot of researches are based on the Clarke’s model. Reference Zhang, Zhang, Tu and Xuan46–Reference Maharjan, Zhang and Wang51 Moreover, the stress induced by the oxidation process in return can affect the oxidation kinetics. Reference Krishnamurthy and Srolovitz52–Reference Wang and Shen57 Recently, based on the Parthasarathy et al.’s model, Reference Parthasarathy, Rapp, Opeka and Kerans36 Zhou et al. Reference Zhou, Peng and Wei58 proposed a thermo-chemo-mechanical model for the oxidation of ZrB2. Panicaud et al. Reference Panicaud, Grosseau-Poussard, Retraint, Guérain and Li59 reported the stress evolution in the case of oxidation of Zr alloy. The oxidation product of ZrB2–SiC is ZrO2, which is the same as that of Zr alloy. So there exists stress in the oxidation of ZrB2–SiC, too. The stress analysis in the oxidation process is very essential to predict the cracking and spalling of the oxide. However, there are few investigations focused on the chemomechanical coupling issue in the oxidation process of ZrB2–SiC.
In this work, a chemomechanical model for the oxidation and stress evolution in ZrB2–SiC is proposed. The oxidation process can induce the stress and in return the stress can affect the molecular oxygen diffusion and oxidation reaction rate. The model can describe the evolutions of the stress in the oxide layer and the unoxidized substrate, oxide layer thickness, weight gain, pore radius, and pore volume fraction. The calculated results are consistent with the experimental observations.
II. Chemomechanical model
A. Model framework
The morphology of the oxide scale, the oxidation products and phase present are derived from the literature studies.
Reference Levine, Opila, Halbig, Kiser, Singh and Salem2,Reference Monteverde and Bellosi15,Reference Rezaie, Fahrenholtz and Hilmas24,Reference Opila and Halbig29,Reference Zhang, Hu and Han31,Reference Carney, Mogilvesky and Parthasarathy60
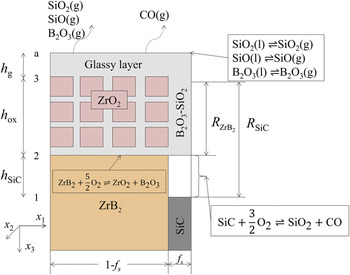
The oxidation schematic is shown in Fig. 1. Since the oxidation behavior of ZrB2–SiC is different in different temperature ranges, the oxidation temperature in the model is limited to 1200–1800 °C, which is the range of engineering interest. The substrate is ZrB2 containing dispersive SiC particles. The oxidation products are disconnected ZrO2 grains (in cross section) with a continuous porous region which is filled with glassy borosilicate. In the limited range of temperature in the work, the permeability of molecular oxygen through the ZrO2 grains is very small compared with that through the porous channels filled with glassy borosilicate, so the molecular oxygen permeating through the ZrO2 grains is neglected, as presented in Parthasarathy et al.’s work.
Reference Parthasarathy, Rapp, Opeka and Kerans36
The oxygen in the environment first dissolves in the glassy borosilicate then permeates through the outer glassy layer and the porous channels to react with the ZrB2 at the interface 2 (see Fig. 1). A portion of oxygen diffuses through the SiC-depleted region to react with SiC at the interface 1 (see Fig. 1). The amount of oxygen is assumed to be proportional to the volume fraction of SiC. The volume fraction of SiC in the substrate is f
s. The porosity within ZrO2 region is f
p. The glassy borosilicate volume fraction f
g and the ZrO2 volume fraction
 ${f_{{\rm{Zr}}{{\rm{O}}_2}}}$
in the region (2–3) of Fig. 1 are expressed as
 $${f_{\rm{g}}} = {f_{\rm{s}}} + {f_{\rm{p}}}\left( {1 - {f_{\rm{s}}}} \right)\quad ,$$
 $${f_{{\rm{Zr}}{{\rm{O}}_2}}} = \left( {1 - {f_{\rm{p}}}} \right)\left( {1 - {f_{\rm{s}}}} \right) = 1 - {f_{\rm{g}}}\quad .$$
Oxidation schematic of ZrB2–SiC.

B. One-dimensional model
At the temperature range of 1200–1800 °C, the chemical reaction can be schematically expressed as
 $${\rm{Zr}}{{\rm{B}}_2} + {5 \over 2}{{\rm{O}}_2} = {\rm{Zr}}{{\rm{O}}_2} + {{\rm{B}}_2}{{\rm{O}}_3}\quad ,$$
 $${\rm{SiC}} + {3 \over 2}{{\rm{O}}_2} = {\rm{Si}}{{\rm{O}}_2} + {\rm{CO}}\quad .$$
The thickness evolutions of the oxide and outer glassy layer are expressed as (details refer to Appendix)
 $${{{\rm{d}}{h_{{\rm{ox}}}}} \over {{\rm{d}}t}} = {{{V_{{\rm{Zr}}{{\rm{O}}_2}}}} \over {{f_{{\rm{Zr}}{{\rm{O}}_2}}}}}k_1^0\exp \left( {{{{\eta _{\rm{p}}}{V_{\rm{m}}}{\sigma _{{\rm{kk}}}}} \over {RT}}} \right){\left( {C_{{{\rm{O}}_2}}^{i2}} \right)^{{5 \mathord{\left/ {\vphantom {5 2}} \right. \kern-\nulldelimiterspace} 2}}}\quad ,$$
 $$\eqalign{ & {{{\rm{d}}{h_{\rm{g}}}} \over {{\rm{d}}t}} = \left\Bigg[ {k_1^0\exp \left( {{{{\eta _{\rm{p}}}{V_{\rm{m}}}{\sigma _{{\rm{kk}}}}} \over {RT}}} \right){{\left( {C_{{{\rm{O}}_2}}^{i2}} \right)}^{{5 \mathord{\left/ {\vphantom {5 2}} \right. \kern-\nulldelimiterspace} 2}}} - \left| {{J_{{{\rm{B}}_2}{{\rm{O}}_3} - {\rm{vap}}}}} \right|} \right]{V_{{{\rm{B}}_2}{{\rm{O}}_3}}} \cr & \quad\quad \quad + \left\Bigg[ {{5 \over 3}{{{f_{\rm{s}}}} \over {1 - {f_{\rm{s}}}}}k_1^0\exp \left( {{{{\eta _{\rm{p}}}{V_{\rm{m}}}{\sigma _{{\rm{kk}}}}} \over {RT}}} \right){{\left( {C_{{{\rm{O}}_2}}^{i2}} \right)}^{{5 \mathord{\left/ {\vphantom {5 2}} \right. \kern-\nulldelimiterspace} 2}}} <$$><$$>- \left| {{J_{{\rm{Si}}{{\rm{O}}_2} - {\rm{vap}}}}} \right| - \left| {{J_{\rm{SiO - vap}}}} \right|} \right\Bigg]{V_{\rm{Si{O_2}}}} - {{{\rm{d}}{h_{{\rm{ox}}}}} \over {{\rm{d}}t}}{f_{\rm{g}}}\quad . \cr}$$
Equations (5) and (6) are Eqs. (A24) and (A25) in the Appendix. The variables in Eqs. (5) and (6) are defined in Appendix.
The recession rate of ZrB2 and SiC is related to the change rate of h ox through molar volume and volume fraction.
 $${{d{R_{{\rm{Zr}}{{\rm{B}}_2}}}} \over {{\rm{d}}t}} = {{{V_{{\rm{Zr}}{{\rm{B}}_2}}}} \over {{V_{{\rm{Zr}}{{\rm{O}}_2}}}}}{{{f_{{\rm{Zr}}{{\rm{O}}_2}}}} \over {(1 - {f_{\rm{s}}})}}{{{\rm{d}}{h_{{\rm{ox}}}}} \over {{\rm{d}}t}}\quad ,$$
 $${{{\rm{d}}{R_{{\rm{SiC}}}}} \over {{\rm{d}}t}} = {5 \over 3}{{{V_{{\rm{SiC}}}}{f_{{\rm{Zr}}{{\rm{O}}_2}}}} \over {{V_{{\rm{Zr}}{{\rm{O}}_2}}}\left( {1 - {f_{\rm{s}}}} \right)}}{{{\rm{d}}{h_{{\rm{ox}}}}} \over {{\rm{d}}t}}\quad ,$$
where
 ${V_{{\rm{Zr}}{{\rm{B}}_2}}}$
and
 ${V_{{\rm{SiC}}}}$
are the molar volume of ZrB2 and SiC, respectively.
 ${R_{{\rm{Zr}}{{\rm{B}}_2}}}$
and R
SiC are the recession thickness of ZrB2 and SiC, respectively.
Then the SiC-depleted layer thickness h SiC is easily expressed as
 $${h_{{\rm{SiC}}}} = {R_{{\rm{SiC}}}} - {R_{{\rm{Zr}}{{\rm{B}}_2}}}\quad .$$
The weight gain due to the oxidation is expressed as
 $${W_{\rm{g}}} = \;{h_{{\rm{ox}}}}\left( {{f_{{\rm{Zr}}{{\rm{O}}_2}}}{\rho _{{\rm{Zr}}{{\rm{O}}_2}}} + {f_{\rm{g}}}{\rho _{\rm{g}}}} \right) + {h_{\rm{g}}}{\rho _{\rm{g}}} - {R_{{\rm{SiC}}}}{f_{\rm{s}}}{\rho _{{\rm{SiC}}}} - {R_{{\rm{Zr}}{{\rm{B}}_2}}}\left( {1 - {f_{\rm{s}}}} \right){\rho _{{\rm{Zr}}{{\rm{B}}_2}}}\quad ,$$
where
 ${\rho _{{\rm{Zr}}{{\rm{O}}_2}}}$
,
 ${\rho _{{\rm{SiC}}}}$
,
 ${\rho _{{\rm{Zr}}{{\rm{B}}_2}}}$
, and
 ${\rho _{\rm{g}}}$
are the density of ZrO2, SiC, ZrB2, and borosilicate, respectively.
Accompanying the oxide layer growth, the stress is generated. The average stress in the oxide and substrate is expressed as follows (details refers to Appendix):
 $${\dot \sigma _{{\rm{ox}}}} = {{\left[ {{B_{{\rm{ox}}}}\exp \left( { - {{{Q_{{\rm{ox}}}}} \over {RT}}} \right){{\left( { - {\sigma _{{\rm{ox}}}}} \right)}^{{n_{{\rm{ox}}}}}} + {B_{{\rm{sub}}}}\exp \left( { - {{{Q_{{\rm{sub}}}}} \over {RT}}} \right){{\left( { - {{{\sigma _{{\rm{ox}}}}{h_{{\rm{ox}}}}} \mathord{\left/ {\vphantom {{{\sigma _{{\rm{ox}}}}{h_{{\rm{ox}}}}} {{h_{{\rm{sub}}}}}}} \right. \kern-\nulldelimiterspace} {{h_{{\rm{sub}}}}}}} \right)}^{{n_{{\rm{sub}}}}}} <$$><$$>+ \left( {{{1 - {v_{{\rm{ox}}}}} \over {E_{{\rm{ox}}}^2}}{{\dot E}_{{\rm{ox}}}} - {{1 - {v_{{\rm{sub}}}}} \over {{E_{{\rm{sub}}}}}}{{{{\dot h}_{{\rm{ox}}}}{h_{{\rm{sub}}}} - {h_{{\rm{ox}}}}{{\dot h}_{{\rm{sub}}}}} \over {h_{{\rm{sub}}}^2}}} \right){\sigma _{{\rm{ox}}}} - {D_{{\rm{ox}}}}{{\dot h}_{{\rm{ox}}}}} \right\bigg]} \mathord{\left/ {\vphantom {{\left[ {{B_{{\rm{ox}}}}\exp \left( { - {{{Q_{{\rm{ox}}}}} \over {RT}}} \right){{\left( { - {\sigma _{{\rm{ox}}}}} \right)}^{{n_{{\rm{ox}}}}}} + {B_{{\rm{sub}}}}\exp \left( { - {{{Q_{{\rm{sub}}}}} \over {RT}}} \right){{\left( { - {{{\sigma _{{\rm{ox}}}}{h_{{\rm{ox}}}}} \mathord{\left/ {\vphantom {{{\sigma _{{\rm{ox}}}}{h_{{\rm{ox}}}}} {{h_{{\rm{sub}}}}}}} \right. \kern-\nulldelimiterspace} {{h_{{\rm{sub}}}}}}} \right)}^{{n_{{\rm{sub}}}}}} + \left( {{{1 - {v_{{\rm{ox}}}}} \over {E_{{\rm{ox}}}^2}}{{\dot E}_{{\rm{ox}}}} - {{1 - {v_{{\rm{sub}}}}} \over {{E_{{\rm{sub}}}}}}{{{{\dot h}_{{\rm{ox}}}}{h_{{\rm{sub}}}} - {h_{{\rm{ox}}}}{{\dot h}_{{\rm{sub}}}}} \over {h_{{\rm{sub}}}^2}}} \right){\sigma _{{\rm{ox}}}} - {D_{{\rm{ox}}}}{{\dot h}_{{\rm{ox}}}}} \right]} {\left( {{{{{1 - {v_{{\rm{ox}}}}} \over {{E_{{\rm{ox}}}}}} + {{1 - {v_{{\rm{sub}}}}} \over {{E_{{\rm{sub}}}}}}{h_{{\rm{ox}}}}} \mathord{\left/ {\vphantom {{{{1 - {v_{{\rm{ox}}}}} \over {{E_{{\rm{ox}}}}}} + {{1 - {v_{{\rm{sub}}}}} \over {{E_{{\rm{sub}}}}}}{h_{{\rm{ox}}}}} {{h_{{\rm{sub}}}}}}} \right. \kern-\nulldelimiterspace} {{h_{{\rm{sub}}}}}}} \right)}}} \right. \kern-\nulldelimiterspace} {\left( {{{{{1 - {v_{{\rm{ox}}}}} \over {{E_{{\rm{ox}}}}}} + {{1 - {v_{{\rm{sub}}}}} \over {{E_{{\rm{sub}}}}}}{h_{{\rm{ox}}}}} \mathord{\left/ {\vphantom {{{{1 - {v_{{\rm{ox}}}}} \over {{E_{{\rm{ox}}}}}} + {{1 - {v_{{\rm{sub}}}}} \over {{E_{{\rm{sub}}}}}}{h_{{\rm{ox}}}}} {{h_{{\rm{sub}}}}}}} \right. \kern-\nulldelimiterspace} {{h_{{\rm{sub}}}}}}} \right)}}\quad ,$$
 $${\dot \sigma _{{\rm{sub}}}} = {{\left[ {{B_{{\rm{ox}}}}\exp \left( { - {{{Q_{{\rm{ox}}}}} \over {RT}}} \right){{\left( {{{{\sigma _{{\rm{sub}}}}{h_{{\rm{sub}}}}} \mathord{\left/ {\vphantom {{{\sigma _{{\rm{sub}}}}{h_{{\rm{sub}}}}} {{h_{{\rm{ox}}}}}}} \right. \kern-\nulldelimiterspace} {{h_{{\rm{ox}}}}}}} \right)}^{{n_{{\rm{ox}}}}}} + {B_{{\rm{sub}}}}\exp \left( { - {{{Q_{{\rm{sub}}}}} \over {RT}}} \right){{\left( {{\sigma _{{\rm{sub}}}}} \right)}^{{n_{{\rm{sub}}}}}} + \left( {{{1 - {v_{{\rm{ox}}}}} \over {{E_{{\rm{ox}}}}}}{{{{\dot h}_{{\rm{sub}}}}{h_{{\rm{ox}}}} - {h_{{\rm{sub}}}}{{\dot h}_{{\rm{ox}}}}} \over {h_{{\rm{ox}}}^2}} - {{{{1 - {v_{{\rm{ox}}}}} \over {E_{{\rm{ox}}}^2}}{{\dot E}_{{\rm{ox}}}}{h_{{\rm{sub}}}}} \mathord{\left/ {\vphantom {{{{1 - {v_{{\rm{ox}}}}} \over {E_{{\rm{ox}}}^2}}{{\dot E}_{{\rm{ox}}}}{h_{{\rm{sub}}}}} {{h_{{\rm{ox}}}}}}} \right. \kern-\nulldelimiterspace} {{h_{{\rm{ox}}}}}}} \right){\sigma _{{\rm{sub}}}} <$$><$$>- {D_{{\rm{ox}}}}{{\dot h}_{{\rm{ox}}}}} {\left{\vphantom{{Q_{ox}}\over {RT}}} \right]}}\mathord{\left/ {\vphantom {{\left[ {{B_{{\rm{ox}}}}\exp \left( { - {{{Q_{{\rm{ox}}}}} \over {RT}}} \right){{\left( {{{{\sigma _{{\rm{sub}}}}{h_{{\rm{sub}}}}} \mathord{\left/ {\vphantom {{{\sigma _{{\rm{sub}}}}{h_{{\rm{sub}}}}} {{h_{{\rm{ox}}}}}}} \right. \kern-\nulldelimiterspace} {{h_{{\rm{ox}}}}}}} \right)}^{{n_{{\rm{ox}}}}}} + {B_{{\rm{sub}}}}\exp \left( { - {{{Q_{{\rm{sub}}}}} \over {RT}}} \right){{\left( {{\sigma _{{\rm{sub}}}}} \right)}^{{n_{{\rm{sub}}}}}} + \left( {{{1 - {v_{{\rm{ox}}}}} \over {{E_{{\rm{ox}}}}}}{{{{\dot h}_{{\rm{sub}}}}{h_{{\rm{ox}}}} - {h_{{\rm{sub}}}}{{\dot h}_{{\rm{ox}}}}} \over {h_{{\rm{ox}}}^2}} - {{{{1 - {v_{{\rm{ox}}}}} \over {E_{{\rm{ox}}}^2}}{{\dot E}_{{\rm{ox}}}}{h_{{\rm{sub}}}}} \mathord{\left/ {\vphantom {{{{1 - {v_{{\rm{ox}}}}} \over {E_{{\rm{ox}}}^2}}{{\dot E}_{{\rm{ox}}}}{h_{{\rm{sub}}}}} {{h_{{\rm{ox}}}}}}} \right. \kern-\nulldelimiterspace} {{h_{{\rm{ox}}}}}}} \right){\sigma _{{\rm{sub}}}} - {D_{{\rm{ox}}}}{{\dot h}_{{\rm{ox}}}}} \right]} {\left( {{{ - {{1 - {v_{{\rm{ox}}}}} \over {{E_{{\rm{ox}}}}}}{h_{{\rm{sub}}}}} \mathord{\left/ {\vphantom {{ - {{1 - {v_{{\rm{ox}}}}} \over {{E_{{\rm{ox}}}}}}{h_{{\rm{sub}}}}} {{h_{ox}} - {{1 - {v_{{\rm{sub}}}}} \over {{E_{{\rm{sub}}}}}}}}} \right. \kern-\nulldelimiterspace} {{h_{ox}} - {{1 - {v_{{\rm{sub}}}}} \over {{E_{{\rm{sub}}}}}}}}} \right)}}} \right. \kern-\nulldelimiterspace} {\left( {{{ - {{1 - {v_{{\rm{ox}}}}} \over {{E_{{\rm{ox}}}}}}{h_{{\rm{sub}}}}} \mathord{\left/ {\vphantom {{ - {{1 - {v_{{\rm{ox}}}}} \over {{E_{{\rm{ox}}}}}}{h_{{\rm{sub}}}}} {{h_{ox}} - {{1 - {v_{{\rm{sub}}}}} \over {{E_{{\rm{sub}}}}}}}}} \right. \kern-\nulldelimiterspace} {{h_{ox}} - {{1 - {v_{{\rm{sub}}}}} \over {{E_{{\rm{sub}}}}}}}}} \right)}}\quad .$$
Equations (11) and (12) are Eqs. (A48) and (A49) in the Appendix. The definition of variables in Eqs. (11) and (12) refers to Appendix.
For the porous oxide layer, the relationship between Yong’s modulus and porosity is Reference Li, Li, Zhang and Fang61
 $${E_{{\rm{ox}}}} = {{E_{{\rm{ox}}}^0} \over {1 + {{4{f_{\rm{g}}}\left( {1 - v_{{\rm{ox}}}^2} \right)} \over {\rm{\pi }}}}}\quad ,$$
where
 $E_{{\rm{ox}}}^0$
is the Yong’s modulus of oxide when there is no pore.
The variation of pore radius r and borosilicate volume fraction f g is
 $$r = {r^0}\left( {1 + {\varepsilon _{{\rm{pore}}}}} \right)\quad ,$$
 $${f_{\rm{g}}} = f_{\rm{g}}^0{\left( {1 + {\varepsilon _{{\rm{pore}}}}} \right)^2}\quad ,$$
where r
0 and
 $f_{\rm{g}}^0$
are the pore radius and glassy borosilicate volume fraction when there is no stress.
III. RESULTS AND DISCUSSIONS
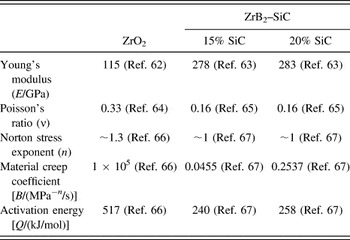
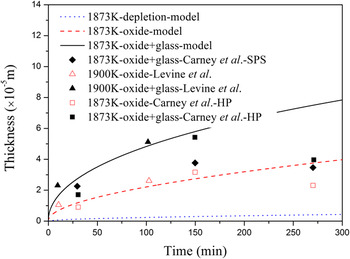
The temperature is 1600 °C and the material properties used in the calculation are listed in Table I. Figure 2 shows the thickness calculated by the model and the experimental data. The total thickness (oxide + glass), the oxide thickness and the SiC-depleted region thickness are all plotted. The calculated total thickness and the oxide thickness are both in good agreement with the experimental data, which validates the proposed model. Since the SiC-depleted region is indistinct in experiment observation, the experimental data of SiC-depleted region thickness is not available. So the calculated SiC-depleted region thickness is not compared with the experimental data. The solid line represents the total thickness of the oxide and glassy layer. The dotted line represents the thickness of the oxide. It can be easily seen from Fig. 2 that the outer glassy layer is almost the same thickness as the oxide thickness. The outer glassy layer is a barrier for oxygen diffusion which can provide excellent protection. So the good oxidation resistance of SiC-containing ZrB2 is due to the formation of the relatively thick outer glassy layer.
Material properties used in the calculation.

Calculated oxide layer thickness compared with experimental data Reference Levine, Opila, Halbig, Kiser, Singh and Salem2,Reference Carney, Mogilvesky and Parthasarathy60 for ZrB2–20 vol% SiC oxidized at 1873 K [from Eqs. (5), (6), and (9)].

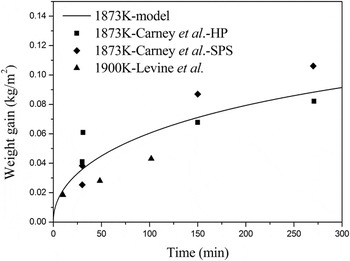
The weight gain calculated by the proposed model is compared with the experimental data in Fig. 3. The weight gain is controlled not only by the formation of oxidation products but also by the evaporation of the liquid products. The calculated weight gain is almost parabolic and in reasonable agreement with the experimental data.
Calculated weight gain compared with experimental data Reference Levine, Opila, Halbig, Kiser, Singh and Salem2,Reference Carney, Mogilvesky and Parthasarathy60 for ZrB2–20 vol% SiC oxidized at 1873 K [from Eq. (10)].

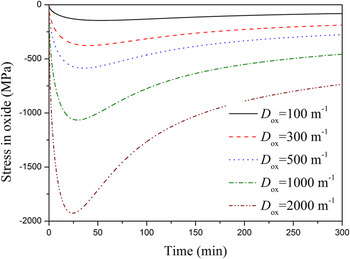
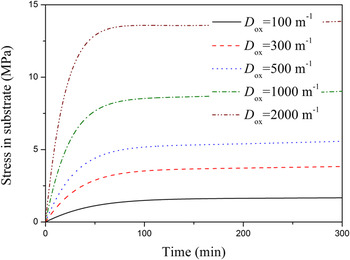
The stress evolution in the oxide layer is shown in Fig. 4. First, the compressive stress in the oxide layer increases with time, for the dominant factor is the growth strain. When the stress reaches the peak value, the stress begins to decrease with time, which is because the creep strain is dominant now. For different growth coefficient D ox, the trend of stress in the oxide layer is the same but the value of the stress increases with increasing the growth coefficient. Figure 5 shows the stress evolution in the substrate. The stress in the substrate is tensile. The stress increases first, then the stress almost remains the same. This is because the stress is dominated by the growth strain in the oxide layer in short oxidation time. As the oxidation time is prolonged, the creep strain becomes remarkable. The stress release rate is almost equal to the stress increasing rate. The stress almost remains unchanged. For different growth coefficient, the stress variation has the similar trend but increases with increasing the growth coefficient.
Stress evolution in the oxide layer for ZrB2–20 vol% SiC oxidized at 1873 K [from Eq. (11)].

Stress evolution in the substrate for ZrB2–20 vol% SiC oxidized at 1873 K [from Eq. (12)].

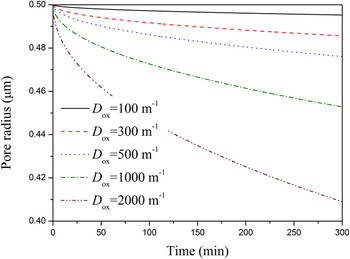
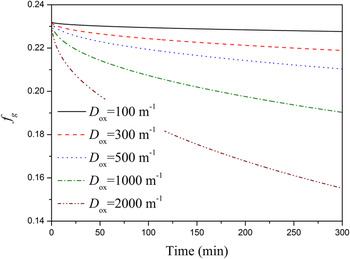
Since the stress in the oxide layer can affect the pore radius and the borosilicate volume fraction, the pore radius and the borosilicate volume fraction varies with time too. Figures 6 and 7 show the pore radius evolution with time and the borosilicate volume fraction evolution with time, respectively. It can be seen that the pore radius shrinks with time. The larger the growth coefficient is, the more the pore radius shrinks. The reason is that the compressive stress increases with the growth coefficient and the larger the compressive stress is, the more the pore radius shrinks. The borosilicate volume fraction has the same trend as the pore radius, for both of them are the characterizations of the effect of stress on the pore.
Pore radius evolution for ZrB2–20 vol% SiC oxidized at 1873 K [from Eq. (14)].

fg evolution for ZrB2–20 vol% SiC oxidized at 1873 K [from Eq. (15)].

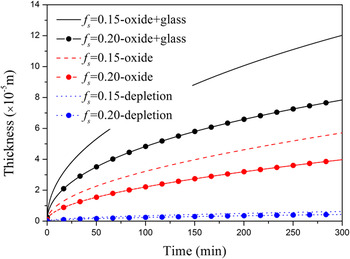
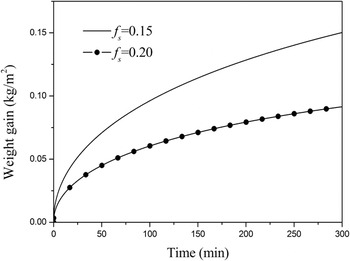
Figures 8 and 9 show the effect of different volume fraction additions of SiC on the ZrB2–SiC oxidation behavior. It is obvious that the ZrB2 with 20% volume fraction addition of SiC has thinner oxide layer thickness and smaller weight gain than that with 15% volume fraction addition of SiC. The addition of SiC particles can significantly reinforce the oxidation resistance of ZrB2 at elevated temperature. This is because the products of glassy SiO2 have very small evaporation pressure. Besides, the diffusivity of oxygen in glassy SiO2 is much smaller than that in glassy B2O3. The formed outer glassy borosilicate of ZrB2 with higher volume fraction addition of SiC contains more SiO2 than that with lower volume fraction addition of SiC. So the ZrB2 with higher volume fraction addition of SiC has more excellent oxidation resistance. The oxidation rate is slower, which results in thinner oxide layer thickness and smaller weight gain.

Weight gain for ZrB2 with different SiC contents oxidized at 1873 K [from Eq. (10)].

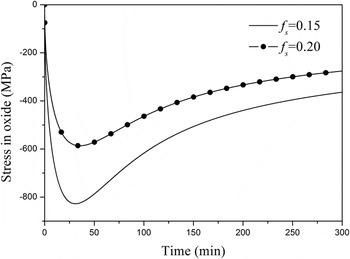
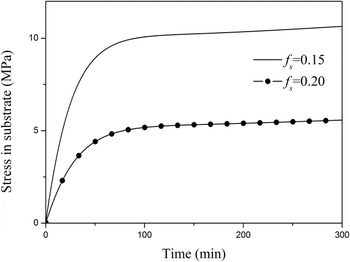
Since the ZrB2 with 20% volume fraction addition of SiC has thinner oxide layer, it is obvious that the stress should also be smaller. It can be seen from Figs. 10 and 11 that both the stresses in the oxide layer and the substrate are smaller for 20% volume fraction addition of SiC.
Stress evolution in the oxide layer for ZrB2 with different SiC content oxidized at 1873 K [from Eq. (11)].

Stress evolution in the substrate for ZrB2 with different SiC content oxidized at 1873 K [from Eq. (12)].

IV. CONCLUSIONS
A chemomechanical model is proposed for the oxidation and stress evolution in ZrB2–SiC. The model focuses on the coupling effects of chemical reaction and mechanics. The stress state in the oxidation process is very essential to predict the cracking and spalling of the oxide. Accompanying the oxidation process, the stress generates. The stress induced by the oxidation can affect the oxidation reaction rate and the oxygen diffusion. The volume fraction of SiC has great influence on the oxidation process. Due to that SiO2 has excellent barrier for oxygen diffusion and low evaporation pressure, the ZrB2 with higher volume fraction addition of SiC has thinner oxide layer thickness, lower weight gain and smaller stress. The calculated results are consistent with experimental data.
ACKNOWLEDGMENTS
This work is supported by the National Natural Science Foundation of China (NSFC Grants No. 11632014, 11372238, 11302161 and 11302162) and the Chang Jiang Scholar program.
APPENDIX: FORMULATION OF THE CHEMOMECHANICAL MODEL
1. Chemical Gibbs function variation
For the fully coupled chemomechanical process, the following chemical Gibbs function variation is obtained: Reference Hu and Shen68
 $$\delta {\Pi _{{\rm{gc}}}} = \int_V {\delta {g_{\rm{c}}}\,{\rm{d}}V} + \delta {D_{{\rm{gc}}}} - \delta {Q^ * } - \delta {W^ * } = 0\quad ,$$
where g
c is the chemical Gibbs function, and D
gc is the complement dissipative energy.
 ${Q^ * }$
and
 ${W^ * }$
are the complement heart absorbed from the external heart source and work of the external mechanical force. In the case of ZrB2–SiC oxidation at high temperature, the oxidation reaction occurs at the interface between the oxide and substrate. By the same derivational process in Ref. Reference Hu and Shen68, one gets
 $$\eqalign{ & \delta {\Pi _{{\rm{gc}}}} = 0 = \int_a {\left( {{\sigma _{ij}}{n_j} - \mathop {{T_i}}\nolimits^ * } \right)\delta {u_i}\,{\rm{d}}a} \cr & \;\;\;\;\;\;\;\;\;\;\;\;\; - \int_V {\left( {{\sigma _{ij,j}} + {f_i} - \rho {{\ddot u}_i}} \right)\delta {u_i}\,{\rm{d}}V} - \int_\Gamma {\left\| {{\sigma _{ij}}{n_j}} \right\|\delta {u_i}\,{\rm{d}}\Gamma } \cr & \;\;\;\;\;\;\;\;\;\;\;\;\; - \int_0^t {\int_V {\left( {{{\dot c}_N} + {c_N}{v_{k,k}} + \mathop {{J_{i,i}}}\nolimits^N } \right)\delta {\mu _N}\,{\rm{d}}V\,{\rm{d}}\tau } } \cr & \;\;\;\;\;\;\;\;\;\;\;\;\; + \int_0^t {\int_a {\left( {\mathop {{J_i}}\nolimits^N {n_i} - \mathop {{J_N}}\nolimits^ * } \right)\delta {\mu _N}{\rm{d}}a\,} {\rm{d}}\tau } \cr & \;\;\;\;\;\;\;\;\;\;\;\;\; - \int_0^t {\int_\Gamma {\left\{ {\left\| {{c_N}({v_k} - {V_k})} \right\|{n_k} + \left\| {\mathop {{J_i}}\nolimits^N {n_i}} \right\| <$$><$$>- {v_{Nr}}{{\dot w}_r}} \right\}\delta {\mu _N}\,{\rm{d}}\Gamma } } \,{\rm{d}}\tau \quad , \cr}$$
where
 ${\sigma _{ij}}$
,
 $\mathop {{T_i}}\nolimits^ *$
, u
i
, f
i
, and ρ are the stress, surface traction, displacement, body force, and density, respectively.
 ${v_k}$
is the particle velocity.
 ${c_N}$
,
 $\mathop {{J_i}}\nolimits^N$
, and
 ${\mu _N}$
are the molar fraction, diffusion flux, and chemical potential of species N, respectively.
 ${v_{Nr}}$
and
 ${\dot w_r}$
are the stoichiometric coefficient and reaction rate of the rth reaction, respectively.
 $\mathop {{J_N}}\nolimits^ *$
is the diffusion flux of species N on the boundary. V
k
is the velocity of the moving interface Γ. n
i
is the component of the normal vector of the boundary and interface.
 $\left\| \cdot \right\|$
denotes the jump.
Due to the arbitrariness of
 $\delta {u_i}$
and
 $\delta {\mu _N}$
, one can get from Eq. (A2) the governing equations
 $${\sigma _{ij,j}} + {f_i} = \rho {\ddot u_i}$$
 $${\dot c_N} = - {c_N}{v_{k,k}} - \mathop {{J_{i,i}}}\nolimits^N$$
and the boundary conditions
 $$\eqalignb{ {{\sigma _{ij}}{n_j} = \mathop {{T_i}}\nolimits^ * } \;\;\;\;\;\;{{\rm{on\ }}{a_\sigma }} \cr {\mathop {{J_i}}\nolimits^N {n_i} = \mathop {{J_N}}\nolimits^ * } \;\;\;\;\;\;\;{{\rm{on\ }}{a_{dn}}} \cr} \quad.$$
On the moving interface, one can get the jump conditions
 $$\eqalignb{ & \left\| {{\sigma _{ij}}{n_j}} \right\| = 0\quad , \cr & \left\| {{c_N}({v_k} - {V_k})} \right\|{n_k} + \left\| {\mathop {{J_i}}\nolimits^N {n_i}} \right\| - {v_{Nr}}{{\dot w}_r} = 0\quad . \cr}$$
2. One-dimensional model
At the temperature range of 1200–1800 °C, the chemical reaction can be schematically expressed as
 $${\rm{Zr}}{{\rm{B}}_2} + {5 \over 2}{{\rm{O}}_2} = {\rm{Zr}}{{\rm{O}}_2} + {{\rm{B}}_2}{{\rm{O}}_3}\quad ,$$
 $${\rm{SiC}} + {3 \over 2}{{\rm{O}}_2} = {\rm{Si}}{{\rm{O}}_2} + {\rm{CO}}\quad .$$
According to the law of mass action, the chemical reaction rate of Eq. (A7) is Reference Krishnamurthy and Srolovitz52,Reference Zhou, Qu and Cherkaoui54
 $${\dot w_1} = {k_1}{\left( {C_{{{\rm{O}}_2}}^{i2}} \right)^{{5 \mathord{\left/ {\vphantom {5 2}} \right. \kern-\nulldelimiterspace} 2}}}\quad ,$$
where
 ${k_1}$
is the chemical reaction rate constant of Eq. (A7).
 $C_{{{\rm{O}}_2}}^{i2}$
is the molar concentration of oxygen at the interface 2 in Fig. 1. The molar fraction and molar concentration are related by
 ${c_{{{\rm{O}}_2}}} = {V_{\rm{m}}}{C_{{{\rm{O}}_2}}}$
, where V
m is the average molar volume of the oxide per atom.
Based on the assumption that the amount of oxygen consumed by the SiC is proportional to the volume fraction of SiC, the following expression is obtained.
 $${\dot w_2} = {5 \over 3}{{{f_{\rm{s}}}} \over {1 - {f_{\rm{s}}}}}{k_1}{\left( {C_{{{\rm{O}}_2}}^{i2}} \right)^{{5 \mathord{\left/ {\vphantom {5 2}} \right. \kern-\nulldelimiterspace} 2}}}\quad ,$$
where
 ${\dot w_2}$
is the chemical reaction rate of Eq. (A8).
The generated ZrO2 causes the growth of the oxide layer. According to the conservation of zirconium atom, one can get
 $${{{\rm{d}}{h_{{\rm{ox}}}}} \over {{\rm{d}}t}} = {{{V_{{\rm{Zr}}{{\rm{O}}_2}}}} \over {{f_{{\rm{Zr}}{{\rm{O}}_2}}}}}{\dot w_1}\quad ,$$
where
 ${h_{{\rm{ox}}}}$
and
 ${V_{{\rm{Zr}}{{\rm{O}}_2}}}$
are the thickness of the oxide layer and molar volume of the ZrO2, respectively.
The net increase of liquid products (SiO2 and B2O3) first fills up the pore in the oxide layer, then forms the outer glassy layer. The outer glassy layer thickness h g is expressed as
 $${{{\rm{d}}{h_{\rm{g}}}} \over {{\rm{d}}t}} = \;\left( {{{\dot w}_1} - \left| {{J_{{{\rm{B}}_2}{{\rm{O}}_3} - {\rm{vap}}}}} \right|} \right){V_{{{\rm{B}}_2}{{\rm{O}}_3}}} + \left( {{{\dot w}_2} - \left| {{J_{{\rm{Si}}{{\rm{O}}_2} - {\rm{vap}}}}} \right| - \left| {{J_{{\rm{SiO}} - {\rm{vap}}}}} \right|} \right){V_{{\rm{Si}}{{\rm{O}}_2}}} - {{{\rm{d}}{h_{{\rm{ox}}}}} \over {{\rm{d}}t}}{f_{\rm{g}}}\quad ,$$
where
 ${J_{{{\rm{B}}_2}{{\rm{O}}_3} - {\rm{vap}}}}$
,
 ${J_{{\rm{Si}}{{\rm{O}}_2} - {\rm{vap}}}}$
, and
 ${J_{{\rm{SiO}} - {\rm{vap}}}}$
are the evaporation flux of B2O3, SiO2, and SiO at the surface, respectively.
 ${V_{{{\rm{B}}_2}{{\rm{O}}_3}}}$
and
 ${V_{{\rm{Si}}{{\rm{O}}_2}}}$
are the molar volume of B2O3 and SiO2, respectively.
The recession rate of ZrB2 and SiC is related to the change rate of h ox through molar volume and volume fraction.
 $${{{\rm{d}}{R_{{\rm{Zr}}{{\rm{B}}_2}}}} \over {{\rm{d}}t}} = {{{V_{{\rm{Zr}}{{\rm{B}}_2}}}} \over {{V_{{\rm{Zr}}{{\rm{O}}_2}}}}}{{{f_{{\rm{Zr}}{{\rm{O}}_2}}}} \over {\left( {1 - {f_{\rm{s}}}} \right)}}{{{\rm{d}}{h_{{\rm{ox}}}}} \over {{\rm{d}}t}}\quad ,$$
 $${{{\rm{d}}{R_{{\rm{SiC}}}}} \over {{\rm{d}}t}} = {5 \over 3}{{{V_{{\rm{SiC}}}}{f_{{\rm{Zr}}{{\rm{O}}_2}}}} \over {{V_{{\rm{Zr}}{{\rm{O}}_2}}}\left( {1 - {f_{\rm{s}}}} \right)}}{{{\rm{d}}{h_{{\rm{ox}}}}} \over {{\rm{d}}t}}\quad ,$$
where
 ${V_{{\rm{Zr}}{{\rm{B}}_2}}}$
and
 ${V_{{\rm{SiC}}}}$
are the molar volume of ZrB2 and SiC, respectively.
 ${R_{{\rm{Zr}}{{\rm{B}}_2}}}$
and R
SiC are the recession thickness of ZrB2 and SiC, respectively.
Then the SiC-depleted layer thickness h SiC is easily expressed as
 $${h_{{\rm{SiC}}}} = {R_{{\rm{SiC}}}} - {R_{{\rm{Zr}}{{\rm{B}}_2}}}\quad .$$
The weight gain due to the oxidation is expressed as
 $${W_{\rm{g}}} = {h_{{\rm{ox}}}}\left( {{f_{{\rm{Zr}}{{\rm{O}}_2}}}{\rho _{{\rm{Zr}}{{\rm{O}}_2}}} + {f_{\rm{g}}}{\rho _{\rm{g}}}} \right) + {h_{\rm{g}}}{\rho _{\rm{g}}} - {R_{{\rm{SiC}}}}{f_{\rm{s}}}{\rho _{{\rm{SiC}}}} - {R_{{\rm{Zr}}{{\rm{B}}_2}}}\left( {1 - {f_{\rm{s}}}} \right){\rho _{{\rm{Zr}}{{\rm{B}}_2}}}\quad ,$$
where
 ${\rho _{{\rm{Zr}}{{\rm{O}}_2}}}$
,
 ${\rho _{{\rm{SiC}}}}$
,
 ${\rho _{{\rm{Zr}}{{\rm{B}}_2}}}$
, and
 ${\rho _{\rm{g}}}$
are the density of ZrO2, SiC, ZrB2, and borosilicate, respectively.
Ignoring the convection item, Eq. (A4) is written as
 $${{\partial {C_{{{\rm{O}}_2}}}} \over {\partial t}} = - {{\partial J_3^{{{\rm{O}}_2}}} \over {\partial {x_3}}}\quad ,$$
where
 $J_3^{{{\rm{O}}_2}}$
is the flux of oxygen in x
3 direction.
The stress-dependent chemical potential of oxygen is Reference Li69
 $${\mu _{{{\rm{O}}_2}}} = \mu _{{{\rm{O}}_2}}^0 + RT\ln \left( {{V_{\rm{m}}}{C_{{{\rm{O}}_2}}}} \right) - {\eta _{{{\rm{O}}_2}}}{V_{\rm{m}}}{\sigma _{kk}}\quad ,$$
where R and T are the gas constant and absolute temperature, respectively.
 ${\eta _{{{\rm{O}}_2}}}$
and
 ${\sigma _{kk}}$
are the coefficient of compositional expansion and hydrostatic stress in the oxide layer.
 $\mu _{{{\rm{O}}_2}}^0$
is the chemical potential at the reference state.
The oxygen flux is expressed as
 $$J_3^{{{\rm{O}}_2}} = - {{{D_{{{\rm{O}}_2} - {\rm{g}}}}{C_{{{\rm{O}}_2}}}} \over {RT}}{{\partial {\mu _{{{\rm{O}}_2}}}} \over {\partial {x_3}}} = - {D_{{{\rm{O}}_2} - {\rm{g}}}\left( {{{\partial {C_{{{\rm{O}}_2}}}} \over {\partial {x_3}}} - {{{\eta _{{{\rm{O}}_2}}}{V_{\rm{m}}}} \over {RT}}{C_{{{\rm{O}}_2}}}{{\partial {\sigma _{kk}}} \over {\partial {x_3}}}} \right)\quad ,$$
where
 ${D_{{{\rm{O}}_2} - {\rm{g}}}}$
is the diffusivity of oxygen in the glassy borosilicate.
Then, Eq. (A17) can be rewritten as
 $${{\partial {C_{{{\rm{O}}_2}}}} \over {\partial t}} = - {{\partial J_3^{{{\rm{O}}_2}}} \over {\partial {x_3}}} = {D_{{{\rm{O}}_2} - {\rm{g}}}}\left( {{{{\partial ^2}{C_{{{\rm{O}}_2}}}} \over {{\partial ^2}{x_3}}} - {{{\eta _{{{\rm{O}}_2}}}{V_{\rm{m}}}} \over {RT}}{{\partial {C_{{{\rm{O}}_2}}}} \over {\partial {x_3}}}{{\partial {\sigma _{kk}}} \over {\partial {x_3}}} <$$><$$>- {{{\eta _{{{\rm{O}}_2}}}{V_{\rm{m}}}{C_{{{\rm{O}}_2}}}} \over {RT}}{{{\partial ^2}{\sigma _{kk}}} \over {{\partial ^2}{x_3}}}} \right\bigg)\quad .$$
Since the chemical potential is stress-dependent, the chemical reaction is stress-dependent too. The stress-dependent chemical reaction rate constant is expressed as Reference Zhou, Qu and Cherkaoui54,Reference Swaminathan, Qu and Sun70
 $${k_1} = k_1^0\exp \left( {{{{\eta _{\rm{p}}}{V_{\rm{m}}}{\sigma _{kk}}} \over {RT}}} \right)\quad ,$$
where p represents the oxide.
 $k_1^0$
is the chemical reaction rate constant when there is no stress.
Stress-dependent chemical reaction rate is
 $${\dot w_1} = k_1^0\exp \left( {{{{\eta _{\rm{p}}}{V_{\rm{m}}}{\sigma _{kk}}} \over {RT}}} \right){\left( {C_{{{\rm{O}}_2}}^{i2}} \right)^{{5 \mathord{\left/ {\vphantom {5 2}} \right. \kern-\nulldelimiterspace} 2}}}\quad ,$$
 $${\dot w_2} = {5 \over 3}{{{f_{\rm{s}}}} \over {1 - {f_{\rm{s}}}}}k_1^0\exp \left( {{{{\eta _{\rm{p}}}{V_{\rm{m}}}{\sigma _{kk}}} \over {RT}}} \right){\left( {C_{{{\rm{O}}_2}}^{i2}} \right)^{{5 \mathord{\left/ {\vphantom {5 2}} \right. \kern-\nulldelimiterspace} 2}}}\quad .$$
Substituting Eqs. (A22) and (A23) into Eqs. (A11) and (A12), they are rewritten as
 $${{{\rm{d}}{h_{{\rm{ox}}}}} \over {{\rm{d}}t}} = {{{V_{{\rm{Zr}}{{\rm{O}}_2}}}} \over {{f_{{\rm{Zr}}{{\rm{O}}_2}}}}}k_1^0\exp \left( {{{{\eta _{\rm{p}}}{V_{\rm{m}}}{\sigma _{kk}}} \over {RT}}} \right){\left( {C_{{{\rm{O}}_2}}^{i2}} \right)^{{5 \mathord{\left/ {\vphantom {5 2}} \right. \kern-\nulldelimiterspace} 2}}}\quad ,$$
 $$\eqalign{ & {{{\rm{d}}{h_{\rm{g}}}} \over {{\rm{d}}t}} = \left\Bigg[ {k_1^0\exp \left( {{{{\eta _{\rm{p}}}{V_{\rm{m}}}{\sigma _{kk}}} \over {RT}}} \right){{\left( {C_{{{\rm{O}}_2}}^{i2}} \right)}^{{5 \mathord{\left/ {\vphantom {5 2}} \right. \kern-\nulldelimiterspace} 2}}} - \left| {{J_{{{\rm{B}}_2}{{\rm{O}}_3} - {\rm{vap}}}}} \right|} \right\Bigg]{V_{{{\rm{B}}_2}{{\rm{O}}_3}}} \cr & \;\;\;\;\;\;\;\;\;\; + \left\Bigg[ {{5 \over 3}{{{f_{\rm{s}}}} \over {1 - {f_{\rm{s}}}}}k_1^0\exp \left( {{{{\eta _{\rm{p}}}{V_{\rm{m}}}{\sigma _{kk}}} \over {RT}}} \right){{\left( {C_{{{\rm{O}}_2}}^{i2}} \right)}^{{5 \mathord{\left/ {\vphantom {5 2}} \right. \kern-\nulldelimiterspace} 2}}} \cr & <$$><$$>- \left| {{J_{{\rm{Si}}{{\rm{O}}_2} - {\rm{vap}}}}} \right| - \left| {{J_{{\rm{SiO}} - {\rm{vap}}}}} \right|} \right\Bigg]{V_{{\rm{Si}}{{\rm{O}}_2}}} \cr & - {{{\rm{d}}{h_{{\rm{ox}}}}} \over {{\rm{d}}t}}{f_{\rm{g}}}\quad . \cr}$$
The evaporation flux at the surface is express as follows
 $$\eqalignb{ & \left| {{J_{{\rm{species - vap}}}}} \right| = {{{D_{{\rm{species}}}}} \over {RT}}{10^5}{{{p_{{\rm{species - vap}}}}} \over {{\delta _{{\rm{bdry}}}}}}; \cr & {\delta _{{\rm{bdry}}}} = {3 \over 2}\sqrt {{{{l_{{\rm{specimen}}}}} \over {{v_{{\rm{fluid}}}}}}} {\left( {{{{\eta _{{\rm{fluid}}}}} \over {{\rho _{{\rm{fluid}}}}}}} \right)^{{1 \mathord{\left/ {\vphantom {1 6}} \right. \kern-\nulldelimiterspace} 6}}}{\left( {{D_{{\rm{species}}}}} \right)^{{1 \mathord{\left/ {\vphantom {1 3}} \right. \kern-\nulldelimiterspace} 3}}}\quad , \cr}$$
where
 ${D_{{\rm{species}}}}$
is the diffusivity in mixed gas.
 ${p_{{\rm{species - vap}}}}$
is the evaporation pressure. Species refers to SiO2, B2O3, and SiO.
 ${\delta _{{\rm{bdry}}}}$
is the boundary layer thickness.
 ${l_{{\rm{specimen}}}}$
is the length of the specimen.
 ${v_{{\rm{fluid}}}}$
,
 ${\eta _{{\rm{fluid}}}}$
, and
 ${\rho _{{\rm{fluid}}}}$
are the velocity, viscosity, and density of the ambient fluid, respectively.
According to Eq. (A6), the moving boundary condition of the interface 2 is
 $$\!\!\!\!\!\eqalignb{ & J_3^{{{\rm{O}}_2},i2} = {f_{\rm{g}}}C_{{{\rm{O}}_2}}^{i2}V + {5 \over 2}{{\dot w}_1} + {3 \over 2}{{\dot w}_2} \cr & \;\;\;\;\;\;\;\; = {f_{\rm{g}}}C_{{{\rm{O}}_2}}^{i2}{{{V_{{\rm{Zr}}{{\rm{O}}_2}}}} \over {{f_{{\rm{Zr}}{{\rm{O}}_2}}}}}k_1^0\exp \left( {{{{\eta _{\rm{p}}}{V_{\rm{m}}}{\sigma _{kk}}} \over {RT}}} \right){\left( {C_{{{\rm{O}}_2}}^{i2}} \right)^{{5 \mathord{\left/ {\vphantom {5 2}} \right. \kern-\nulldelimiterspace} 2}}} \cr & \;\;\;\;\;\;\;\;\;\;\; + {1 \over {1 - {f_{\rm{s}}}}}{5 \over 2}k_1^0\exp \left( {{{{\eta _{\rm{p}}}{V_{\rm{m}}}{\sigma _{kk}}} \over {RT}}} \right){\left( {C_{{{\rm{O}}_2}}^{i2}} \right)^{{5 \mathord{\left/ {\vphantom {5 2}} \right. \kern-\nulldelimiterspace} 2}}}\quad , \cr}$$
where
 $J_3^{{{\rm{O}}_2},i2}$
is the oxygen flux at the interface 2.
 $V$
is the velocity of the interface 2 and is expressed as
 $$V = {{{\rm{d}}{h_{{\rm{ox}}}}} \over {{\rm{d}}t}}\quad .$$
At the interface 3, the flux of the oxygen is equal.
 $$J_3^{{{\rm{O}}_2},i3 + } = J_3^{{{\rm{O}}_2},i3 - }$$
Since the quasi-steady state is assumed, the oxygen flux can be expressed as
 $$J_3^{{{\rm{O}}_2},i3 + } = {D_{3a}}{{C_{{{\rm{O}}_2}}^a - C_{{{\rm{O}}_2}}^{i3}} \over {{h_g}}}\quad ,$$
 $$J_3^{{{\rm{O}}_2},i3 - } = {D_{23}}{{C_{{{\rm{O}}_2}}^{i3} - C_{{{\rm{O}}_2}}^{i2}} \over {{h_{{\rm{ox}}}}}}{f_{\rm{g}}}\quad ,$$
where
 ${D_{23}}$
and
 ${D_{3a}}$
are the oxygen diffusivity in the region (2–3) and region (3–a), respectively. Since B2O3 evaporates much faster than SiO2 at the surface, the glassy layer contains more SiO2 than borosilicate filled in the porous channels. As a result, the diffusivity for oxygen in region (2–3) is different from that in region (3–a).
 $C_{{{\rm{O}}_2}}^{i3}$
and
 $C_{{{\rm{O}}_2}}^a$
are the oxygen concentration at the interface 3 and a, respectively.
 $C_{{{\rm{O}}_2}}^a$
is expressed as
 $$C_{{{\rm{O}}_2}}^a = p_{{{\rm{O}}_2}}^aS\quad ,$$
where
 $p_{{{\rm{O}}_2}}^a$
and
 $S$
are the oxygen partial pressure at the air interface and solubility of oxygen in the glassy borosilicate.
Substituting Eqs. (A30) and (A31) into Eq. (A29), we obtain
 $$C_{{{\rm{O}}_2}}^{i3} = {{{D_{3a}}{h_{{\rm{ox}}}}C_{{{\rm{O}}_2}}^a + {D_{23}}{f_{\rm{g}}}{h_{\rm{g}}}C_{{{\rm{O}}_2}}^{i2}} \over {{D_{23}}{f_{\rm{g}}}{h_{\rm{g}}} + {D_{3a}}{h_{{\rm{ox}}}}}}\quad ,$$
and then we get the oxygen flux at the moving boundary
 $$J_3^{{{\rm{O}}_2},i2} = {D_{23}}{f_{\rm{g}}}{{C_{{{\rm{O}}_2}}^{i3} - C_{{{\rm{O}}_2}}^{i2}} \over {{h_{{\rm{ox}}}}}}\quad .$$
Solving Eqs. (A27), (A33), and (A34) simultaneously, we obtain the oxygen concentration at the interface 2,
 $C_{{{\rm{O}}_2}}^{i2}$
.
Accompanying the oxide layer growth, the stress is produced. Based on Clarke’s assumption, Reference Clarke44,Reference Suo and Shen71 the lateral growth strain is proportional to the oxide layer thickness.
 $$\varepsilon _{{\rm{ox}}}^{\rm{g}} = {D_{{\rm{ox}}}}{h_{{\rm{ox}}}}\quad ,$$
where
 ${D_{{\rm{ox}}}}$
is the lateral growth coefficient.
The elastic strain is
 $$\varepsilon _i^{\rm{e}} = {{1 - {v_i}} \over {{E_i}}}{\sigma _i}\quad ,$$
where i can be replaced by ox for oxide and sub for substrate.
 ${\nu _i}$
,
 ${E_i}$
, and
 ${\sigma _i}$
are the Poisson ratio, Young’s modulus and plane stress, respectively.
For the porous oxide layer, the relationship between Yong’s modulus and porosity is Reference Li, Li, Zhang and Fang61
 $${E_{{\rm{ox}}}} = {{E_{{\rm{ox}}}^0} \over {1 + {{4{f_{\rm{g}}}\left( {1 - v_{{\rm{ox}}}^2} \right)} \over \pi }}}\quad ,$$
where
 $E_{{\rm{ox}}}^0$
is the Yong’s modulus of oxide when there is no pore.
For the high-temperature oxidation, the creep effect should be taken into account. Here, Norton’s creep power law Reference Golan, Arbel, Eliezer and Moreno72 is adopted in the work.
 $$\dot \varepsilon _i^c = {\rm{sign}}({\sigma _i}){B_i}\exp \left( { - {{{Q_i}} \over {RT}}} \right){\left| {{\sigma _i}} \right|^{{n_i}}}\quad ,$$
where B, Q, and n are the material constant, activation energy for creep process and the stress exponent, respectively. Since the stress is compressive in the oxide layer and tensile in the substrate,
 ${\rm{sign}}({\sigma _{{\rm{ox}}}}) = - 1$
and
 ${\rm{sign}}({\sigma _{{\rm{sub}}}}) = 1$
.
The total strain in the oxide and substrate is expressed, respectively, as
 $${\varepsilon _{{\rm{ox}}}} = \varepsilon _{{\rm{ox}}}^{\rm{g}} + \varepsilon _{{\rm{ox}}}^{\rm{e}} + \varepsilon _{{\rm{ox}}}^{\rm{c}}\quad ,$$
 $${\varepsilon _{{\rm{sub}}}} = \varepsilon _{{\rm{sub}}}^{\rm{e}} + \varepsilon _{{\rm{sub}}}^{\rm{c}}\quad .$$
For the cracking, bulking and spalling are not taken into account in the work, the strain in the oxide and substrate should be compatible.
 $$\varepsilon _{{\rm{ox}}}^{\rm{g}} + \varepsilon _{{\rm{ox}}}^{\rm{e}} + \varepsilon _{{\rm{ox}}}^{\rm{c}} = \varepsilon _{{\rm{sub}}}^{\rm{e}} + \varepsilon _{{\rm{sub}}}^{\rm{c}}$$
The rate of Eq. (A41) is
 $$\dot \varepsilon _{{\rm{ox}}}^{\rm{g}} + \dot \varepsilon _{{\rm{ox}}}^{\rm{e}} + \dot \varepsilon _{{\rm{ox}}}^{\rm{c}} = \dot \varepsilon _{{\rm{sub}}}^{\rm{e}} + \dot \varepsilon _{{\rm{sub}}}^{\rm{c}}\quad .$$
Substituting Eqs. (A35), (A36) and (A38) into Eq. (A42), we obtain
 $$\eqalign{ & {D_{{\rm{ox}}}}{{\dot h}_{{\rm{ox}}}} + {{1 - {v_{{\rm{ox}}}}} \over {{E_{{\rm{ox}}}}}}{{\dot \sigma }_{{\rm{ox}}}} - {{1 - {v_{{\rm{ox}}}}} \over {E_{{\rm{ox}}}^2}}{{\dot E}_{{\rm{ox}}}}{\sigma _{{\rm{ox}}}} <$$><$$>- {B_{{\rm{ox}}}}\exp \left( { - {{{Q_{{\rm{ox}}}}} \over {RT}}} \right){\left( { - {\sigma _{{\rm{ox}}}}} \right)^{{n_{{\rm{ox}}}}}} = {{1 - {v_{{\rm{sub}}}}} \over {{E_{{\rm{sub}}}}}}{{\dot \sigma }_{{\rm{sub}}}} <$$><$$>+ {B_{{\rm{sub}}}}\exp \left( { - {{{Q_{{\rm{sub}}}}} \over {RT}}} \right){\left( {{\sigma _{{\rm{sub}}}}} \right)^{{n_{{\rm{sub}}}}}}\quad . \cr}$$
The force equilibrium equation is
 $$\int_{{h_{{\rm{ox}}}}} {{\sigma _{{\rm{ox}}}}\,{\rm{d}}h} + \int_{{h_{{\rm{sub}}}}} {{\sigma _{{\rm{sub}}}}\,{\rm{d}}h} = 0,\;{\rm{i}}{\rm{.e}}{\rm{.}},\;{\sigma _{{\rm{ox}}}}{h_{{\rm{ox}}}} + {\sigma _{{\rm{sub}}}}{h_{{\rm{sub}}}} = 0\quad ,$$
where
 ${h_{{\rm{sub}}}}$
is the thickness of substrate. In the work, we deal with the average stress in the oxide and substrate. From Eq. (A44),
 ${\sigma _{{\rm{sub}}}}$
can be expressed as
 $${\sigma _{{\rm{sub}}}} = {{ - {\sigma _{{\rm{ox}}}}{h_{{\rm{ox}}}}} \mathord{\left/ {\vphantom {{ - {\sigma _{{\rm{ox}}}}{h_{{\rm{ox}}}}} {{h_{{\rm{sub}}}}}}} \right. \kern-\nulldelimiterspace} {{h_{{\rm{sub}}}}}}\quad .$$
The rate of Eq. (A45) is
 $${\dot \sigma _{{\rm{sub}}}} = {{ - {{\dot \sigma }_{{\rm{ox}}}}{h_{{\rm{ox}}}}} \mathord{\left/ {\vphantom {{ - {{\dot \sigma }_{{\rm{ox}}}}{h_{{\rm{ox}}}}} {{h_{{\rm{sub}}}}}}} \right. \kern-\nulldelimiterspace} {{h_{{\rm{sub}}}}}} - {\sigma _{{\rm{ox}}}}{{{{\dot h}_{{\rm{ox}}}}{h_{{\rm{sub}}}} - {h_{{\rm{ox}}}}{{\dot h}_{{\rm{sub}}}}} \over {h_{{\rm{sub}}}^{\rm{2}}}}\quad .$$
Substituting Eqs. (A45) and (A46) into Eq. (A43), we obtain
 $$\eqalign{ & {D_{{\rm{ox}}}}{{\dot h}_{{\rm{ox}}}} + {{1 - {v_{{\rm{ox}}}}} \over {{E_{{\rm{ox}}}}}}{{\dot \sigma }_{{\rm{ox}}}} - {{1 - {v_{{\rm{ox}}}}} \over {E_{{\rm{ox}}}^2}}{{\dot E}_{{\rm{ox}}}}{\sigma _{{\rm{ox}}}} - {B_{{\rm{ox}}}}\exp \left( { - {{{Q_{{\rm{ox}}}}} \over {RT}}} \right)<$$><$$>{\left( { - {\sigma _{{\rm{ox}}}}} \right)^{{n_{{\rm{ox}}}}}} \cr & <$$><$$>= - {{1 - {v_{{\rm{sub}}}}} \over {{E_{{\rm{sub}}}}}}\left( {{{{{\dot \sigma }_{{\rm{ox}}}}{h_{{\rm{ox}}}}} \mathord{\left/ {\vphantom {{{{\dot \sigma }_{{\rm{ox}}}}{h_{{\rm{ox}}}}} {{h_{{\rm{sub}}}}}}} \right. \kern-\nulldelimiterspace} {{h_{{\rm{sub}}}}}} + {\sigma _{{\rm{ox}}}}{{{{\dot h}_{{\rm{ox}}}}{h_{{\rm{sub}}}} - {h_{{\rm{ox}}}}{{\dot h}_{{\rm{sub}}}}} \over {h_{{\rm{sub}}}^2}}} \right) <$$><$$>\cr & \;\;\; + {B_{{\rm{sub}}}}\exp \left( { - {{{Q_{{\rm{sub}}}}} \over {RT}}} \right){\left( { - {{{\sigma _{{\rm{ox}}}}{h_{{\rm{ox}}}}} \mathord{\left/ {\vphantom {{{\sigma _{{\rm{ox}}}}{h_{{\rm{ox}}}}} {{h_{{\rm{sub}}}}}}} \right. \kern-\nulldelimiterspace} {{h_{{\rm{sub}}}}}}} \right)^{{n_{{\rm{sub}}}}}}\quad . \cr}$$
Rearranging Eq. (A47), we get
 $${\dot \sigma _{{\rm{ox}}}} = {{\left[ {{B_{{\rm{ox}}}}\exp \left( { - {{{Q_{{\rm{ox}}}}} \over {RT}}} \right){{\left( { - {\sigma _{{\rm{ox}}}}} \right)}^{{n_{{\rm{ox}}}}}} + {B_{{\rm{sub}}}}\exp \left( { - {{{Q_{{\rm{sub}}}}} \over {RT}}} \right){{\left( {{{ - {\sigma _{{\rm{ox}}}}{h_{{\rm{ox}}}}} \mathord{\left/ {\vphantom {{ - {\sigma _{{\rm{ox}}}}{h_{{\rm{ox}}}}} {{h_{{\rm{sub}}}}}}} \right. \kern-\nulldelimiterspace} {{h_{{\rm{sub}}}}}}} \right)}^{{n_{{\rm{sub}}}}}} <$$><$$>+ \left( {{{1 - {v_{{\rm{ox}}}}} \over {E_{{\rm{ox}}}^{\rm{2}}}}{{\dot E}_{{\rm{ox}}}} - {{1 - {v_{{\rm{sub}}}}} \over {{E_{{\rm{sub}}}}}}{{{{\dot h}_{{\rm{ox}}}}{h_{{\rm{sub}}}} - {h_{{\rm{ox}}}}{{\dot h}_{{\rm{sub}}}}} \over {h_{{\rm{sub}}}^2}}} \right){\sigma _{{\rm{ox}}}} - {D_{{\rm{ox}}}}{{\dot h}_{{\rm{ox}}}}} \right\bigg]} \mathord{\left/ {\vphantom {{\left[ {{B_{{\rm{ox}}}}\exp \left( { - {{{Q_{{\rm{ox}}}}} \over {RT}}} \right){{\left( { - {\sigma _{{\rm{ox}}}}} \right)}^{{n_{{\rm{ox}}}}}} + {B_{{\rm{sub}}}}\exp \left( { - {{{Q_{{\rm{sub}}}}} \over {RT}}} \right){{\left( {{{ - {\sigma _{{\rm{ox}}}}{h_{{\rm{ox}}}}} \mathord{\left/ {\vphantom {{ - {\sigma _{{\rm{ox}}}}{h_{{\rm{ox}}}}} {{h_{{\rm{sub}}}}}}} \right. \kern-\nulldelimiterspace} {{h_{{\rm{sub}}}}}}} \right)}^{{n_{{\rm{sub}}}}}} + \left( {{{1 - {v_{{\rm{ox}}}}} \over {E_{{\rm{ox}}}^{\rm{2}}}}{{\dot E}_{{\rm{ox}}}} - {{1 - {v_{{\rm{sub}}}}} \over {{E_{{\rm{sub}}}}}}{{{{\dot h}_{{\rm{ox}}}}{h_{{\rm{sub}}}} - {h_{{\rm{ox}}}}{{\dot h}_{{\rm{sub}}}}} \over {h_{{\rm{sub}}}^2}}} \right){\sigma _{{\rm{ox}}}} - {D_{{\rm{ox}}}}{{\dot h}_{{\rm{ox}}}}} \right]} {\left( {{{1 - {v_{{\rm{ox}}}}} \over {{E_{{\rm{ox}}}}}} + {{{{1 - {v_{{\rm{sub}}}}} \over {{E_{{\rm{sub}}}}}}{h_{{\rm{ox}}}}} \mathord{\left/ {\vphantom {{{{1 - {v_{{\rm{sub}}}}} \over {{E_{{\rm{sub}}}}}}{h_{{\rm{ox}}}}} {{h_{{\rm{sub}}}}}}} \right. \kern-\nulldelimiterspace} {{h_{{\rm{sub}}}}}}} \right)}}} \right. \kern-\nulldelimiterspace} <$$><$$>{\left( {{{1 - {v_{{\rm{ox}}}}} \over {{E_{{\rm{ox}}}}}} + {{{{1 - {v_{{\rm{sub}}}}} \over {{E_{{\rm{sub}}}}}}{h_{{\rm{ox}}}}} \mathord{\left/ {\vphantom {{{{1 - {v_{{\rm{sub}}}}} \over {{E_{{\rm{sub}}}}}}{h_{{\rm{ox}}}}} {{h_{{\rm{sub}}}}}}} \right. \kern-\nulldelimiterspace} {{h_{{\rm{sub}}}}}}} \right)}}\quad .$$
In the same way, we get
 $${\dot \sigma _{{\rm{sub}}}} = {{\left[ {{B_{{\rm{ox}}}}\exp \left( { - {{{Q_{{\rm{ox}}}}} \over {RT}}} \right){{\left( {{{{\sigma _{{\rm{sub}}}}{h_{{\rm{sub}}}}} \mathord{\left/ {\vphantom {{{\sigma _{{\rm{sub}}}}{h_{{\rm{sub}}}}} {{h_{{\rm{ox}}}}}}} \right. \kern-\nulldelimiterspace} {{h_{{\rm{ox}}}}}}} \right)}^{{n_{{\rm{ox}}}}}} + {B_{{\rm{sub}}}}\exp \left( { - {{{Q_{{\rm{sub}}}}} \over {RT}}} \right){{\left( {{\sigma _{{\rm{sub}}}}} \right)}^{{n_{{\rm{sub}}}}}} <$$><$$>+ \left( {{{1 - {v_{{\rm{ox}}}}} \over {{E_{{\rm{ox}}}}}}{{{{\dot h}_{{\rm{sub}}}}{h_{{\rm{ox}}}} - {h_{{\rm{sub}}}}{{\dot h}_{{\rm{ox}}}}} \over {h_{{\rm{ox}}}^2}} - {{{{1 - {v_{{\rm{ox}}}}} \over {E_{{\rm{ox}}}^2}}{{\dot E}_{{\rm{ox}}}}{h_{{\rm{sub}}}}} \mathord{\left/ {\vphantom {{{{1 - {v_{{\rm{ox}}}}} \over {E_{{\rm{ox}}}^2}}{{\dot E}_{{\rm{ox}}}}{h_{{\rm{sub}}}}} {{h_{{\rm{ox}}}}}}} \right. \kern-\nulldelimiterspace} {{h_{{\rm{ox}}}}}}} \right){\sigma _{{\rm{sub}}}} <$$><$$>- {D_{{\rm{ox}}}}{{\dot h}_{{\rm{ox}}}}}{\left{\vphantom{{Q_{ox}}\over {RT}}} \right]}} \mathord{\left/ {\vphantom {{\left[ {{B_{{\rm{ox}}}}\exp \left( { - {{{Q_{{\rm{ox}}}}} \over {RT}}} \right){{\left( {{{{\sigma _{{\rm{sub}}}}{h_{{\rm{sub}}}}} \mathord{\left/ {\vphantom {{{\sigma _{{\rm{sub}}}}{h_{{\rm{sub}}}}} {{h_{{\rm{ox}}}}}}} \right. \kern-\nulldelimiterspace} {{h_{{\rm{ox}}}}}}} \right)}^{{n_{{\rm{ox}}}}}} + {B_{{\rm{sub}}}}\exp \left( { - {{{Q_{{\rm{sub}}}}} \over {RT}}} \right){{\left( {{\sigma _{{\rm{sub}}}}} \right)}^{{n_{{\rm{sub}}}}}} + \left( {{{1 - {v_{{\rm{ox}}}}} \over {{E_{{\rm{ox}}}}}}{{{{\dot h}_{{\rm{sub}}}}{h_{{\rm{ox}}}} - {h_{{\rm{sub}}}}{{\dot h}_{{\rm{ox}}}}} \over {h_{{\rm{ox}}}^2}} - {{{{1 - {v_{{\rm{ox}}}}} \over {E_{{\rm{ox}}}^2}}{{\dot E}_{{\rm{ox}}}}{h_{{\rm{sub}}}}} \mathord{\left/ {\vphantom {{{{1 - {v_{{\rm{ox}}}}} \over {E_{{\rm{ox}}}^2}}{{\dot E}_{{\rm{ox}}}}{h_{{\rm{sub}}}}} {{h_{{\rm{ox}}}}}}} \right. \kern-\nulldelimiterspace} {{h_{{\rm{ox}}}}}}} \right){\sigma _{{\rm{sub}}}} - {D_{{\rm{ox}}}}{{\dot h}_{{\rm{ox}}}}} \right]} {\left( {{{ - {{1 - {v_{{\rm{ox}}}}} \over {{E_{{\rm{ox}}}}}}{h_{{\rm{sub}}}}} \mathord{\left/ {\vphantom {{ - {{1 - {v_{{\rm{ox}}}}} \over {{E_{{\rm{ox}}}}}}{h_{{\rm{sub}}}}} {{h_{ox}} - {{1 - {v_{{\rm{sub}}}}} \over {{E_{{\rm{sub}}}}}}}}} \right. \kern-\nulldelimiterspace} {{h_{ox}} - {{1 - {v_{{\rm{sub}}}}} \over {{E_{{\rm{sub}}}}}}}}} \right)}}} \right. \kern-\nulldelimiterspace} {\left( {{{ - {{1 - {v_{{\rm{ox}}}}} \over {{E_{{\rm{ox}}}}}}{h_{{\rm{sub}}}}} \mathord{\left/ {\vphantom {{ - {{1 - {v_{{\rm{ox}}}}} \over {{E_{{\rm{ox}}}}}}{h_{{\rm{sub}}}}} {{h_{ox}} - {{1 - {v_{{\rm{sub}}}}} \over {{E_{{\rm{sub}}}}}}}}} \right. \kern-\nulldelimiterspace} {{h_{ox}} - {{1 - {v_{{\rm{sub}}}}} \over {{E_{{\rm{sub}}}}}}}}} \right)}}\quad .$$
The equations can be calculated by the evolutionary algorithm by assuming an initial thickness of
 ${h_{{\rm{ox}}}}$
and
 ${h_{\rm{g}}}$
.
The variation of pore radius r and borosilicate volume fraction f g is
 $$r = {r^0}\left( {1 + {\varepsilon _{{\rm{pore}}}}} \right)\quad ,$$
 $${f_{\rm{g}}} = f_{\rm{g}}^0{\left( {1 + {\varepsilon _{{\rm{pore}}}}} \right)^2}\quad ,$$
where
 ${r^0}$
and
 $f_{\rm{g}}^0$
are the pore radius and glassy borosilicate volume fraction when there is no stress.
The relationship between the macroscopic strain and the microscopic strain in the pore is expressed as Reference Dormieux, Kondo and Ulm73
 $${\boldvarepsilon_{{\rm{pore}}}} = {({\bf{I}} - {\bf{S}})^{ - 1}}:{\bf{E}}\quad ,$$
where I is the forth-order identity tensor. S is the Eshelby tensor. E is the macroscopic strain. If the effect of lateral growth strain on the pore strain is neglected, the pore strain is
 $${{\bf{\boldvarepsilon }}_{{\rm{pore}}}} = {({\bf{I}} - {\bf{S}})^{ - 1}}:\left( {{\bf{\boldvarepsilon }}_{{\rm{ox}}}^{\rm{e}} + {\bf{\boldvarepsilon }}_{{\rm{ox}}}^{\rm{c}}} \right)\quad .$$
To implement the model, the equations can be rewritten in incremental forms with respect to incremental time,
 $\Delta t$
. Eqs. (A24) and (A25) are rewritten as
 $$\Delta {h_{{\rm{ox}}}} = {{{V_{{\rm{Zr}}{{\rm{O}}_2}}}} \over {{f_{{\rm{Zr}}{{\rm{O}}_2}}}}}k_1^0\exp \left( {{{{\eta _{\rm{p}}}{V_{\rm{m}}}{\sigma _{kk}}} \over {RT}}} \right){\left( {C_{{{\rm{O}}_2}}^{i2}} \right)^{{5 \mathord{\left/ {\vphantom {5 2}} \right. \kern-\nulldelimiterspace} 2}}}\Delta t\quad ,$$
 $$\eqalignb{ & \Delta {h_{\rm{g}}} = \left\Bigg[ {k_1^0\exp \left( {{{{\eta _{\rm{p}}}{V_{\rm{m}}}{\sigma _{kk}}} \over {RT}}} \right){{\left( {C_{{{\rm{O}}_2}}^{i2}} \right)}^{{5 \mathord{\left/ {\vphantom {5 2}} \right. \kern-\nulldelimiterspace} 2}}} - \left| {{J_{{{\rm{B}}_2}{{\rm{O}}_3} - {\rm{vap}}}}} \right|} \right\Bigg]{V_{{{\rm{B}}_2}{{\rm{O}}_3}}}\Delta t \cr & \;\;\;\;\;\;\;\;\;\; + \left\Bigg[ {{5 \over 3}{{{f_{\rm{s}}}} \over {1 - {f_{\rm{s}}}}}k_1^0\exp \left( {{{{\eta _{\rm{p}}}{V_{\rm{m}}}{\sigma _{kk}}} \over {RT}}} \right){{\left( {C_{{{\rm{O}}_2}}^{i2}} \right)}^{{5 \mathord{\left/ {\vphantom {5 2}} \right. \kern-\nulldelimiterspace} 2}}} <$$><$$>- \left| {{J_{{\rm{Si}}{{\rm{O}}_2} - {\rm{vap}}}}} \right| - \left| {{J_{{\rm{SiO}} - {\rm{vap}}}}} \right|} \right\Bigg]{V_{{\rm{Si}}{{\rm{O}}_2}}}\Delta t - \Delta {h_{{\rm{ox}}}}{f_{\rm{g}}}\quad . \cr}$$
The thickness at
 ${t^{(k + 1)}}$
can be easily obtained as
 $$h_{{\rm{ox}}}^{(k + 1)} = h_{{\rm{ox}}}^{(k)} + \Delta {h_{{\rm{ox}}}}\quad ,$$
 $$h_{\rm{g}}^{(k + 1)} = h_{\rm{g}}^{(k)} + \Delta {h_{\rm{g}}}\quad .$$
In the same way, Eqs. (A48) and (A49) are rewritten as
 $$\Delta {\sigma _{{\rm{ox}}}} = {{\left[ {{B_{{\rm{ox}}}}\exp \left( { - {{{Q_{{\rm{ox}}}}} \over {RT}}} \right){{\left( { - \sigma _{{\rm{ox}}}^{(k)}} \right)}^{{n_{{\rm{ox}}}}}}\Delta t + {B_{{\rm{sub}}}}\exp \left( { - {{{Q_{{\rm{sub}}}}} \over {RT}}} \right)<$$><$$>{{\left( {{{ - \sigma _{{\rm{ox}}}^{(k)}h_{{\rm{ox}}}^{(k)}} \mathord{\left/ {\vphantom {{ - \sigma _{{\rm{ox}}}^{(k)}h_{{\rm{ox}}}^{(k)}} {h_{{\rm{sub}}}^{(k)}}}} \right. \kern-\nulldelimiterspace} {h_{{\rm{sub}}}^{(k)}}}} \right)}^{{n_{{\rm{sub}}}}}}\Delta t + \left( {{{1 - {v_{{\rm{ox}}}}} \over {E_{{\rm{ox}}}^2}}\Delta {E_{{\rm{ox}}}} <$$><$$>- {{1 - {v_{{\rm{sub}}}}} \over {{E_{{\rm{sub}}}}}}{{\Delta {h_{{\rm{ox}}}}h_{{\rm{sub}}}^{(k)} - h_{{\rm{ox}}}^{(k)}\Delta {h_{{\rm{sub}}}}} \over {{{\left( {h_{{\rm{sub}}}^{(k)}} \right)}^2}}}} \right\bigg)\sigma _{{\rm{ox}}}^{(k)} - {D_{{\rm{ox}}}}\Delta {h_{{\rm{ox}}}}} \right\bigg]} \mathord{\left/ {\vphantom {{\left[ {{B_{{\rm{ox}}}}\exp \left( { - {{{Q_{{\rm{ox}}}}} \over {RT}}} \right){{\left( { - \sigma _{{\rm{ox}}}^{(k)}} \right)}^{{n_{{\rm{ox}}}}}}\Delta t + {B_{{\rm{sub}}}}\exp \left( { - {{{Q_{{\rm{sub}}}}} \over {RT}}} \right){{\left( {{{ - \sigma _{{\rm{ox}}}^{(k)}h_{{\rm{ox}}}^{(k)}} \mathord{\left/ {\vphantom {{ - \sigma _{{\rm{ox}}}^{(k)}h_{{\rm{ox}}}^{(k)}} {h_{{\rm{sub}}}^{(k)}}}} \right. \kern-\nulldelimiterspace} {h_{{\rm{sub}}}^{(k)}}}} \right)}^{{n_{{\rm{sub}}}}}}\Delta t + \left( {{{1 - {v_{{\rm{ox}}}}} \over {E_{{\rm{ox}}}^2}}\Delta {E_{{\rm{ox}}}} - {{1 - {v_{{\rm{sub}}}}} \over {{E_{{\rm{sub}}}}}}{{\Delta {h_{{\rm{ox}}}}h_{{\rm{sub}}}^{(k)} - h_{{\rm{ox}}}^{(k)}\Delta {h_{{\rm{sub}}}}} \over {{{\left( {h_{{\rm{sub}}}^{(k)}} \right)}^2}}}} \right)\sigma _{{\rm{ox}}}^{(k)} - {D_{{\rm{ox}}}}\Delta {h_{{\rm{ox}}}}} \right]} {\left( {{{1 - {v_{{\rm{ox}}}}} \over {{E_{{\rm{ox}}}}}} + {{1 - {v_{{\rm{sub}}}}} \over {{E_{{\rm{sub}}}}}}h_{{\rm{ox}}}^{(k)}/h_{{\rm{sub}}}^{(k)}} \right)\quad ,}}} \right. \kern-\nulldelimiterspace} <$$><$$>{\left( {{{1 - {v_{{\rm{ox}}}}} \over {{E_{{\rm{ox}}}}}} + {{1 - {v_{{\rm{sub}}}}} \over {{E_{{\rm{sub}}}}}}h_{{\rm{ox}}}^{(k)}\bigg/h_{{\rm{sub}}}^{(k)}} \right)\quad ,}}$$
 $$\Delta {\sigma _{{\rm{sub}}}} = {{\left[ {{B_{{\rm{ox}}}}\exp \left( { - {{{Q_{{\rm{ox}}}}} \over {RT}}} \right){{\left( {{{\sigma _{{\rm{sub}}}^{(k)}h_{{\rm{sub}}}^{(k)}} \mathord{\left/ {\vphantom {{\sigma _{{\rm{sub}}}^{(k)}h_{{\rm{sub}}}^{(k)}} {h_{{\rm{ox}}}^{(k)}}}} \right. \kern-\nulldelimiterspace} {h_{{\rm{ox}}}^{(k)}}}} \right)}^{{n_{{\rm{ox}}}}}}\Delta t <$$><$$>+ {B_{{\rm{sub}}}}\exp \left( { - {{{Q_{{\rm{sub}}}}} \over {RT}}} \right){{\left( {\sigma _{{\rm{sub}}}^{(k)}} \right)}^{{n_{{\rm{sub}}}}}}\Delta t <$$><$$>+ \left( {{{1 - {v_{{\rm{ox}}}}} \over {{E_{{\rm{ox}}}}}}{{\Delta {h_{{\rm{sub}}}}h_{{\rm{ox}}}^{(k)} - h_{{\rm{sub}}}^{(k)}\Delta {h_{{\rm{ox}}}}} \over {{{\left( {h_{{\rm{ox}}}^{(k)}} \right)}^2}}} - {{{{1 - {v_{{\rm{ox}}}}} \over {E_{{\rm{ox}}}^2}}\Delta {E_{{\rm{ox}}}}h_{{\rm{sub}}}^{(k)}} \mathord{\left/ {\vphantom {{{{1 - {v_{{\rm{ox}}}}} \over {E_{{\rm{ox}}}^2}}\Delta {E_{{\rm{ox}}}}h_{{\rm{sub}}}^{(k)}} {h_{{\rm{ox}}}^{(k)}}}} \right. \kern-\nulldelimiterspace} {h_{{\rm{ox}}}^{(k)}}}} \right)\sigma _{{\rm{sub}}}^{(k)} <$$><$$>- {D_{{\rm{ox}}}}\Delta {h_{{\rm{ox}}}}} {\left{\vphantom{{Q_{ox}}\over {RT}}} \right]}} \mathord{\left/ {\vphantom {{\left[ {{B_{{\rm{ox}}}}\exp \left( { - {{{Q_{{\rm{ox}}}}} \over {RT}}} \right){{\left( {{{\sigma _{{\rm{sub}}}^{(k)}h_{{\rm{sub}}}^{(k)}} \mathord{\left/ {\vphantom {{\sigma _{{\rm{sub}}}^{(k)}h_{{\rm{sub}}}^{(k)}} {h_{{\rm{ox}}}^{(k)}}}} \right. \kern-\nulldelimiterspace} {h_{{\rm{ox}}}^{(k)}}}} \right)}^{{n_{{\rm{ox}}}}}}\Delta t + {B_{{\rm{sub}}}}\exp \left( { - {{{Q_{{\rm{sub}}}}} \over {RT}}} \right){{\left( {\sigma _{{\rm{sub}}}^{(k)}} \right)}^{{n_{{\rm{sub}}}}}}\Delta t + \left( {{{1 - {v_{{\rm{ox}}}}} \over {{E_{{\rm{ox}}}}}}{{\Delta {h_{{\rm{sub}}}}h_{{\rm{ox}}}^{(k)} - h_{{\rm{sub}}}^{(k)}\Delta {h_{{\rm{ox}}}}} \over {{{\left( {h_{{\rm{ox}}}^{(k)}} \right)}^2}}} - {{{{1 - {v_{{\rm{ox}}}}} \over {E_{{\rm{ox}}}^2}}\Delta {E_{{\rm{ox}}}}h_{{\rm{sub}}}^{(k)}} \mathord{\left/ {\vphantom {{{{1 - {v_{{\rm{ox}}}}} \over {E_{{\rm{ox}}}^2}}\Delta {E_{{\rm{ox}}}}h_{{\rm{sub}}}^{(k)}} {h_{{\rm{ox}}}^{(k)}}}} \right. \kern-\nulldelimiterspace} {h_{{\rm{ox}}}^{(k)}}}} \right)\sigma _{{\rm{sub}}}^{(k)} - {D_{{\rm{ox}}}}\Delta {h_{{\rm{ox}}}}} \right]} {\left( {{{ - {{1 - {v_{{\rm{ox}}}}} \over {{E_{{\rm{ox}}}}}}h_{{\rm{sub}}}^{(k)}} \mathord{\left/ {\vphantom {{ - {{1 - {v_{{\rm{ox}}}}} \over {{E_{{\rm{ox}}}}}}h_{{\rm{sub}}}^{(k)}} {h_{{\rm{ox}}}^{(k)} - {{1 - {v_{{\rm{sub}}}}} \over {{E_{{\rm{sub}}}}}}}}} \right. \kern-\nulldelimiterspace} {h_{{\rm{ox}}}^{(k)} - {{1 - {v_{{\rm{sub}}}}} \over {{E_{{\rm{sub}}}}}}}}} \right)}}} \right. \kern-\nulldelimiterspace} {\left( {{{ - {{1 - {v_{{\rm{ox}}}}} \over {{E_{{\rm{ox}}}}}}h_{{\rm{sub}}}^{(k)}} \mathord{\left/ {\vphantom {{ - {{1 - {v_{{\rm{ox}}}}} \over {{E_{{\rm{ox}}}}}}h_{{\rm{sub}}}^{(k)}} {h_{{\rm{ox}}}^{(k)} - {{1 - {v_{{\rm{sub}}}}} \over {{E_{{\rm{sub}}}}}}}}} \right. \kern-\nulldelimiterspace} {h_{{\rm{ox}}}^{(k)} - {{1 - {v_{{\rm{sub}}}}} \over {{E_{{\rm{sub}}}}}}}}} \right)}}\quad .$$
The stress at
 ${t^{(k + 1)}}$
can be easily obtained as
 $$\sigma _{{\rm{ox}}}^{(k + 1)} = \sigma _{{\rm{ox}}}^{(k)} + \Delta {\sigma _{{\rm{ox}}}}\quad ,$$
 $$\sigma _{{\rm{sub}}}^{(k + 1)} = \sigma _{{\rm{sub}}}^{(k)} + \Delta {\sigma _{{\rm{sub}}}}\quad .$$