


Introduction
Climate change has wide-ranging implications for all facets of society and nature, from ecosystems, infrastructure, human health, and economic well-being (IPCC 2022). Public concern about climate change is substantial in many countries, though it varies across individuals and political contexts (Leiserowitz et al. Reference Leiserowitz, Maibach, Rosenthal, Kotcher, Carman, Neyens, Marlon, Lacroix and Goldberg2021; Poushter et al. Reference Poushter, Moira and Gubbala2022). Many scholars frame climate change mitigation as a collective-action problem, in which benefits are shared while costs are often borne privately (Ostrom Reference Ostrom2000). In this context, climate activism and advocacy have been found to be mechanisms to foster collective action through influencing public and political support for climate mitigation and adaptation policies. However, individuals’ willingness to support climate activism, financially or otherwise, may depend on beliefs about climate change, perceived efficacy of activism, and climate-related knowledge.
Prior research suggests that climate literacy is heterogeneous across the United States, including among university students, and that climate knowledge can be correlated with attitudes and political identity (Bedford Reference Bedford2016; Stevenson Reference Stevenson2007). At the same time, variation in climate beliefs and support for climate policy can reflect many factors beyond knowledge, including ideology, trust, and perceived costs and benefits (Funk Reference Funk2021).
Even among individuals who express concern about climate change, participation in climate-related collective action is limited: in survey data, a minority of people report activities such as contacting elected officials, attending demonstrations, or donating to climate-related causes (Tyson et al. Reference Tyson, Kennedy and Funk2021). Further, attitudes toward different modes of activism vary. For example, traditional street protests can elicit both support and opposition depending on observers’ prior beliefs and partisanship (Bugden Reference Bugden2020; Kutlaca et al. Reference Kutlaca, van Zomeren and Epstude2020). In Pew survey data, protesting was the least commonly reported climate action taken, whereas donating was the most commonly reported action (Tyson et al. Reference Tyson, Kennedy and Funk2021).
To study willingness-to-donate (WTD) to climate activism, we implement an incentive-compatible endowment allocation task (following Shreedhar and Mourato Reference Shreedhar and Mourato2019). Participants complete pre-treatment measures of climate literacy and climate attitudes and are then randomly assigned to one of four infographic treatments in a 2 × 2 factorial design: (i) additional information about a climate activism organization (versus neutral climate-change information only), crossed with (ii) protest imagery (versus neutral imagery). After viewing the infographic, participants complete a post-treatment attitudes survey and then decide how much of a $30 endowment to donate to a climate activism organization.
We find average donations of $14.28 (about 48% of the endowment) and a high share of participants donating the full endowment. However, we also find that providing additional information about the climate activism organization reduces donation amounts on average. Protest imagery attenuates this negative effect and increases post-treatment climate concern. Across specifications, climate concern and identifying as non-male are positively associated with donation amounts.
One interpretation of the negative effect of organizational information is a diffusion-of-responsibility or free-riding mechanism: learning that an organized group is already addressing a public problem may reduce perceived marginal impact of one’s own contribution (Hager et al. Reference Hager, Hensel, Hermle and Roth2019; Olson Reference Olson1965). Conversely, protest imagery may make collective action and urgency more salient, counteracting this mechanism by increasing climate concern.
Most valuation evidence in environmental economics focuses on willingness-to-pay for mitigation or adaptation policies (Diederich and Goeschl Reference Diederich and Goeschl2014; Mayer and Smith Reference Mayer and Smith2018; O’Garra and Mourato Reference O’Garra and Mourato2016; Vilela et al. Reference Vilela, Malky Harb and Mendizábal Vergara2022). Less is known about how individuals value sociopolitical mechanisms, such as advocacy and mobilization, which can shape the adoption of those policies. We contribute to the literature by eliciting willingness-to-donate (WTD) to a climate activism organization using real monetary stakes and by testing how climate advocacy organization information and protest imagery jointly affect donations and climate attitudes. In this study, we thus investigated a new aspect of funding climate change solutions by eliciting donation preferences for climate activism rather than willingness to pay (WTP) for climate adaptation (Mayer and Smith Reference Mayer and Smith2018; O’Garra and Mourato Reference O’Garra and Mourato2016).
Our design links an incentive-compatible donation decision with pre- and post-treatment measures of climate concern and assuredness, allowing us to examine both behavioral and attitudinal responses to climate communication. For climate advocacy organizations, the results provide evidence on how self-description and imagery may differentially affect donors with varying levels of climate concern.
We begin with our motivation and a review of previous literature. We briefly review nonmarket valuation and donation-based measures relevant to climate solutions, followed by a discussion of collective action, activism, and perceptions of protest. We next discuss our experimental design, including our climate literacy measure, pre- and post-treatment climate attitudes measures, and an incentive-compatible donation decision. After discussing our design, we describe our participant sample, variables, and econometric approach. We then present results from our preferred regression specifications and conclude with implications and limitations.
Motivation & literature review
In the following section, we review literature related to climate-solution valuation measurement, climate activism, and climate literacy. We begin by discussing selected nonmarket valuation and donation-based measures that are most relevant to our experimental design. We then discuss collective action and climate activism, with particular focus on how protest and protest imagery can shape public perceptions. Finally, we discuss evidence on how climate knowledge and attitudes are related in prior work.
Valuation and donation-based measures
Nonmarket valuation methods, most prominently stated-preference willingness-to-pay (WTP), are widely used to quantify public support for climate change mitigation and adaptation policies. Meta-analyses document substantial heterogeneity in WTP estimates across contexts and populations, reflecting differences in institutions, cultures, and individual attributes (Chaikumbung Reference Chaikumbung2023). Complementary experimental approaches elicit voluntary contributions or donations as measures of WTD to environmental public goods or organizations. For example, Shreedhar and Mourato (Reference Shreedhar and Mourato2019) use an incentive-compatible donation decision to study how audio–visual media affects giving to conservation. Vander Naald (Reference Vander Naald2020) elicits willing-to-pay in-situ, to ascertain how context affects preferences. Related work distinguishes WTP from WTD in settings where free-riding incentives are present and where donations may be motivated by both public-good benefits and private “warm-glow” utility (Andreoni Reference Andreoni1990; Menges et al. Reference Menges, Schroeder and Traub2005). These donation-based measures are particularly relevant when the object of valuation is voluntary financial support for a cause or organization, such as a climate advocacy organization, rather than policy-funded provision.
Collective action, activism, and perceptions of protest
Classic work on collective action emphasizes coordination problems and incentives to free ride in public goods provision (Olson Reference Olson1965; Ostrom Reference Ostrom2000; Walker et al. Reference Walker, Carpenter, Anderies, Abel, Cumming, Janssen, Lebel, Norberg, Peterson and Pritchard2002). A large subsequent literature studies how collective action can be mobilized through information, norms, and behavioral interventions (Buckley Reference Buckley2020), as well as how social movements can shape political outcomes. Climate activism is one such mechanism: climate protests, such as marches, can influence bystanders’ efficacy beliefs, perceived norms, impressions of activists, and subsequent behaviors (Swim et al. Reference Swim, Geiger and Lengieza2019). Recent evidence also suggests that climate protests increase approval of pro-environmental policy and foster perceptions of the collective efficacy of climate change campaigners, although responses can vary across contexts and protest mechanism (Kountouris and Williams Reference Kountouris and Williams2023; Swim et al. Reference Swim, Geiger and Lengieza2019).
As protest is a highly visible tactic that is often mediated through images and news coverage, understanding how protest imagery affects support for climate advocacy is policy-relevant. Media framing and social-media dissemination can shape perceptions of protest movements and engagement (Brown and Harlow Reference Brown and Harlow2019; Mourão and Brown Reference Mourão and Brown2022). Perceived legitimacy and justification of protest tactics can influence whether observers view protest as persuasive or polarizing (Zlobina and Gonzalez Vazquez Reference Zlobina and Gonzalez Vazquez2018). These insights motivate our experimental focus on protest versus non-protest imagery as a salient cue that may shift donations and attitudes.
Public reactions to protest are heterogeneous. Bugden (Reference Bugden2020) finds that different protest tactics can have varied effects on support for social change, with effects moderated by partisanship and beliefs about anthropogenic climate change. Importantly, differences in support should not be interpreted as simply reflecting whether individuals are informed or uninformed; attitudes may reflect ideology, trust, and perceived costs and benefits (Funk Reference Funk2021). Evidence on climate literacy suggests it is related to concern and can reduce polarization in some student samples (Bedford Reference Bedford2016), but it is only one of several factors that may shape support for climate activism.
Experimental method
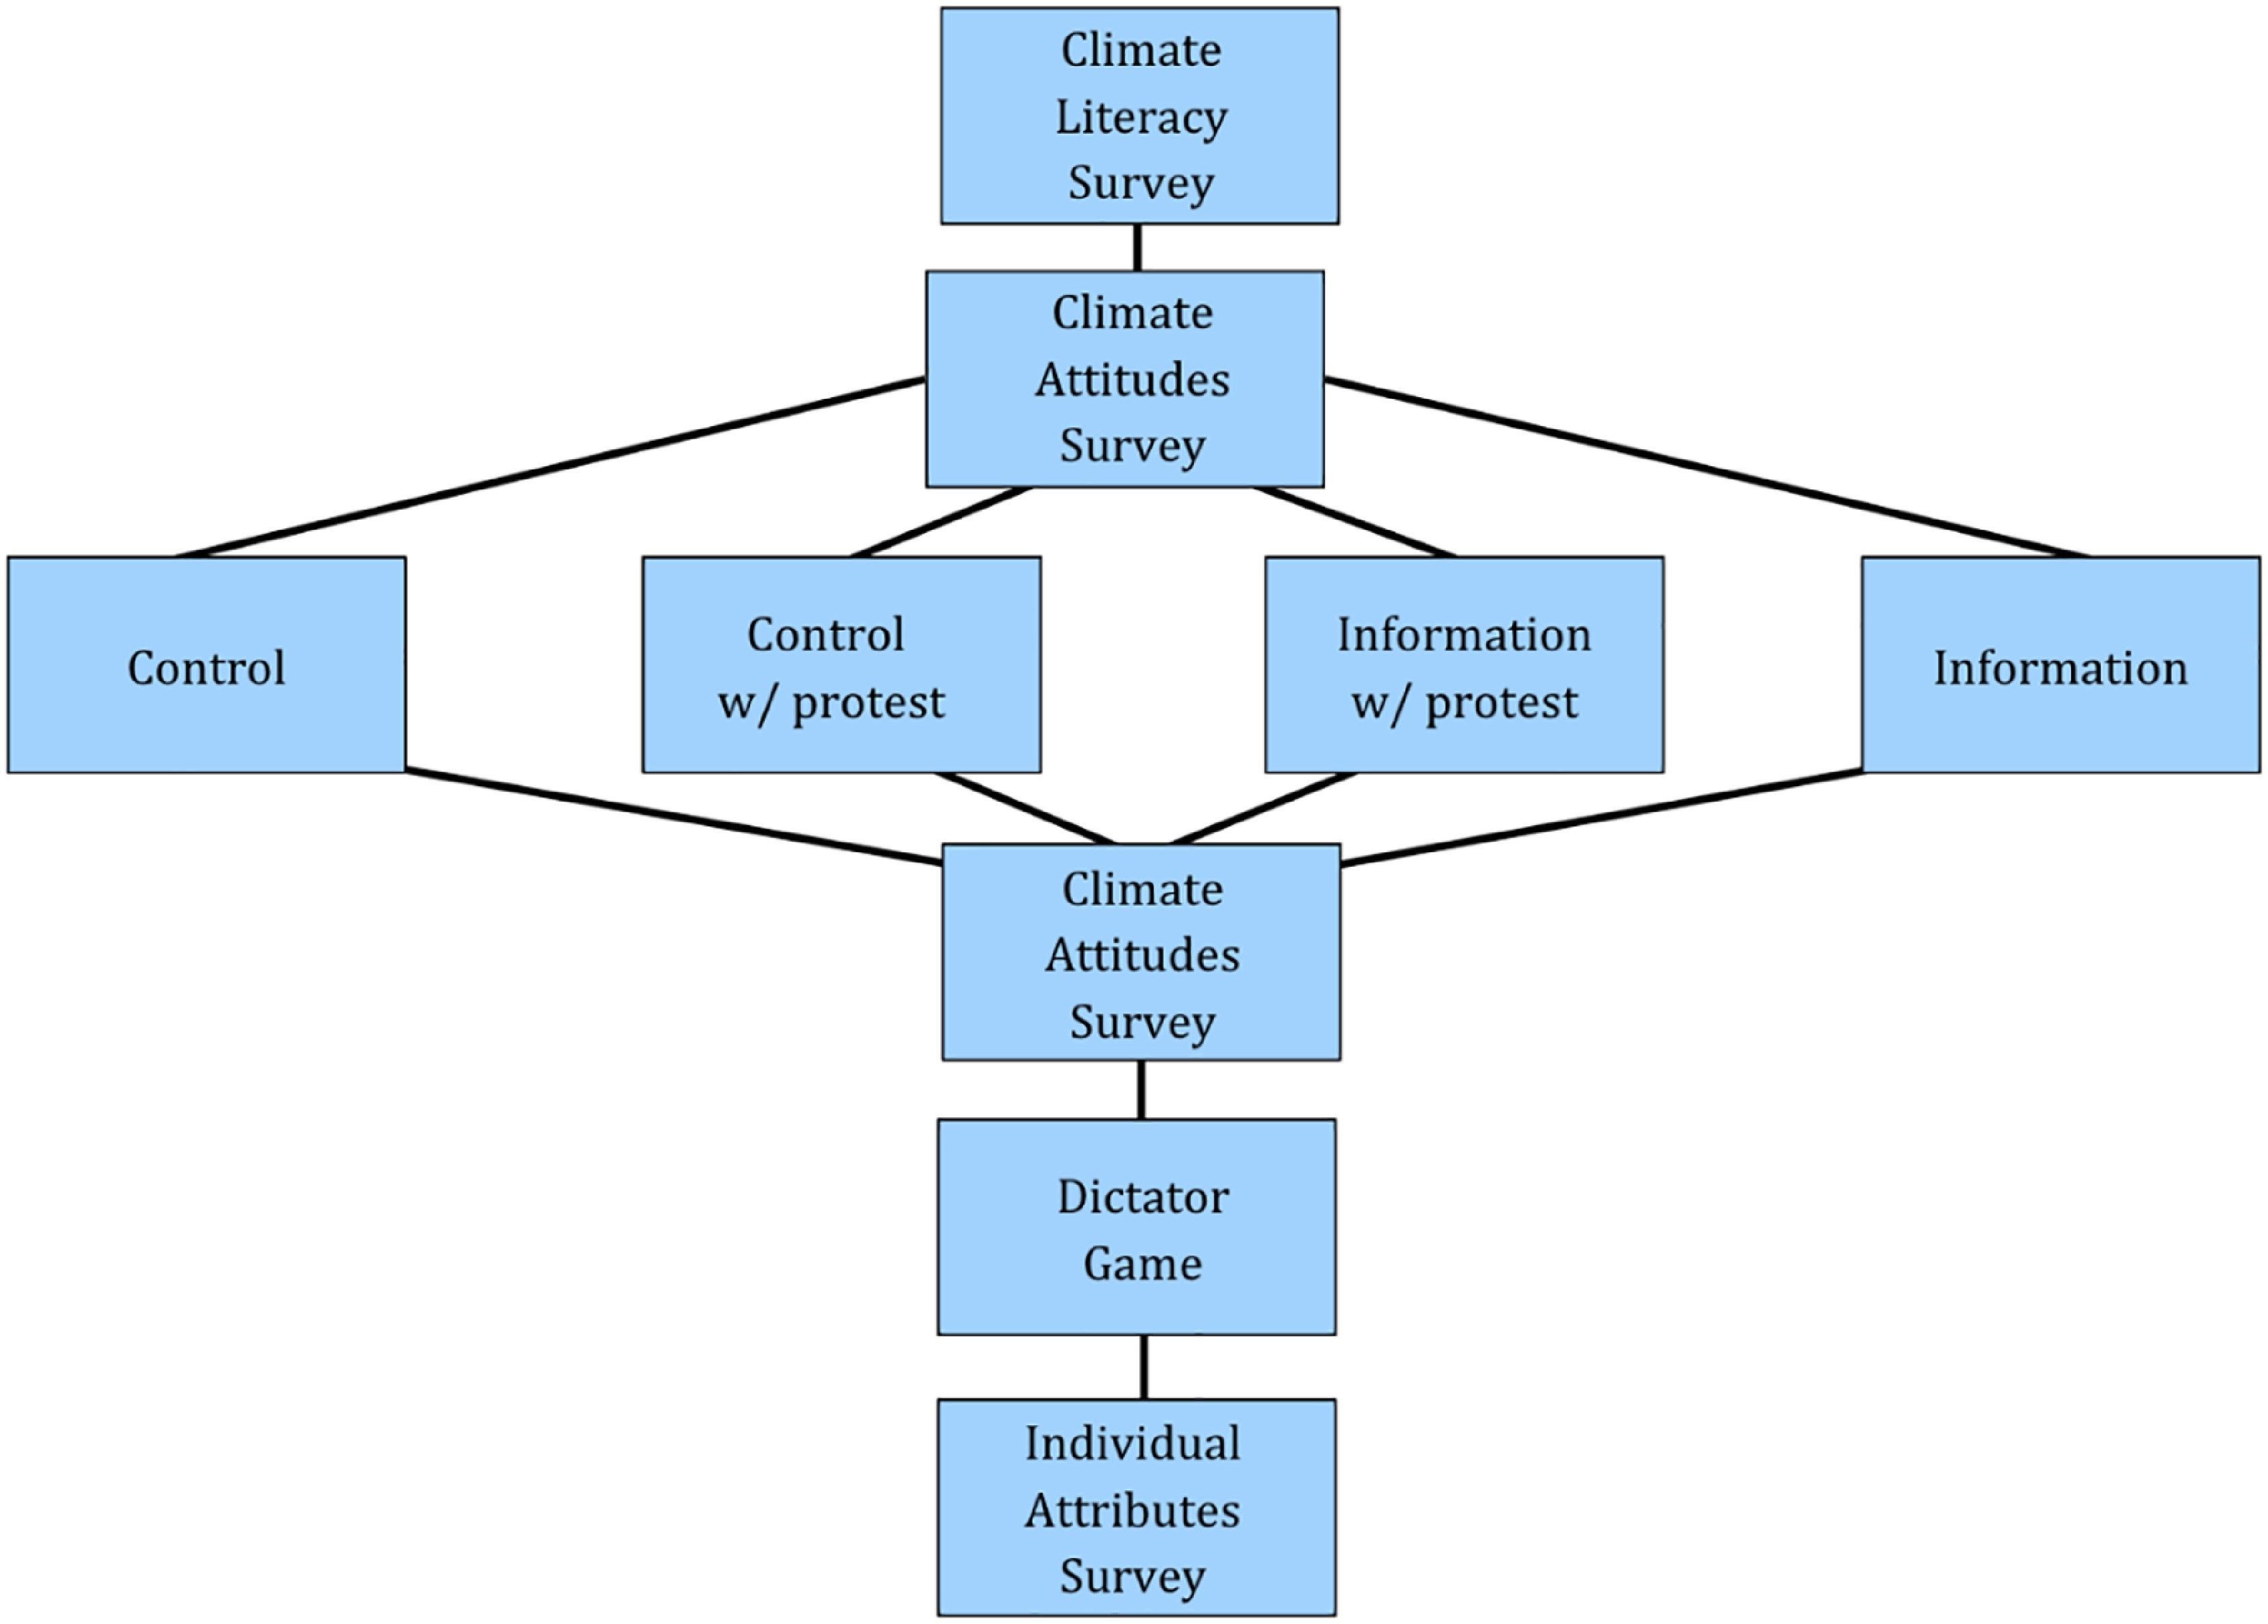
We use a between-subjects 2 × 2 factorial design. Participants are randomly assigned to view one of four infographic-style treatments that vary along two dimensions: (i) whether the infographic includes additional information about a climate activism organization, and (ii) whether it includes protest imagery (versus neutral imagery). The ordering of treatments is random and so it is not necessarily the case that (i) appears before (ii). For a visualization of our method, see Figure 1. After the treatments are viewed, we then measure changes in climate attitudes and an incentive-compatible donation decision.
Visualization of experimental method.
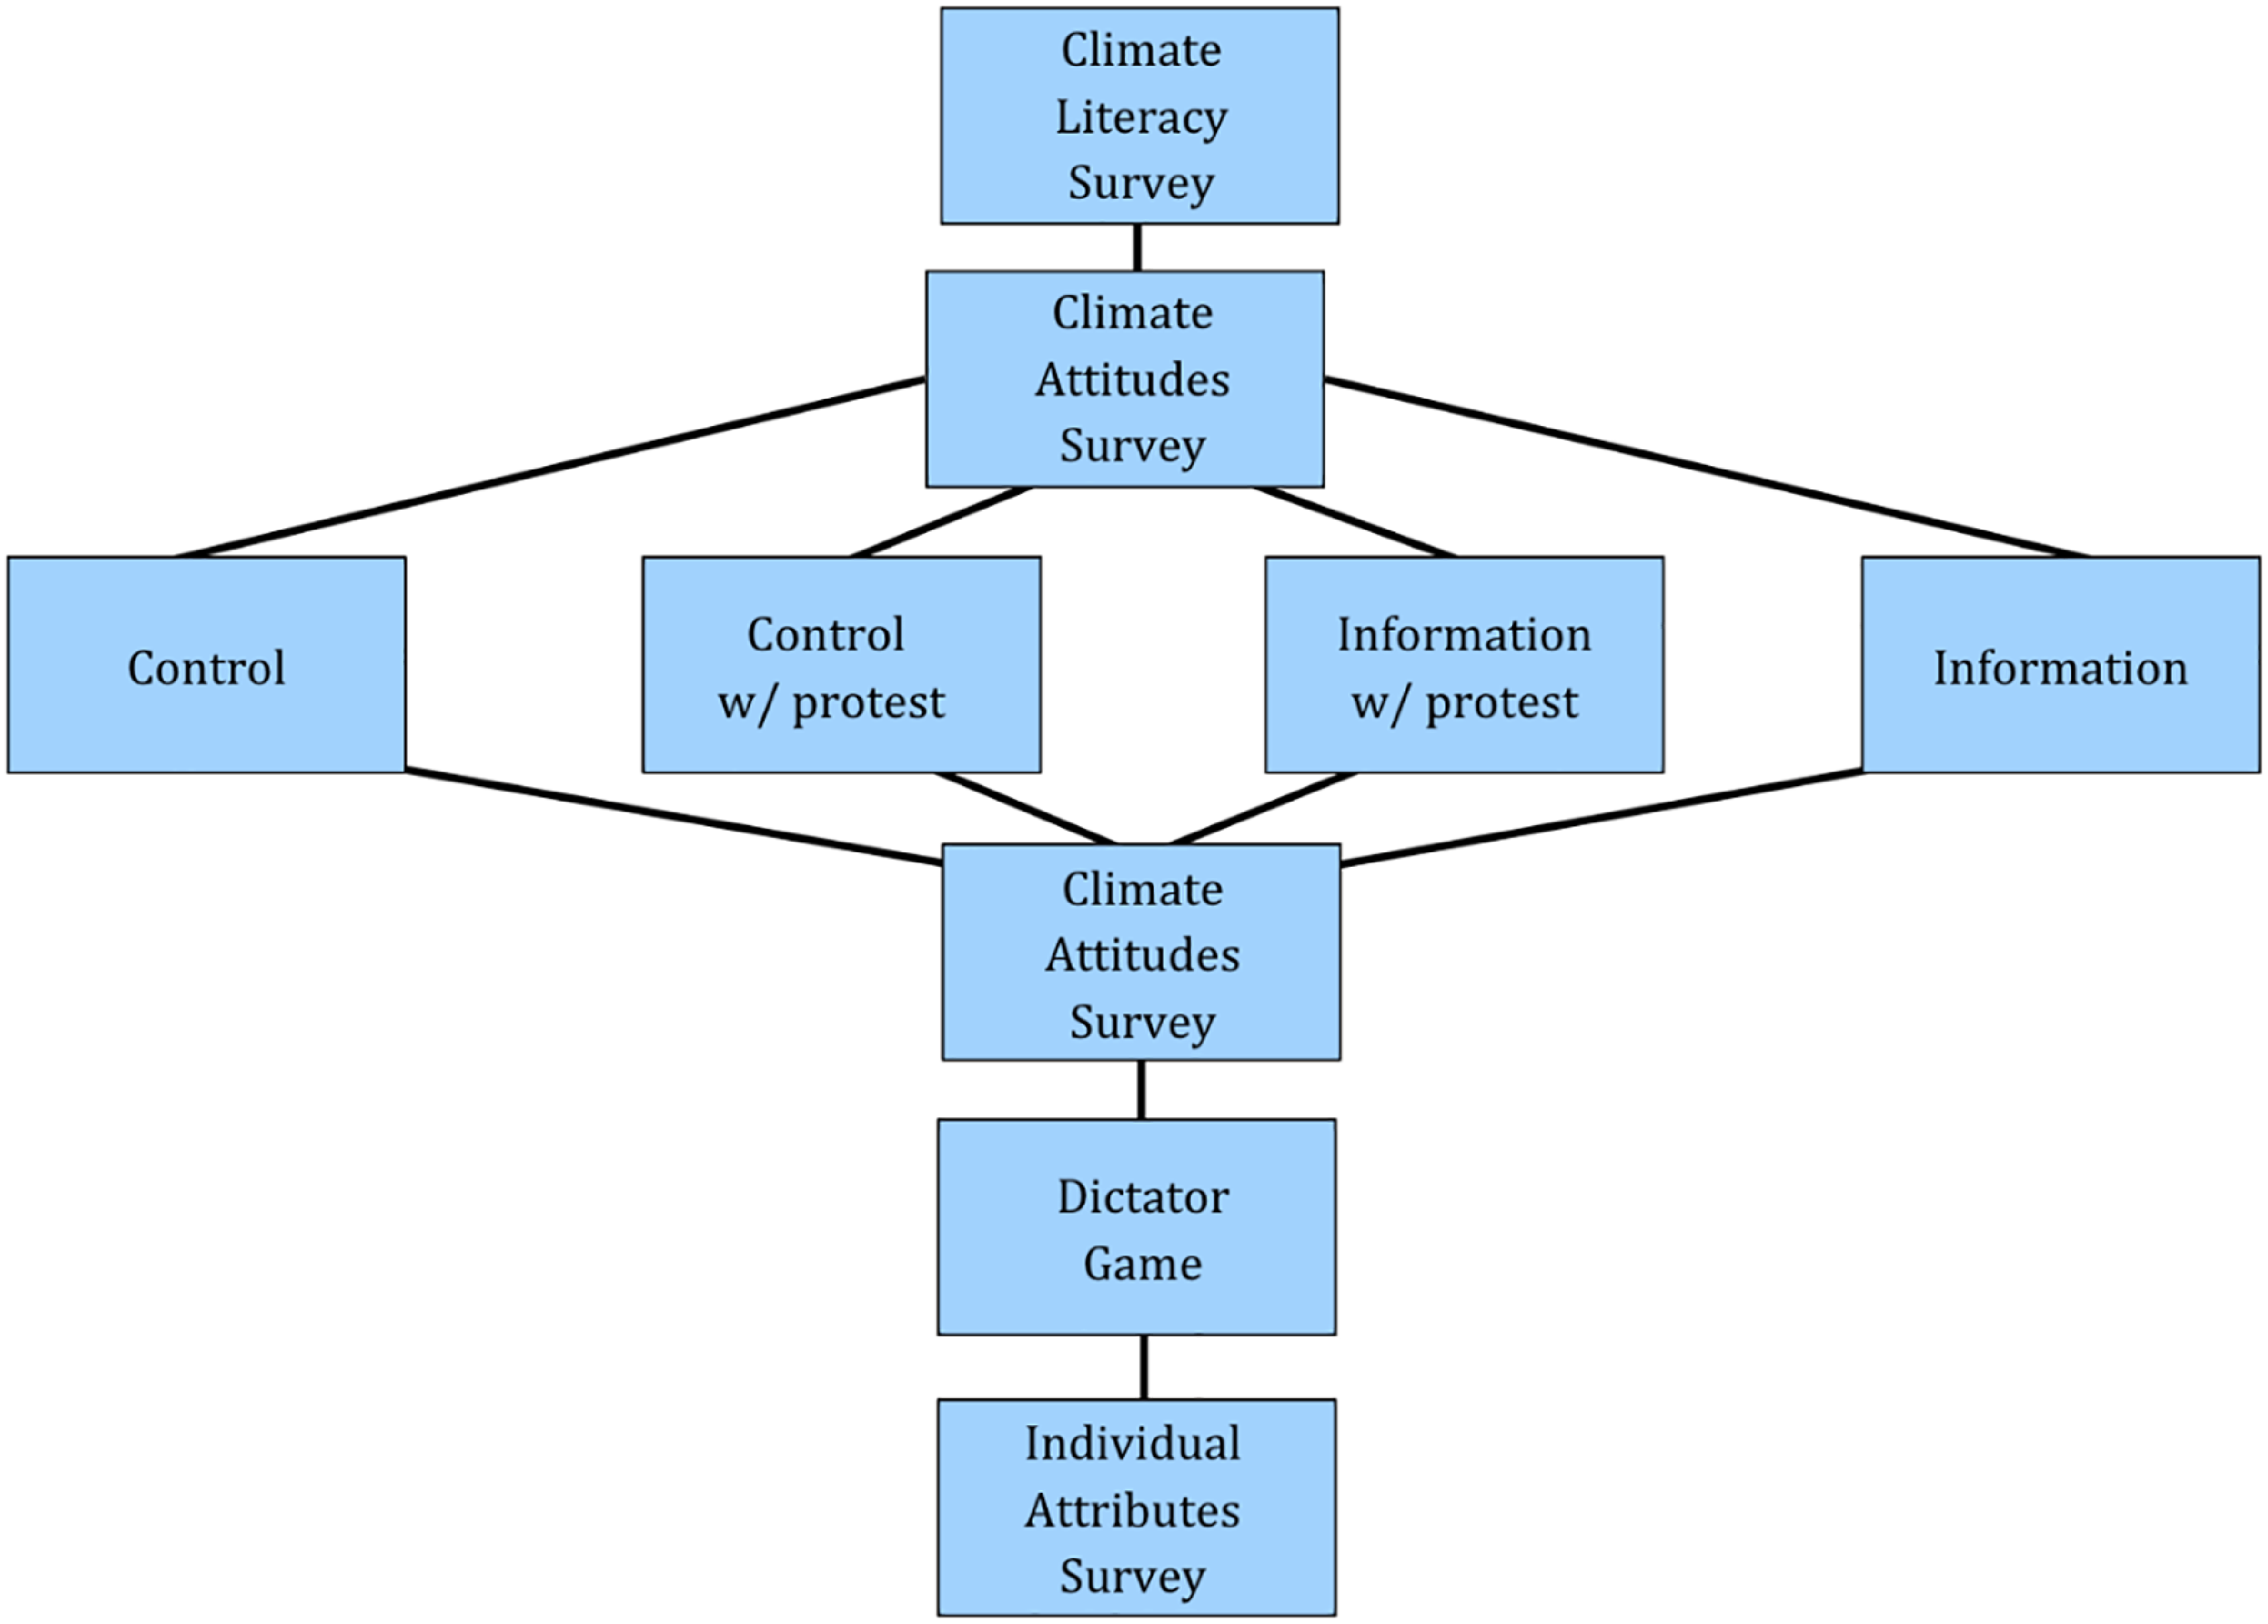
Our primary outcomes are (1) donation amount to a climate activism organization (bounded between $0 and $30); (2) post-treatment climate concern; and (3) post-treatment climate assuredness which reflects an individual’s belief in the existence of climate change and their confidence in that belief. We measure climate attitudes both before and after the infographic to assess attitudinal changes associated with the treatments.
Climate literacy test
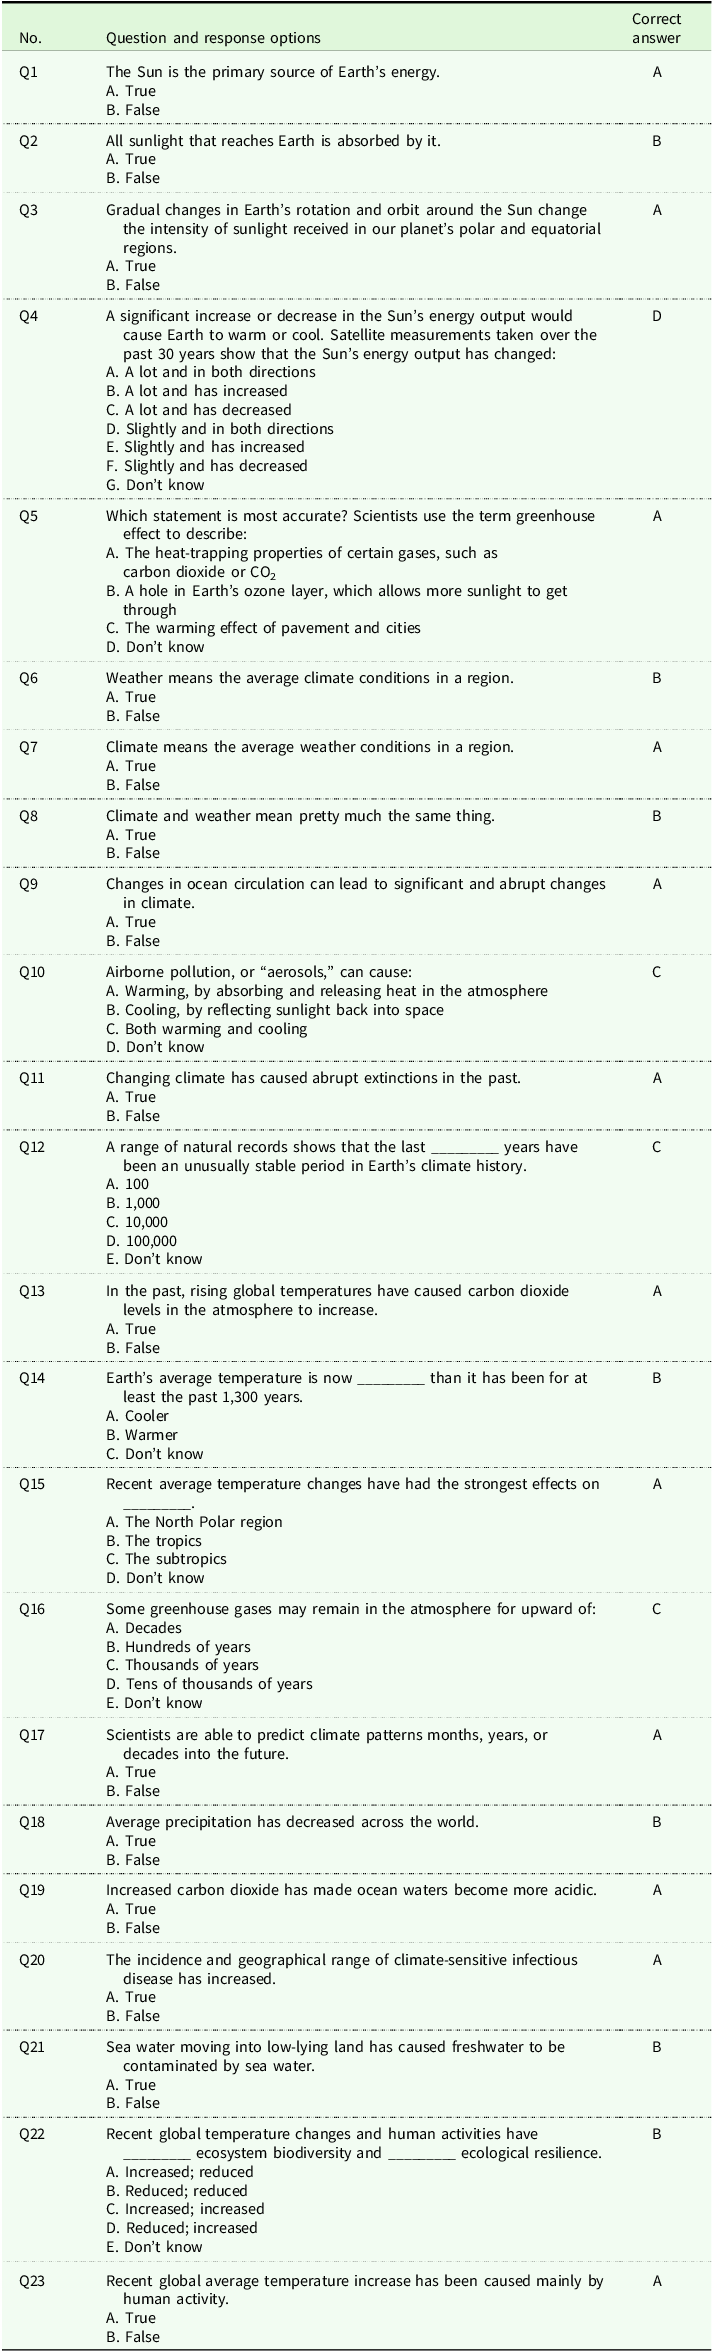
To examine variations in climate literacy, we employ a test of climate literacy at the very beginning of our experiment. We use a survey modeled on the US Global Change Research Program’s (USGCRP 2009) and Bugden (Reference Bugden2020) climate literacy survey. The instrument is available in Appendix B. Based on the number of questions correctly answered, we then determine whether someone is climate literate, with a score of 70% or more qualifying as climate literate. This test was only given before the treatment. After completing it, participants moved on to the climate attitudes survey.
Climate attitudes test
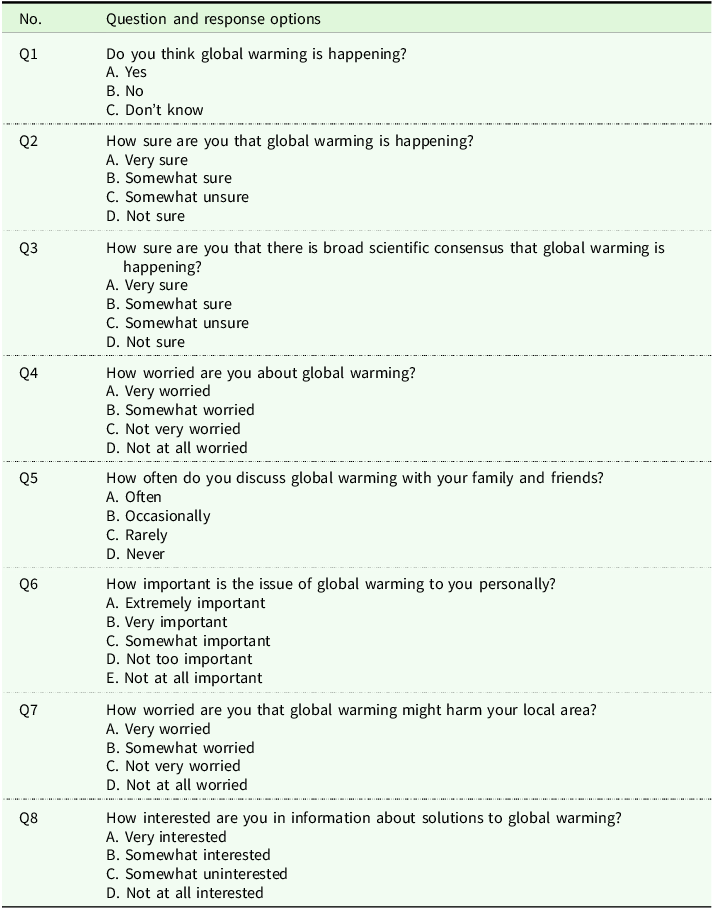
For our climate attitudes survey, we use questions from the Yale Program on Climate Change Communication national survey as it is considered the standard for evaluating climate change attitudes and perceptions (Leiserowitz et al. Reference Leiserowitz, Maibach, Rosenthal, Kotcher, Carman, Neyens, Marlon, Lacroix and Goldberg2021). We partitioned the test into two parts to ascertain (1) an individual’s belief in the existence of climate change, (2) confidence in that belief, and (3) their level of concern on the issue of climate change. This test was deployed both before and after the infographic treatment. As with any pre-treatment survey instrument, asking climate attitude questions prior to the infographic could itself prime respondents to think more about climate change and potentially shift subsequent responses or donation behavior; because this potential priming would operate across all randomized arms, it does not threaten internal validity of the treatment comparisons, but it may affect overall levels and should be considered when interpreting magnitudes. This instrument is available in Appendix B.
Donation task
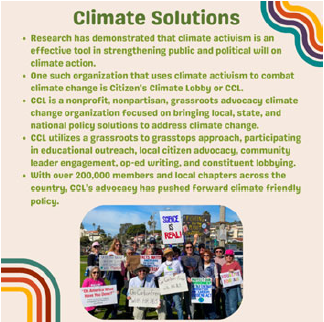
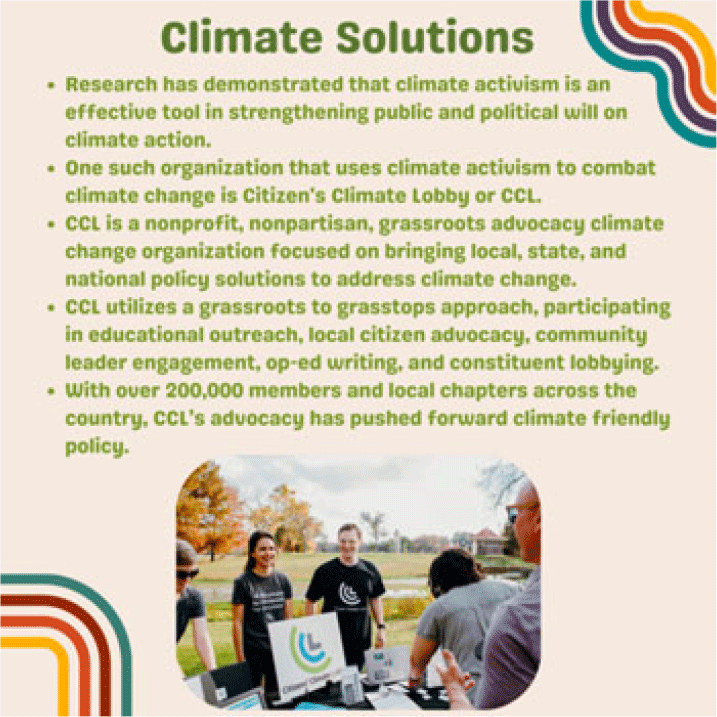
When selecting an organization for the donation task, we sought a nonpartisan, established climate advocacy nonprofit with clearly articulated goals and a mix of tactics (e.g., grassroots organizing, legislative lobbying, and public outreach). As such, we selected Citizens’ Climate Lobby (CCL), which combines grassroots organizing of everyday people with lobbying of national legislators. Throughout our experiment, we used CCL as the focal organization in the infographic treatments and the incentive-compatible donation decision.
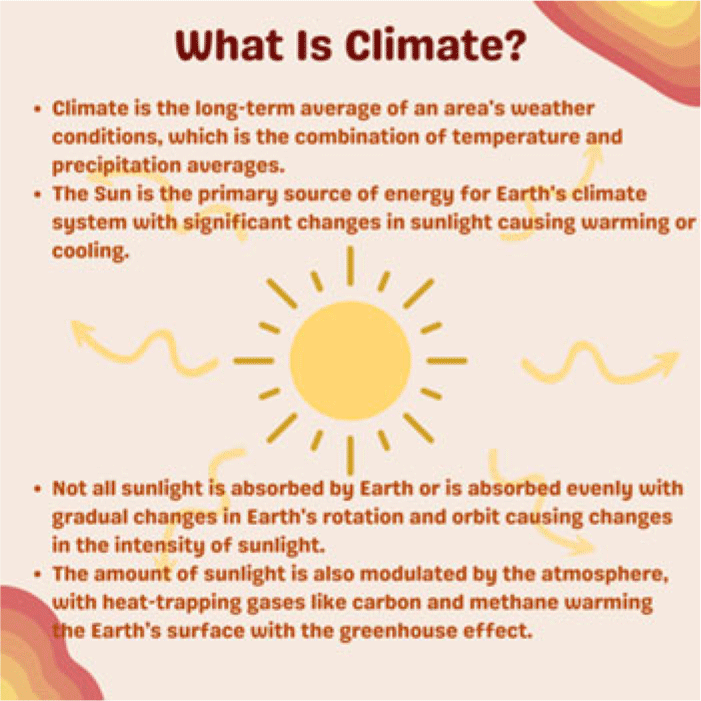
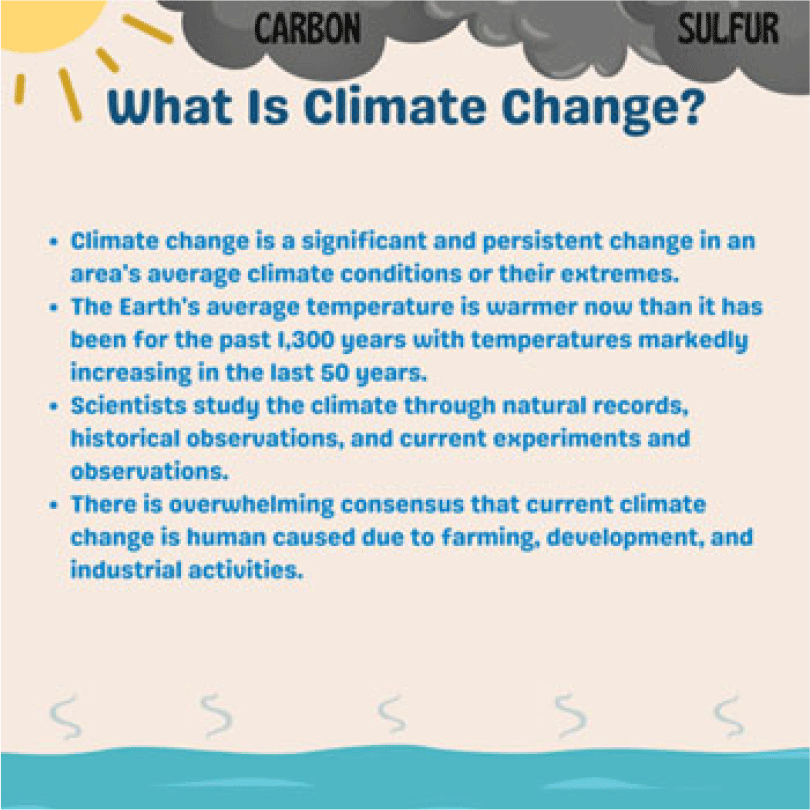
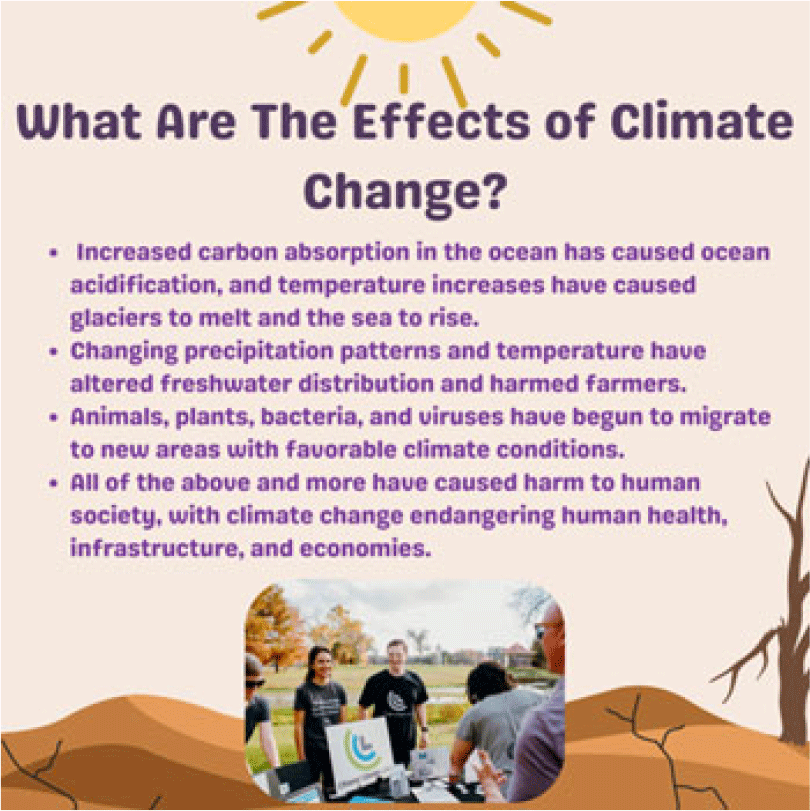
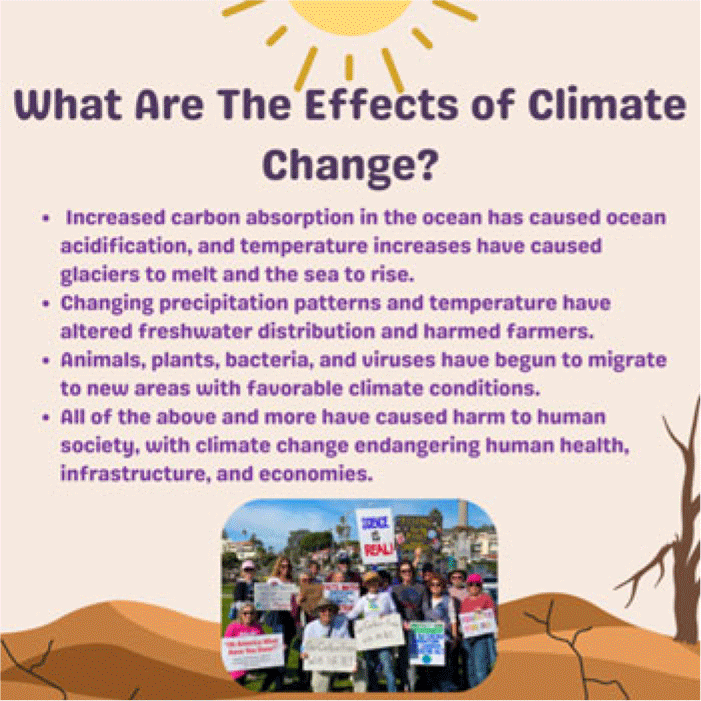
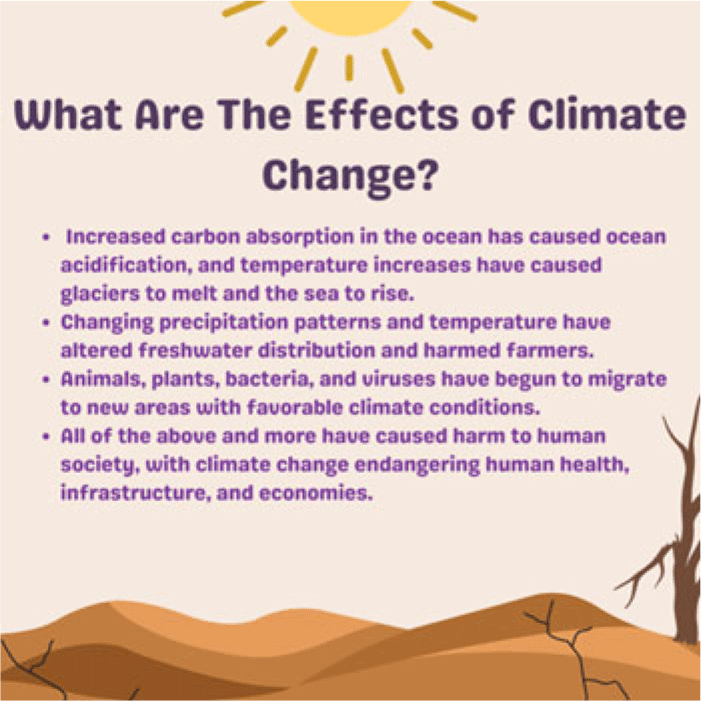
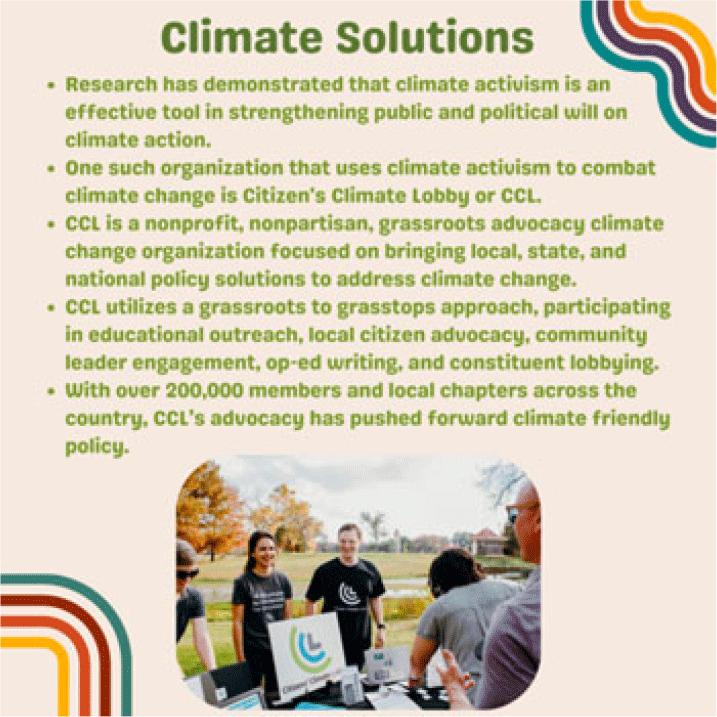
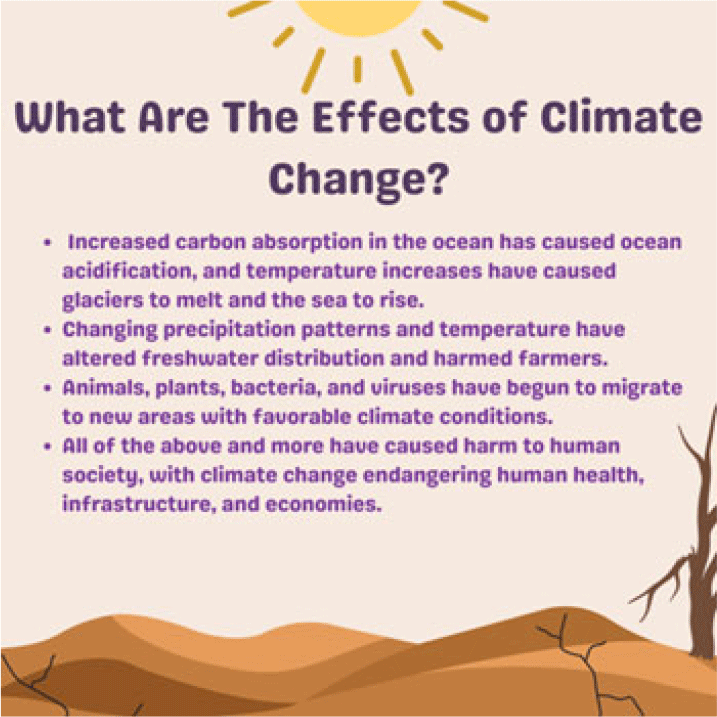
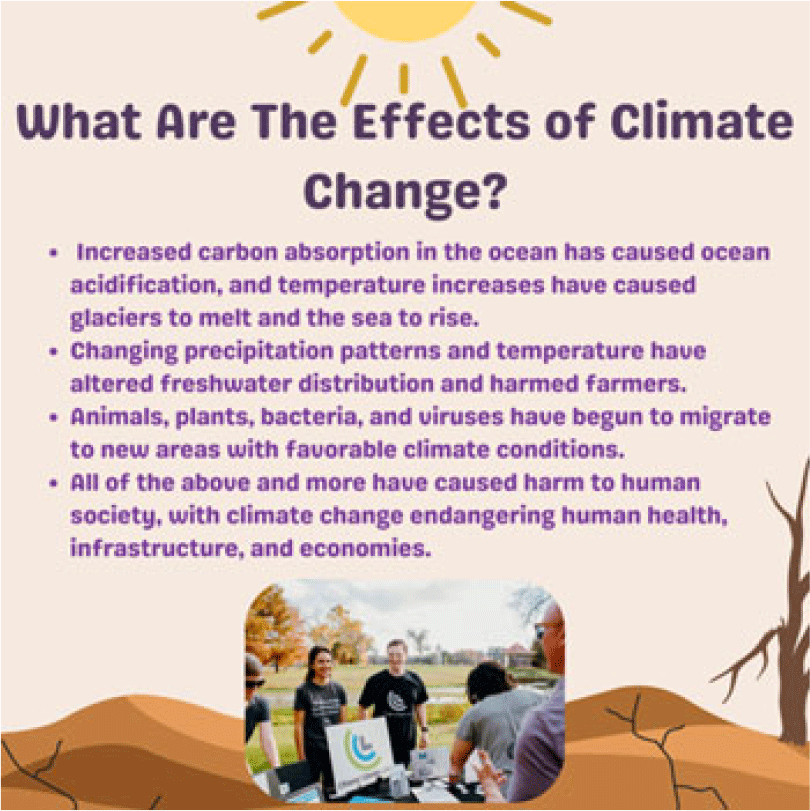
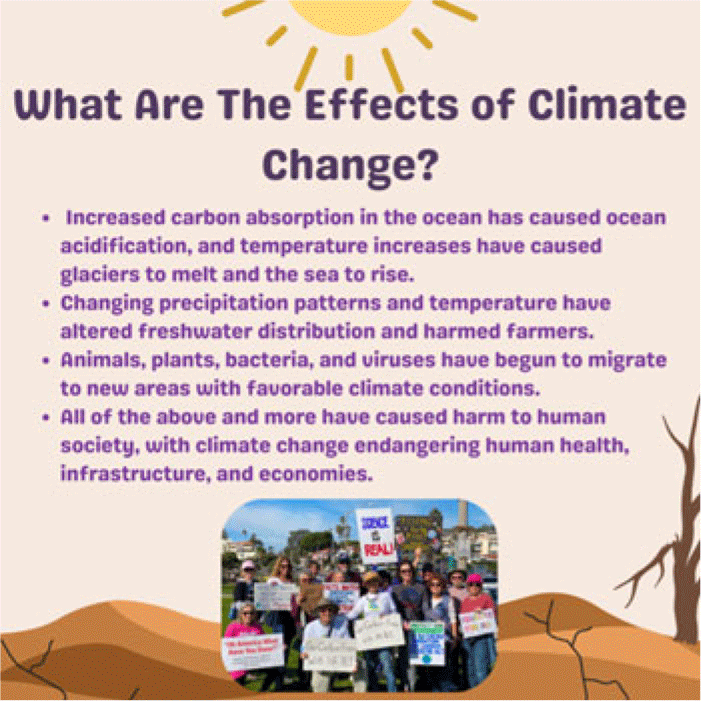
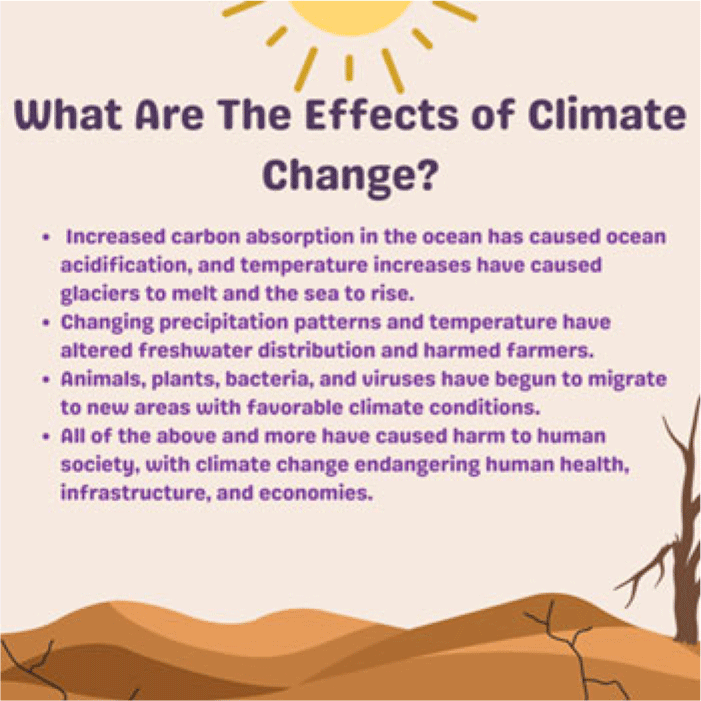
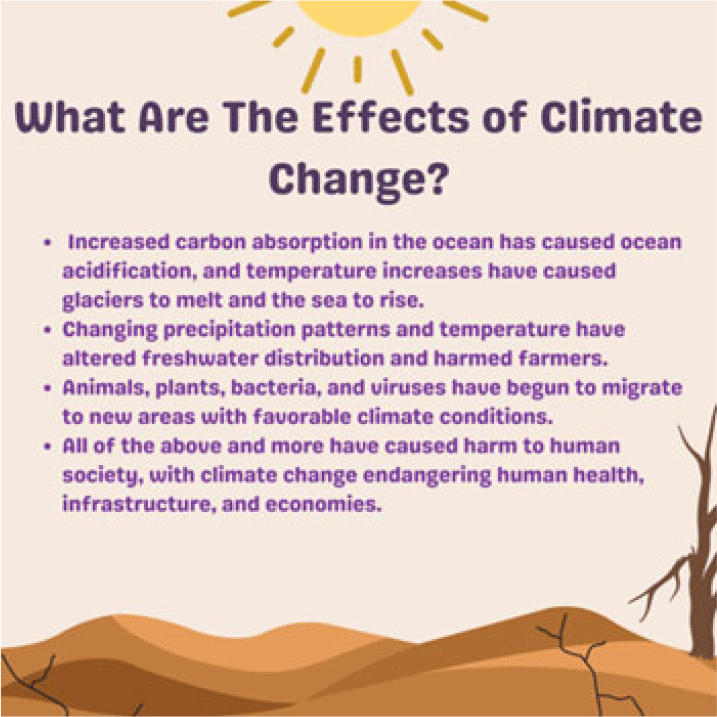
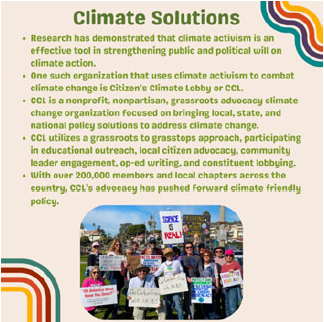
To investigate how climate communication affects donations and attitudes, we created four infographic treatments in a 2 × 2 design. All participants saw the same short, neutral description of climate change, developed using the US Global Change Research Program (USGCRP 2009) climate literacy guidance. In the activism-information condition, the infographic also included a short paragraph describing CCL and its advocacy approach; in the control condition, this paragraph was omitted. Independently, the infographic included either protest imagery (CCL members at a rally holding protest signs) or neutral imagery (CCL members tabling). Participants were randomized with equal probability into one of the four treatment groups automatically after completing the climate literacy test and pre-treatment climate attitudes survey.
The formatting for all infographics was standardized (color scheme, font, layout, and placement of the image) so that the manipulations were limited to the activism-information paragraph and the protest-versus-neutral image. All treatments are provided in Appendix A.
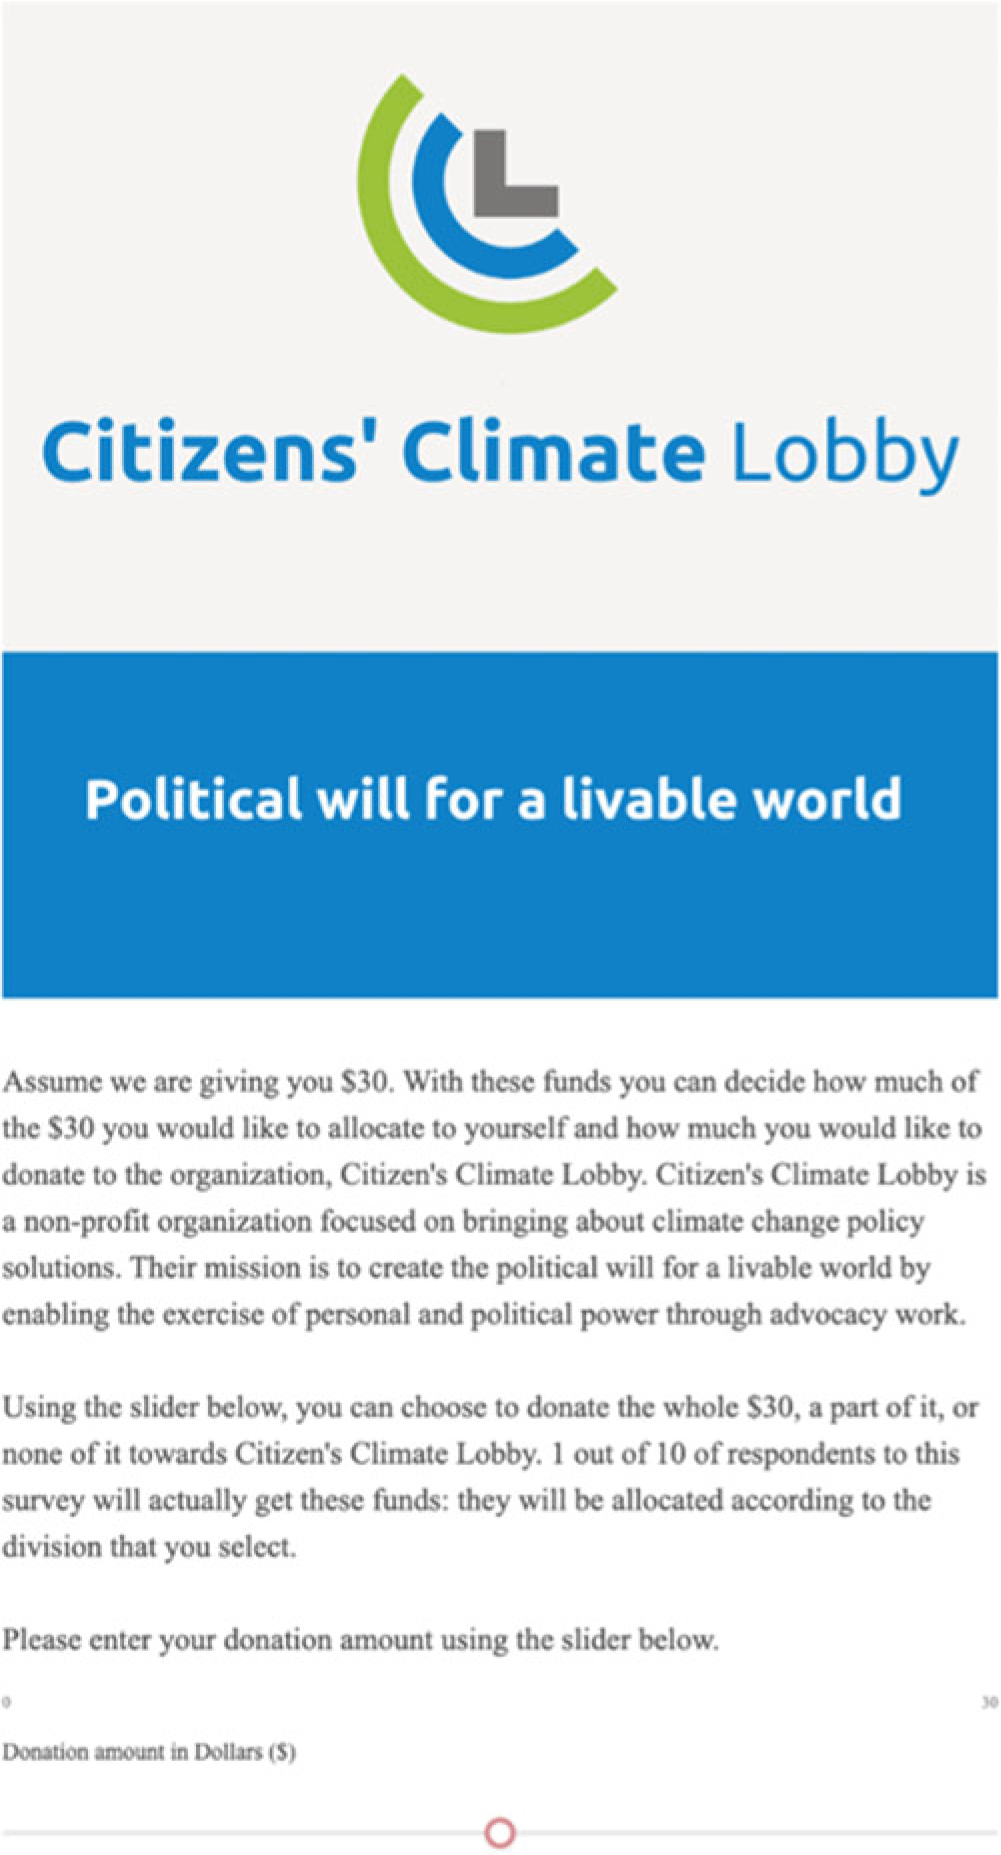
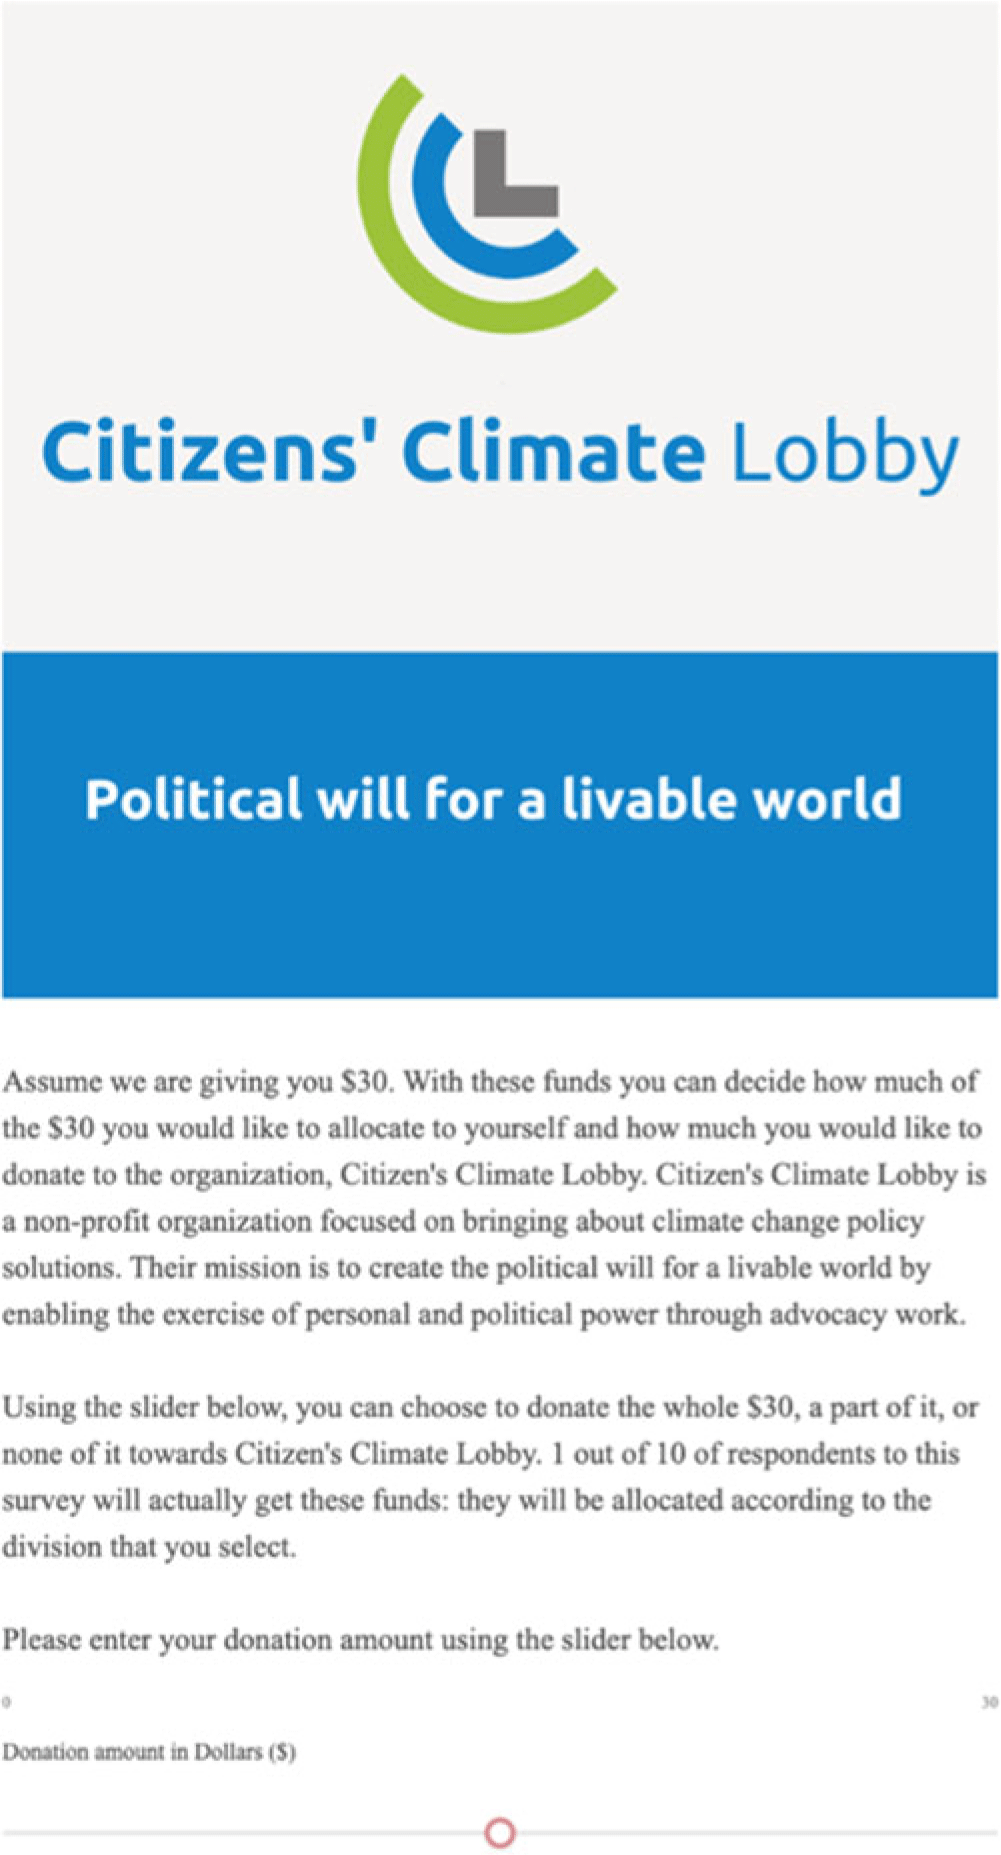
After receiving the infographic treatment and completing the post-treatment climate attitudes survey, participants made an incentive-compatible donation decision. They allocated a $30 endowment between themselves and CCL using a slider in $1 increments (default set to $15). Participants were told they would keep the endowment minus the amount they chose to donate. As donations to a charity or advocacy organization may provide private benefits and expected public-good benefits, we interpret this allocation as WTD rather than as a measure of social preferences in an anonymous two-person allocation setting (Andreoni Reference Andreoni1990). All donation pages were standardized and displayed the CCL logo as well as with one short neutral sentence describing CCL as a nonpartisan climate advocacy organization.
Following Shreedhar and Mourato (Reference Shreedhar and Mourato2019), we used a $30 endowment, which is relatively high-stakes, compared with typical online survey payments. For a student sample with constrained budgets, this stake size helps approximate the salience of real donation decisions.
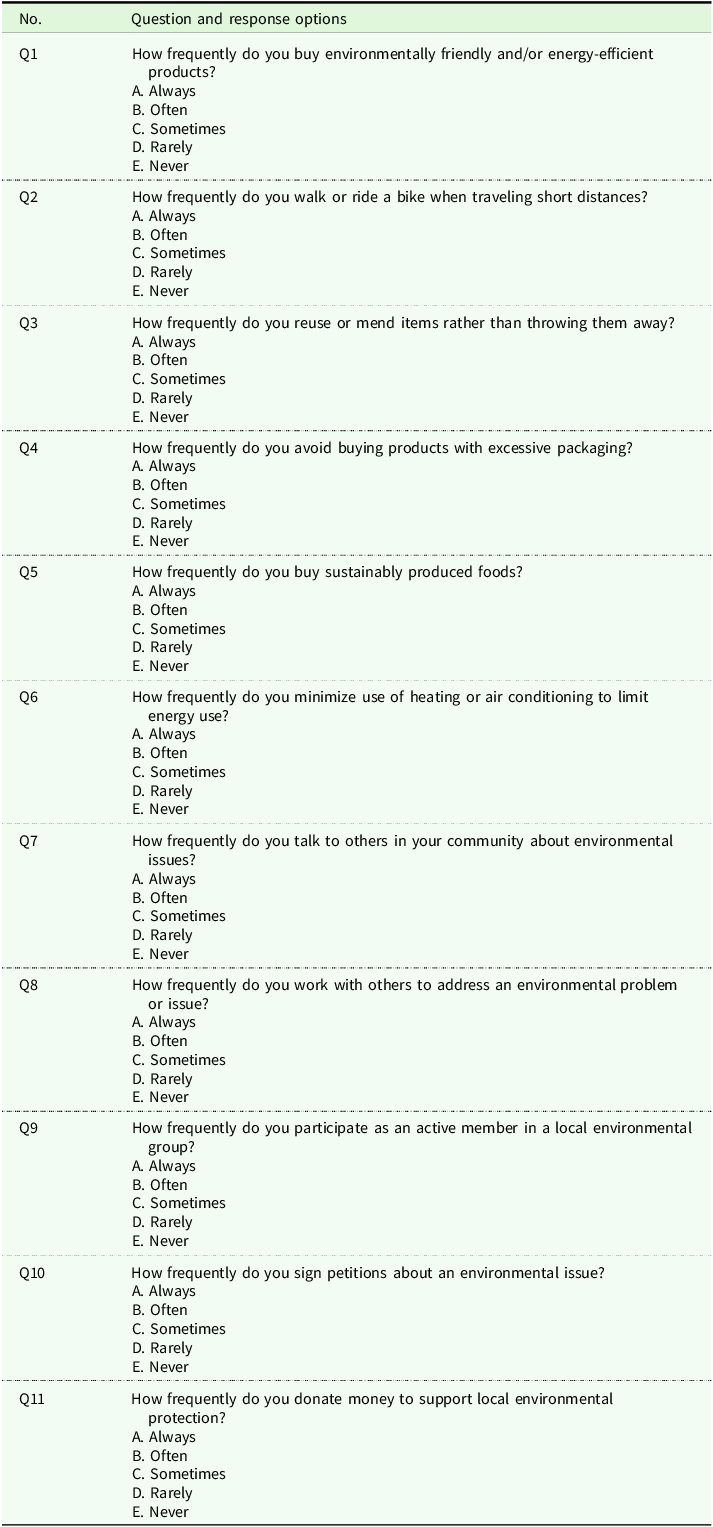
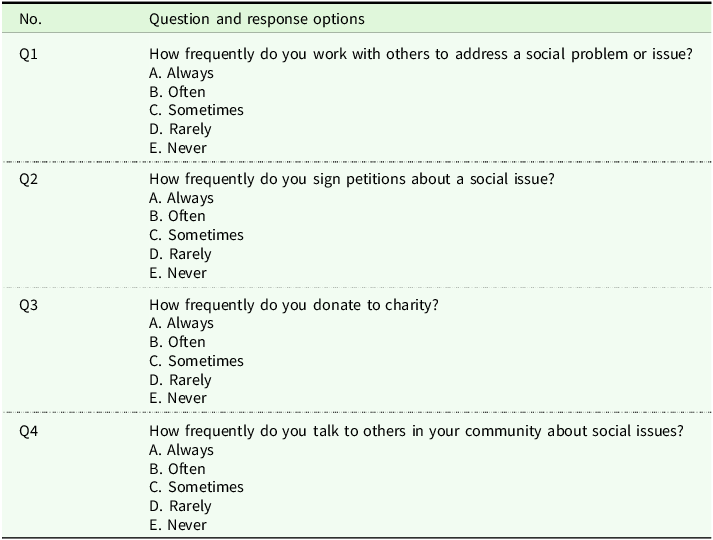
After the donation decision, participants responded to questions on past pro-environmental behavior (PEB) based on Mateer et al. (Reference Mateer, Melton, Miller, Lawhon, Agans and Taff2022). Each item is rated on a 5-point Likert scale from “Never”’ to “Always.” As the PEB items primarily capture environmentally oriented behaviors and may not capture broader prosocial engagement (e.g., volunteering or advocacy for other causes), we added four parallel items to measure general pro-social behavior (PSB), which may be particularly relevant in a student sample (Dorothy A. Johnson Center 2024; Willis Reference Willis2025).
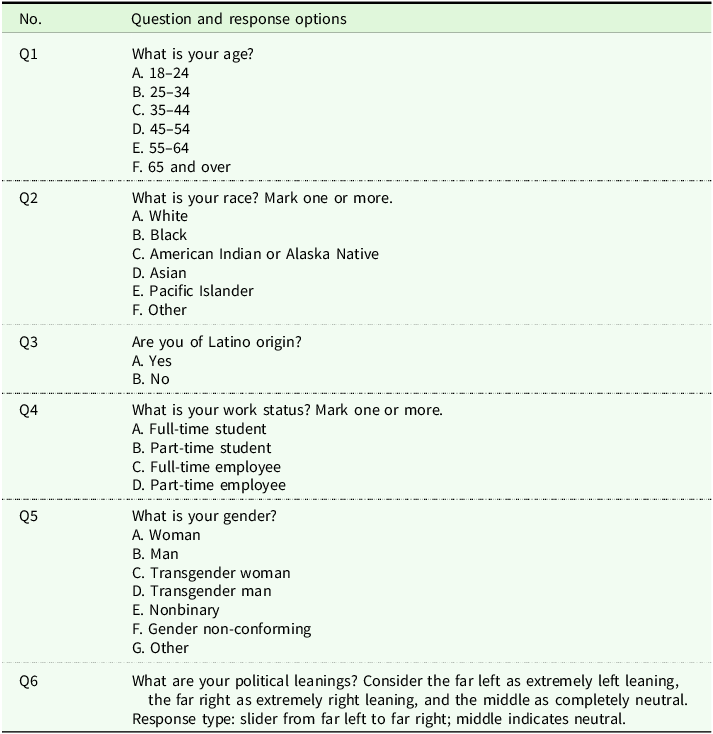
Finally, participants respond to a brief set of questions about individual attributes including age, race, gender, and work status. All surveys can be seen in Appendix B.
Data
In this section, we present the data used in our analysis, including summary statistics on our participants and details on our independent variables and control covariates.
Participants
We recruited 367 undergraduate students from a large, R1 university in the western United States through email recruitment lists. The experiment ran from 19 October to 19 December 2023, using the Qualtrics survey platform. Recruitment materials described the study as a survey about climate solutions and attitudes. Using a student sample limits external validity; we discuss implications and potential selection effects in the limitations section.
In our sample, 64% are women and 31% are men. The average age of a participant was between 18 to 24 years old and 53% of the sample were full time students only with the rest being partially or fully employed while being a student. Of our sample, only 13% say they never donate to charity while most donate either rarely (33%) or sometimes (40%). 42% of participants report that they have never donated to support local environmental protection.
Dependent variables of interest
In our experiment, we used three dependent variables: donation amount (see Figures 2–5a, post-treatment climate concern, and post-treatment climate assuredness. Post-treatment concern and assuredness are constructed from the post-treatment climate attitudes survey and capture whether the infographic treatments shift reported concern about climate change and confidence in the existence of climate change. Donation amount measures WTD to a climate activism organization under real monetary stakes.
Independent variables
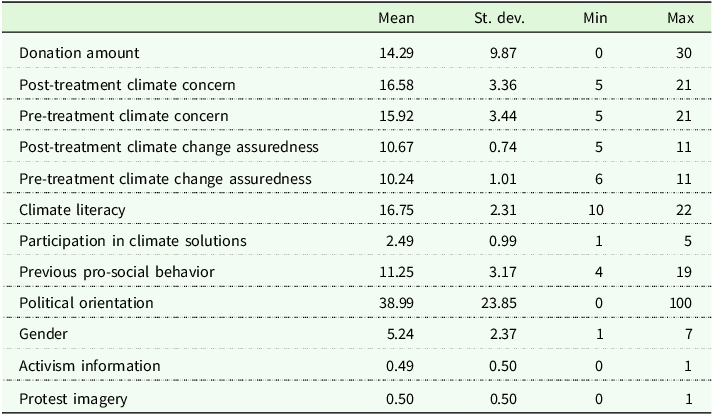
We also use several independent variables measured before and after the infographic treatment. Before treatment, we measure climate literacy and pre-treatment climate attitudes (concern and assuredness). After treatment (following the post-treatment attitudes survey and donation decision), we measure past PEB and general PSB. Finally, we collect demographic information and political orientation, measured on a sliding scale from 0 (furthest left) to 100 (furthest right). All variables are presented in Table 1.
Descriptive statistics of variables of interest
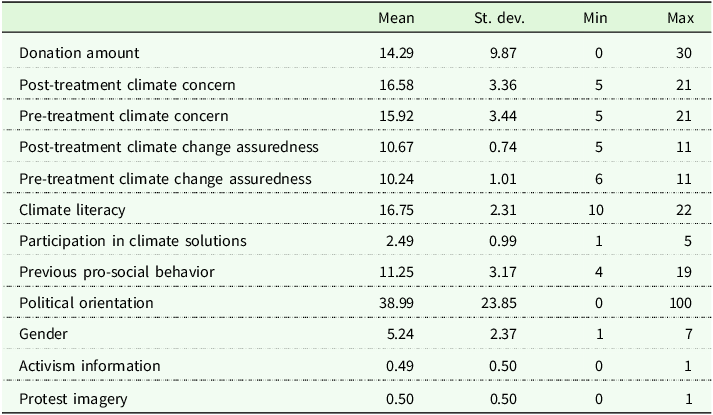
Table 1 Long description
The table presents descriptive statistics of various variables related to climate concern, assuredness, literacy, participation in climate solutions, previous pro-social behavior, political orientation, gender, activism information, and protest imagery. It includes 13 rows and 5 columns. The columns are labeled Mean, St. dev., Min, and Max. The rows are labeled with different variables. Row 1: Donation amount, Mean: 14.29, St. dev.: 9.87, Min: 0, Max: 30. Row 2: Post-treatment climate concern, Mean: 16.58, St. dev.: 3.36, Min: 5, Max: 21. Row 3: Pre-treatment climate concern, Mean: 15.92, St. dev.: 3.44, Min: 5, Max: 21. Row 4: Post-treatment climate change assuredness, Mean: 10.67, St. dev.: 0.74, Min: 5, Max: 11. Row 5: Pre-treatment climate change assuredness, Mean: 10.24, St. dev.: 1.01, Min: 6, Max: 11. Row 6: Climate literacy, Mean: 16.75, St. dev.: 2.31, Min: 10, Max: 22. Row 7: Participation in climate solutions, Mean: 2.49, St. dev.: 0.99, Min: 1, Max: 5. Row 8: Previous pro-social behavior, Mean: 11.25, St. dev.: 3.17, Min: 4, Max: 19. Row 9: Political orientation, Mean: 38.99, St. dev.: 23.85, Min: 0, Max: 100. Row 10: Gender, Mean: 5.24, St. dev.: 2.37, Min: 1, Max: 7. Row 11: Activism information, Mean: 0.49, St. dev.: 0.50, Min: 0, Max: 1. Row 12: Protest imagery, Mean: 0.50, St. dev.: 0.50, Min: 0, Max: 1.
Note: N = 367.
Empirical analysis
We exploit randomized assignment in a between-subjects 2 × 2 factorial design to estimate the effects of activism information, protest imagery, and their interaction on donation behavior and climate attitudes. Random assignment helps balance unobserved heterogeneity across treatment arms; we additionally include pre-treatment covariates to improve precision and to account for any chance imbalances that arise in finite samples. Our estimates can be interpreted as intent-to-treat effects.
We code two binary treatment indicators: Protest imagery equals 1 if the infographic included protest imagery (and 0 for neutral tabling imagery), and Activism information equals 1 if the infographic included the additional CCL paragraph (and 0 otherwise). We also include an interaction term Protest imagery × Activism information to capture whether the effect of information differs when paired with protest imagery. Both treatment dimensions were assigned simultaneously by Qualtrics (i.e., there is no ordering in which one treatment “comes before” the other). Our main covariates include pre-treatment climate concern, climate literacy, political orientation, gender, and prior participation in climate solutions.
Our primary behavioral outcome is donation amount, measured in dollars and bounded between $0 and $30 (inclusive of both values). This outcome exhibits corner solutions: participants can give nothing or the full endowment. As such, those endpoints are substantively meaningful choices rather than “outliers.” We therefore estimate Tobit models censored at 0 and 30 to explicitly account for the lower and upper bounds and to avoid the drawbacks of linear models in this setting (e.g., OLS can predict values outside the feasible range and does not account for the pile-up of observations at the bounds). Conceptually, the Tobit specification treats observed donations as the censored realization of an underlying latent WTD index, allowing treatment effects to be reflected both in (i) the probability of being at a corner (especially $0 or $30) and (ii) changes in the conditional mean donation among interior values.
To complement this mean/latent-index perspective, and as donation choices in our data are heaped at focal values (e.g., $5 increments), we also estimate an ordered logit model using seven donation bins: Bin 1 ($0), Bin 2 ($1–5), Bin 3 ($6–10), Bin 4 ($11–15), Bin 5 ($16–20), Bin 6 ($21–25), and Bin 7 ($26–30). The ordered logit provides a distributional view of treatment effects by estimating how treatments shift the probability mass across low-, middle-, and high-giving ranges, rather than summarizing effects only through a single conditional mean. This is useful because two treatments can have similar effects on the mean donation yet differ meaningfully in where changes occur (e.g., moving donors from the top bin into middle bins versus increasing the probability of zero donations). It also improves interpretability relative to a binary logit/probit on “any donation,” which captures only the extensive margin and discards information on donation intensity. We report marginal effects by bin to make these probability shifts transparent. Finally, to examine effects on post-treatment climate concern (bounded between 5 and 21), we estimate a Tobit model censored at these bounds, which respects the scale limits of the outcome.
Results
In this section, we discuss our findings. The section begins with a review of summary statistics and the examination of some general relationships between our variables of interest and dependent variables. We then present our findings from our econometric specifications. The section concludes with a discussion of the findings.
Summary statistics
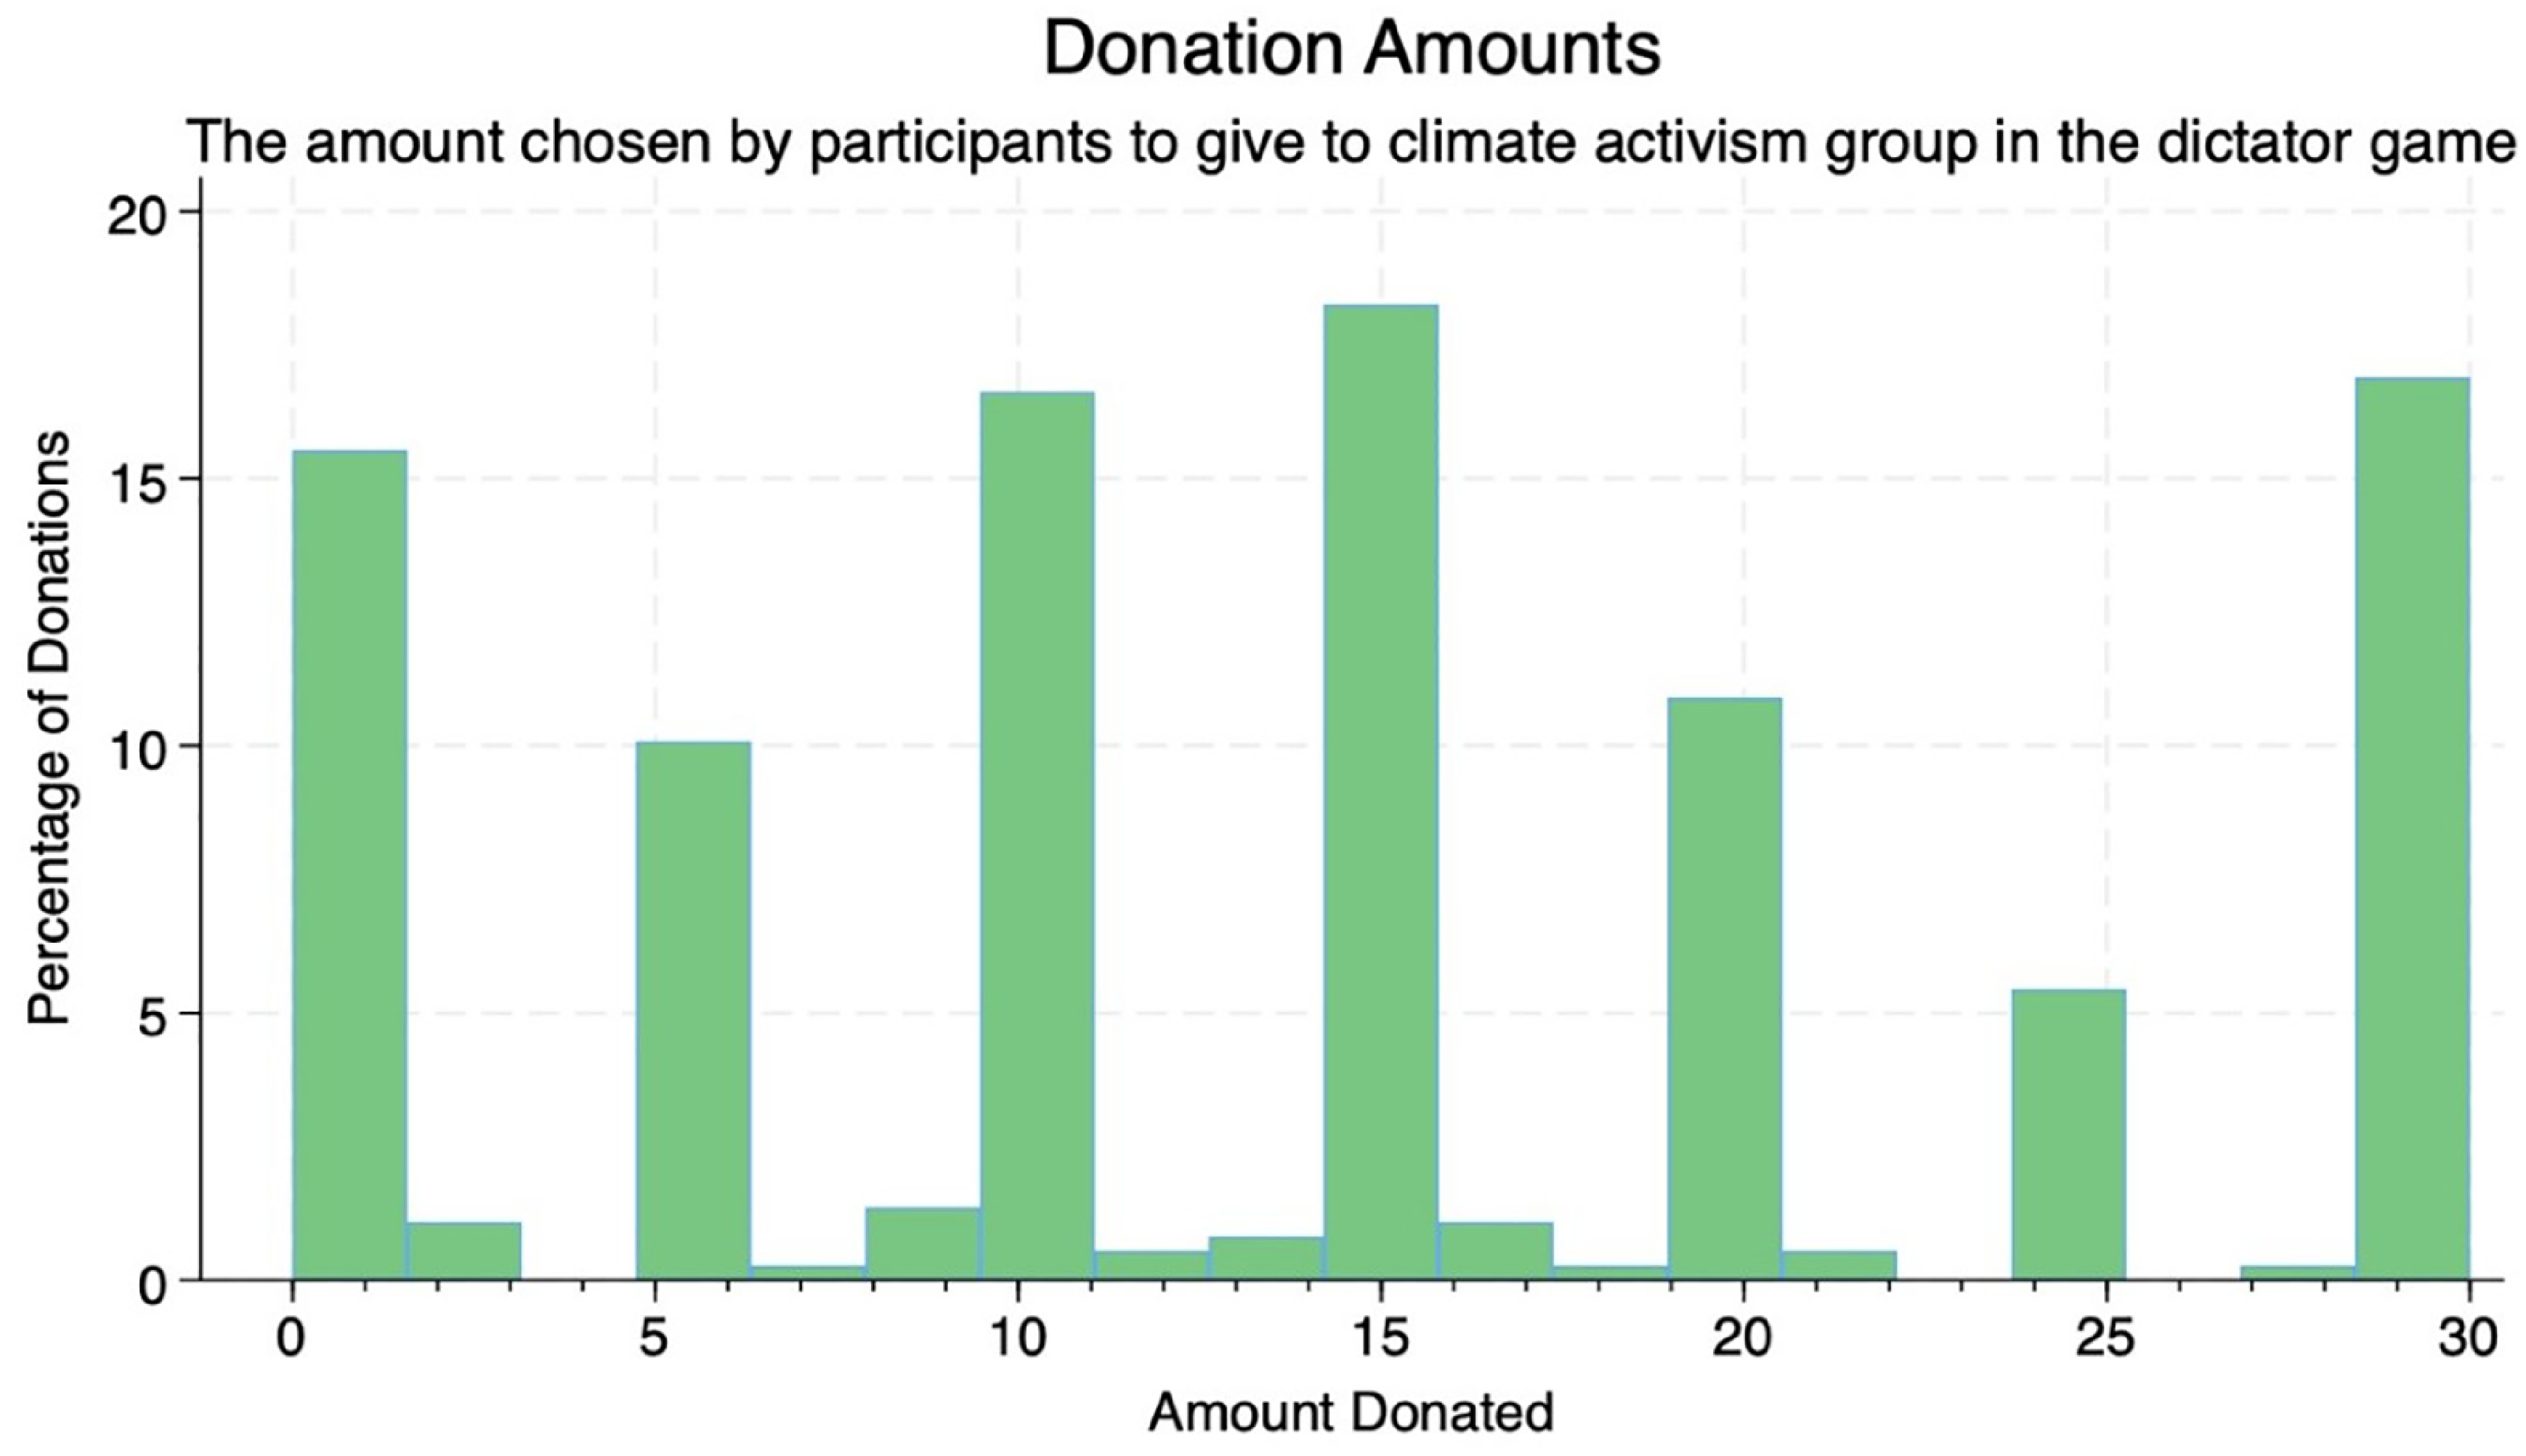
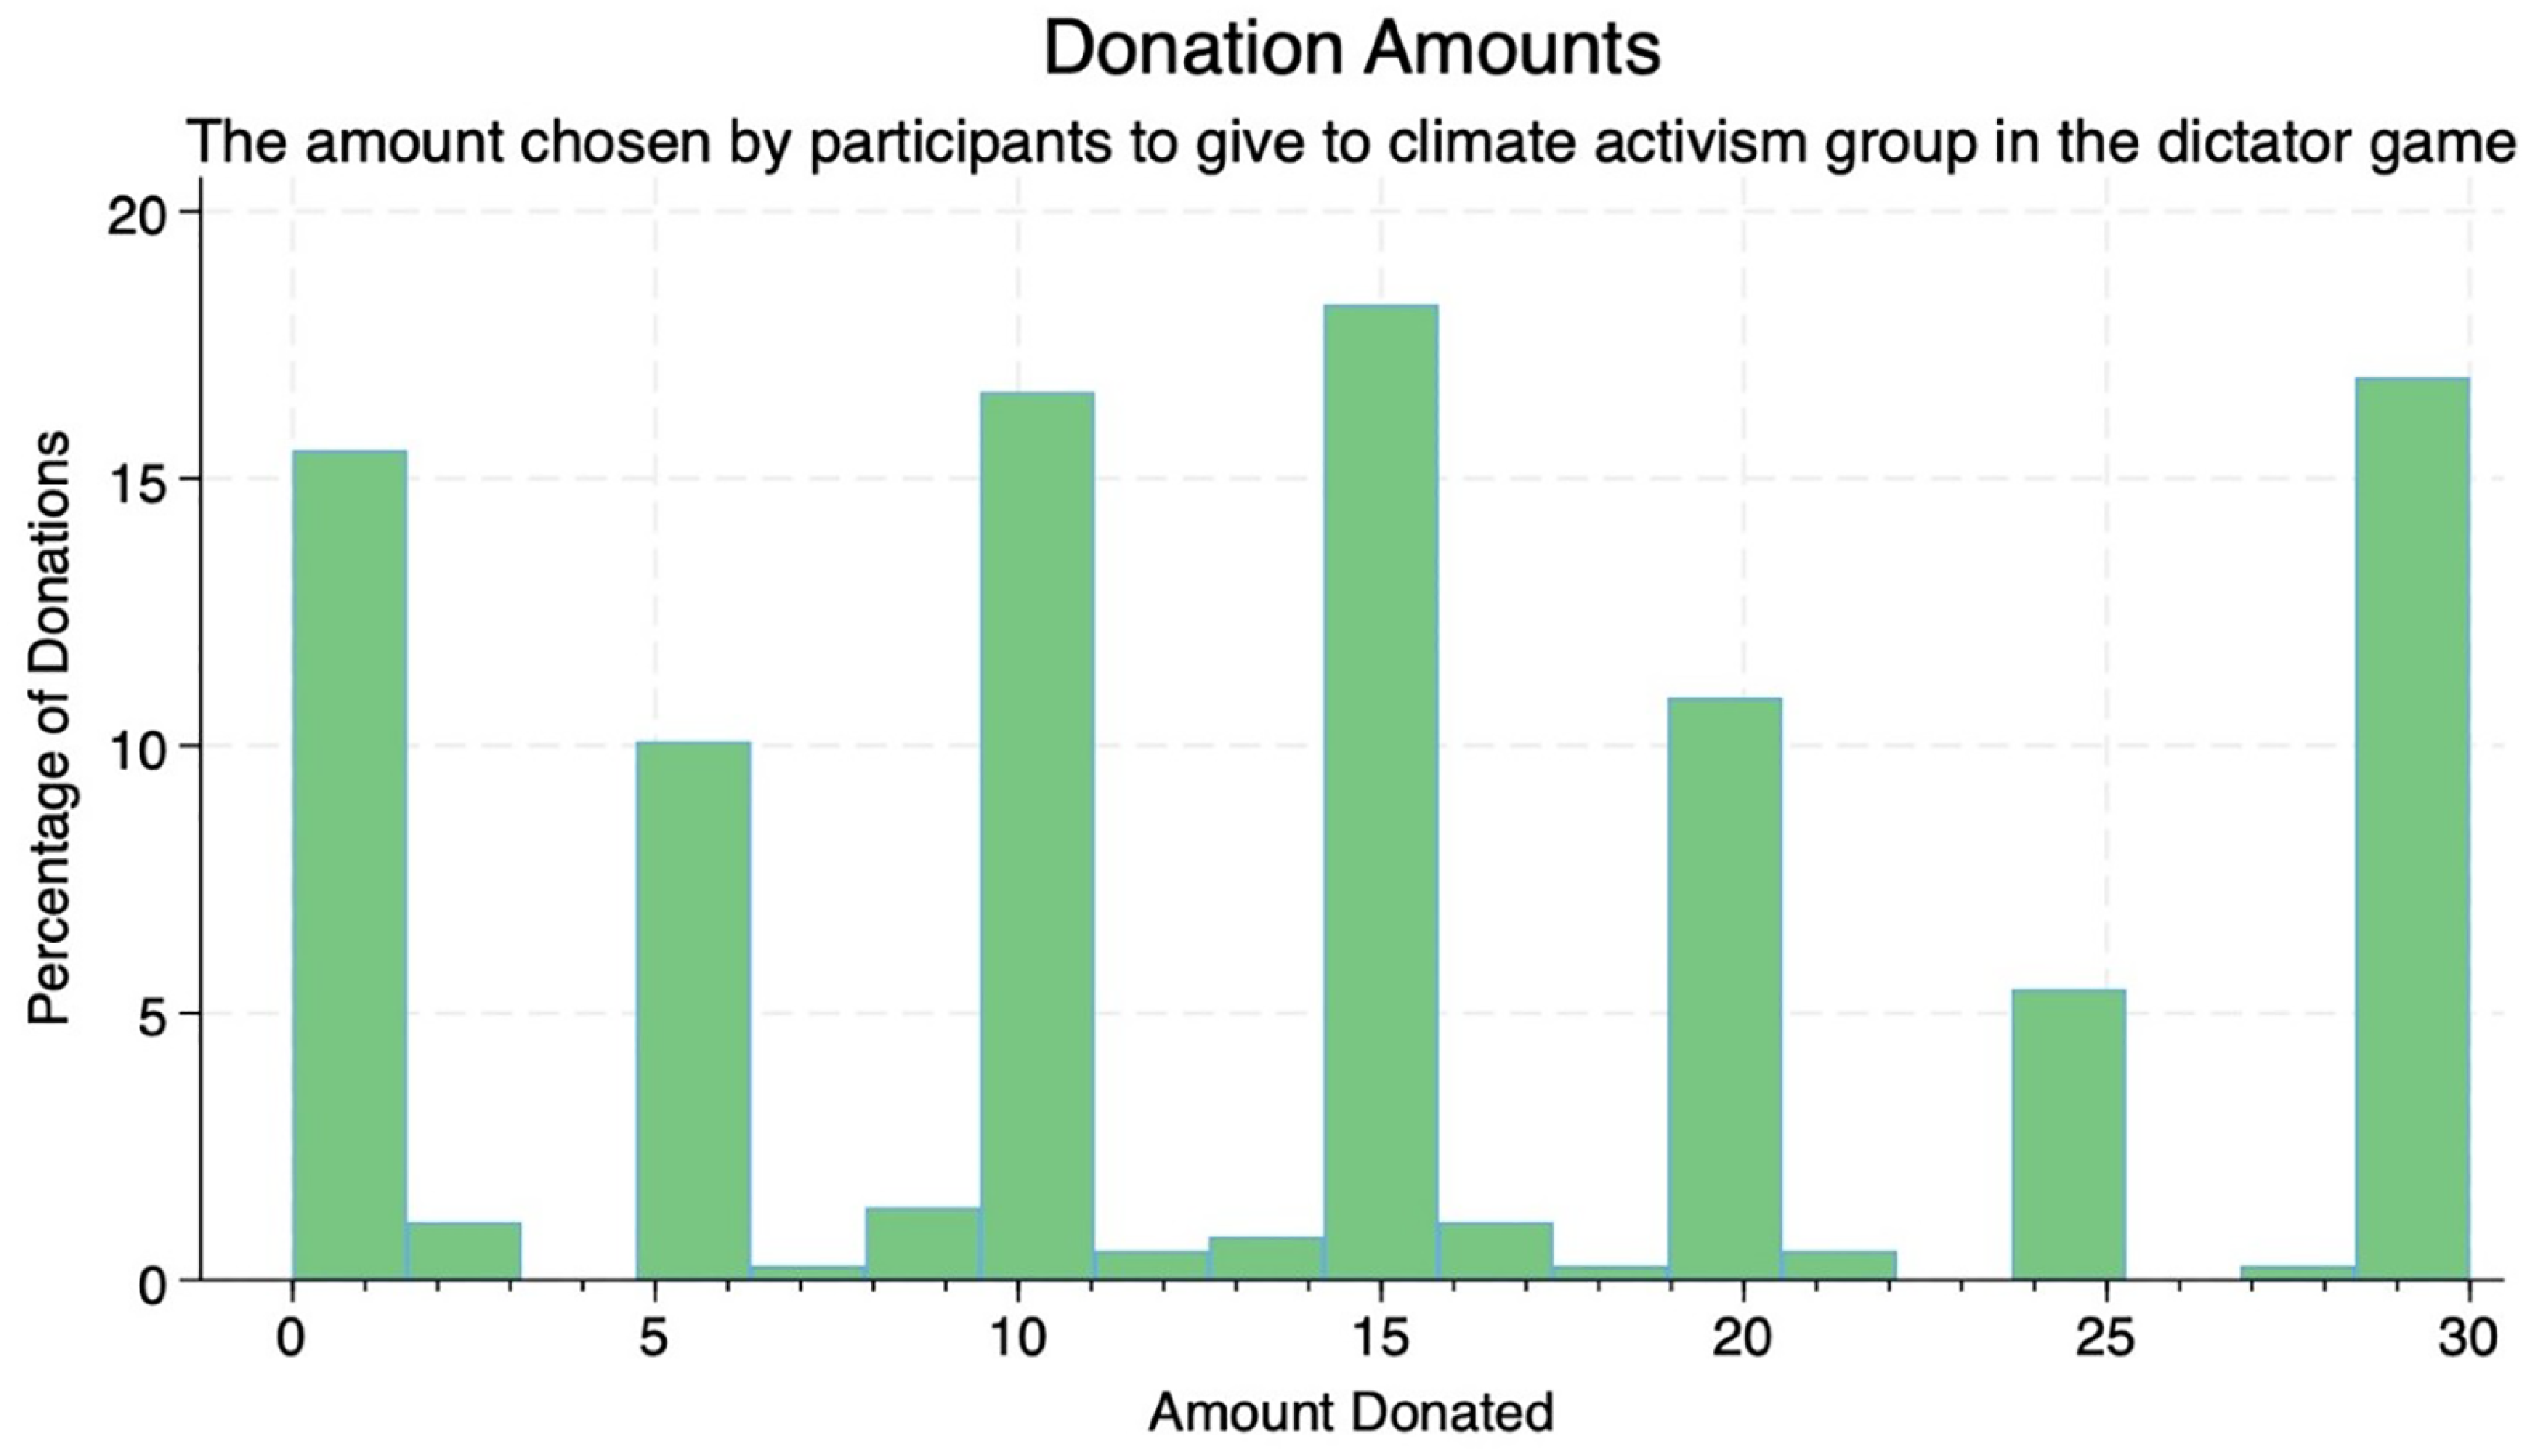
We find that the average donation was $14.28 (47.6% of the endowment). In total, 86.92% of participants donated, with 16.35% donating the full endowment, and 13.08% donating zero. The median amount given was $15 (18.26% of the sample). The average donation lies toward the upper range of charitable giving experiments in which the recipient is a charity or cause (Cartwright and Thompson Reference Cartwright and Thompson2023; Shreedhar and Mourato Reference Shreedhar and Mourato2019). Figure 2 illustrates the distribution of donation amounts; donations cluster at $5 intervals, consistent with round-number bias (Coupland Reference Coupland2011).
Donation amount.
Note: The figure presents donation amounts, in dollars, given by participants to climate activism.
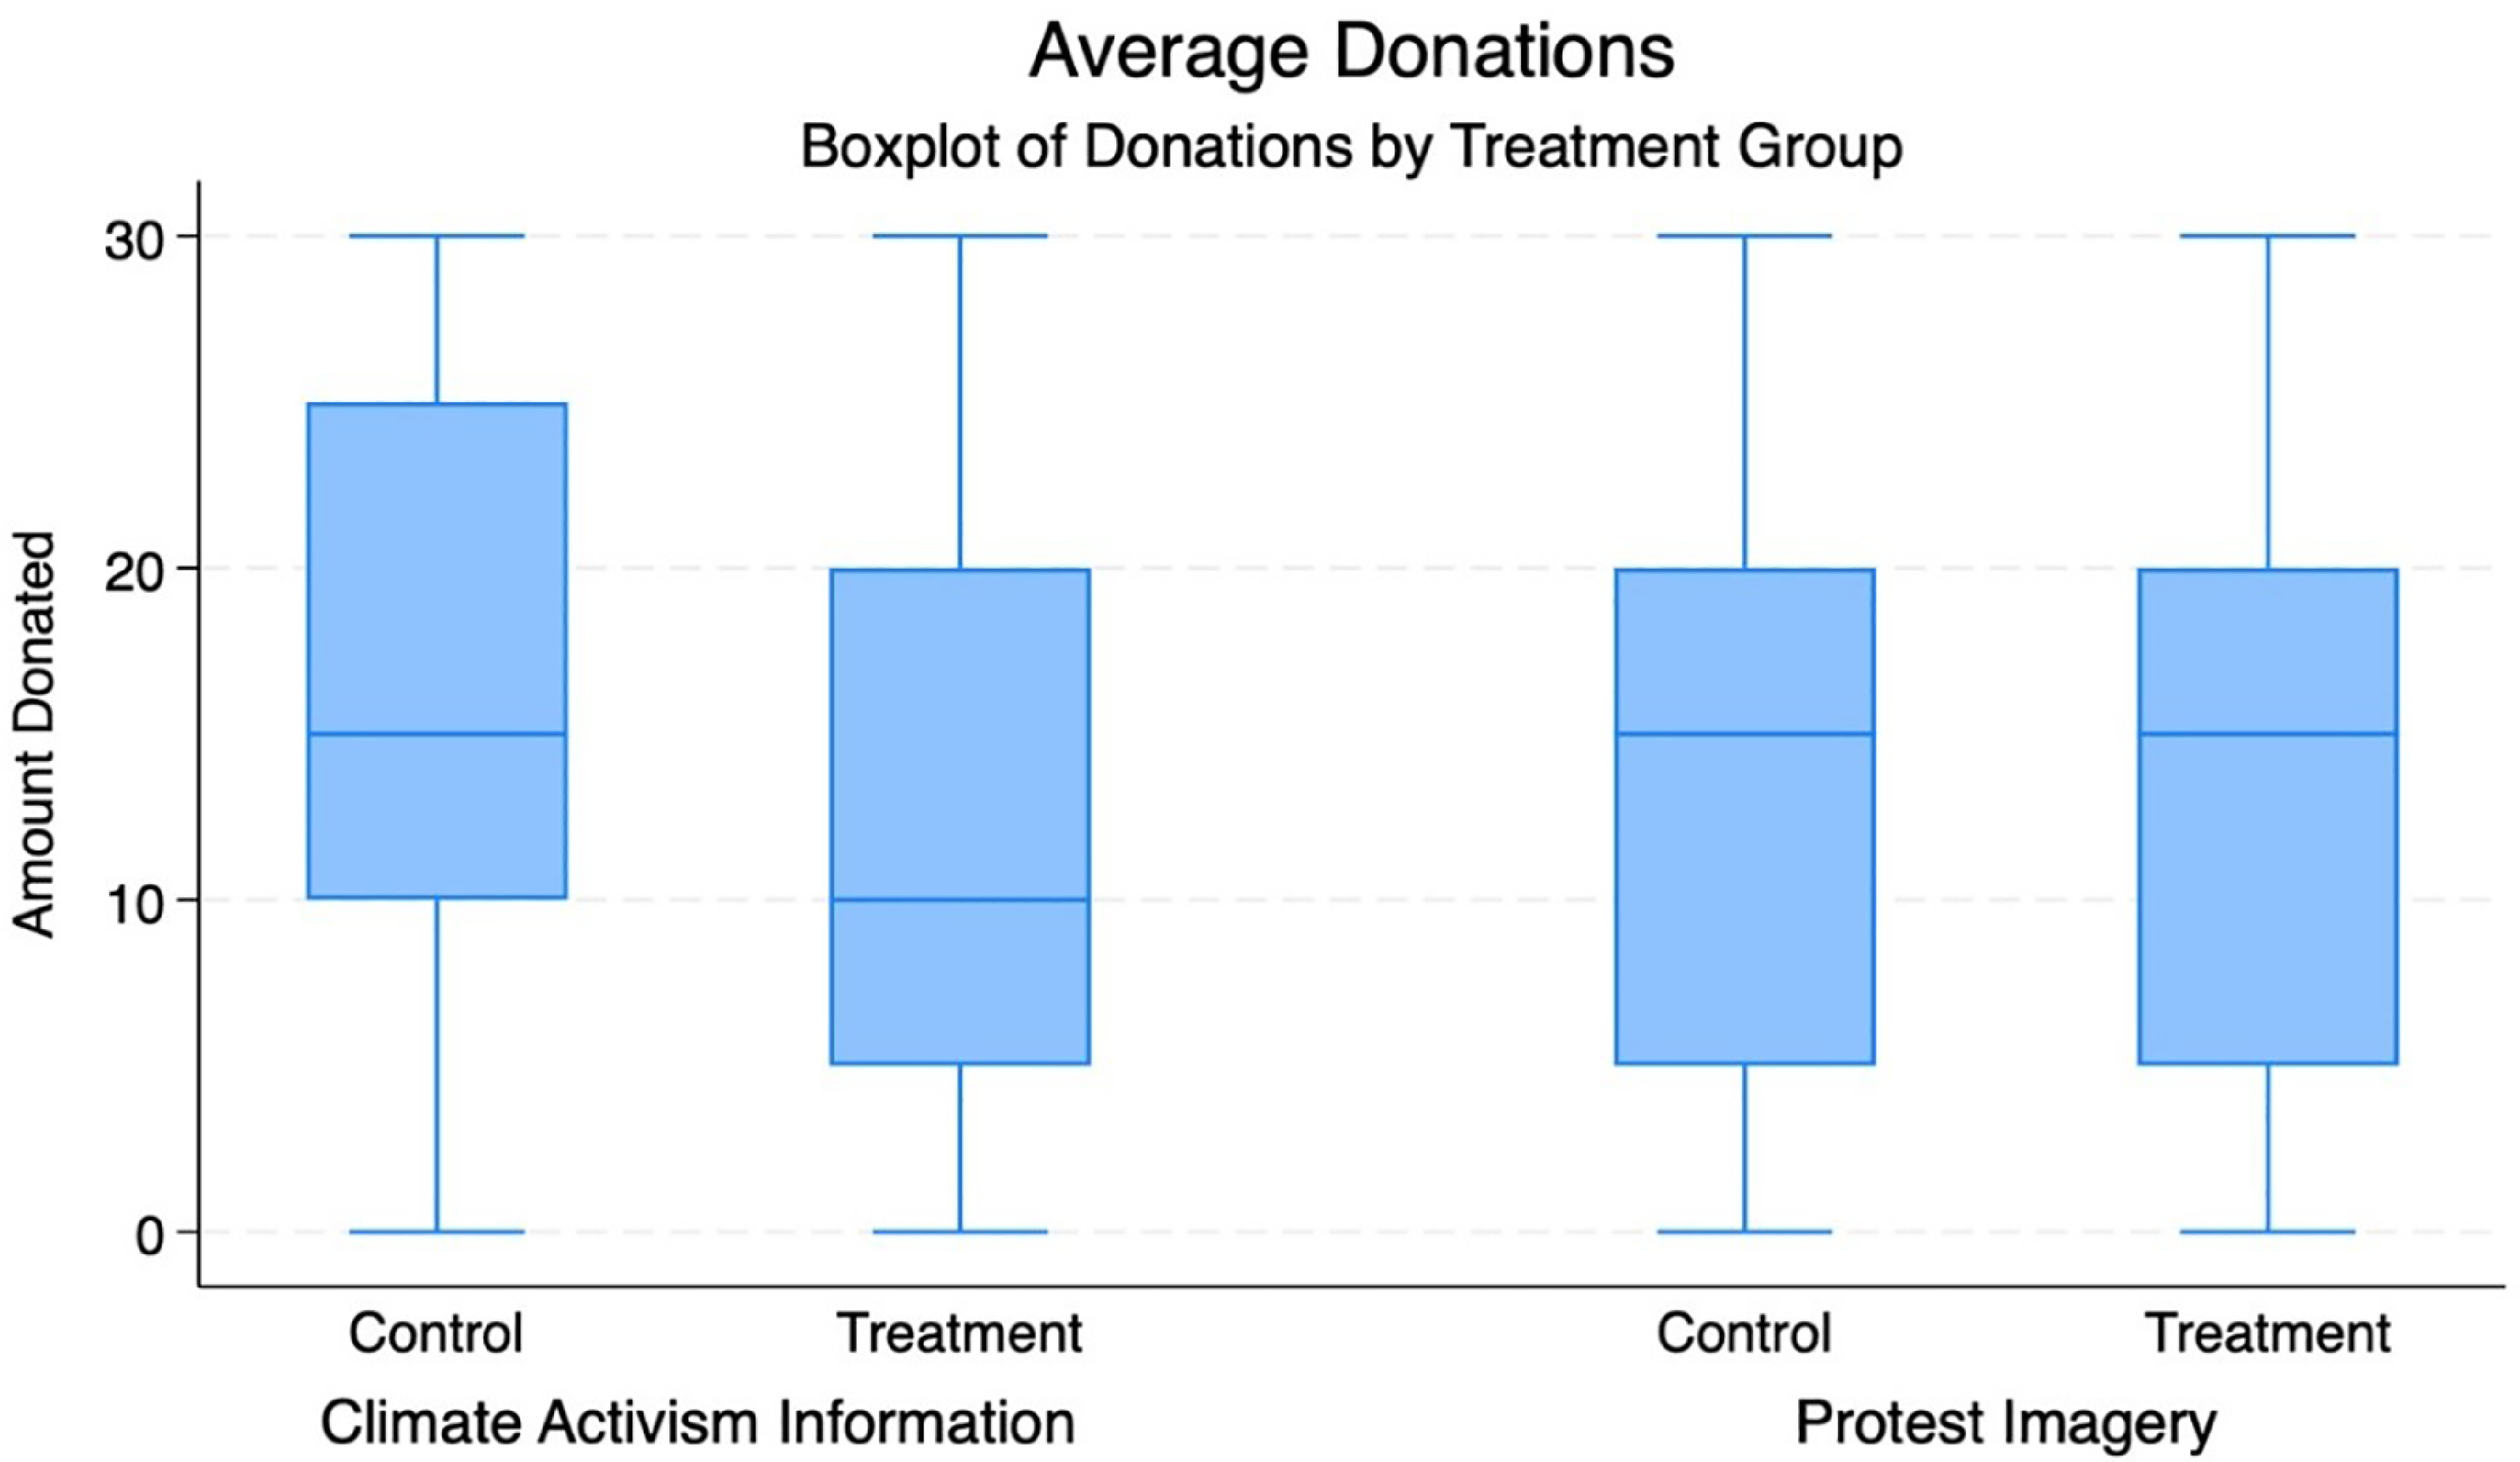
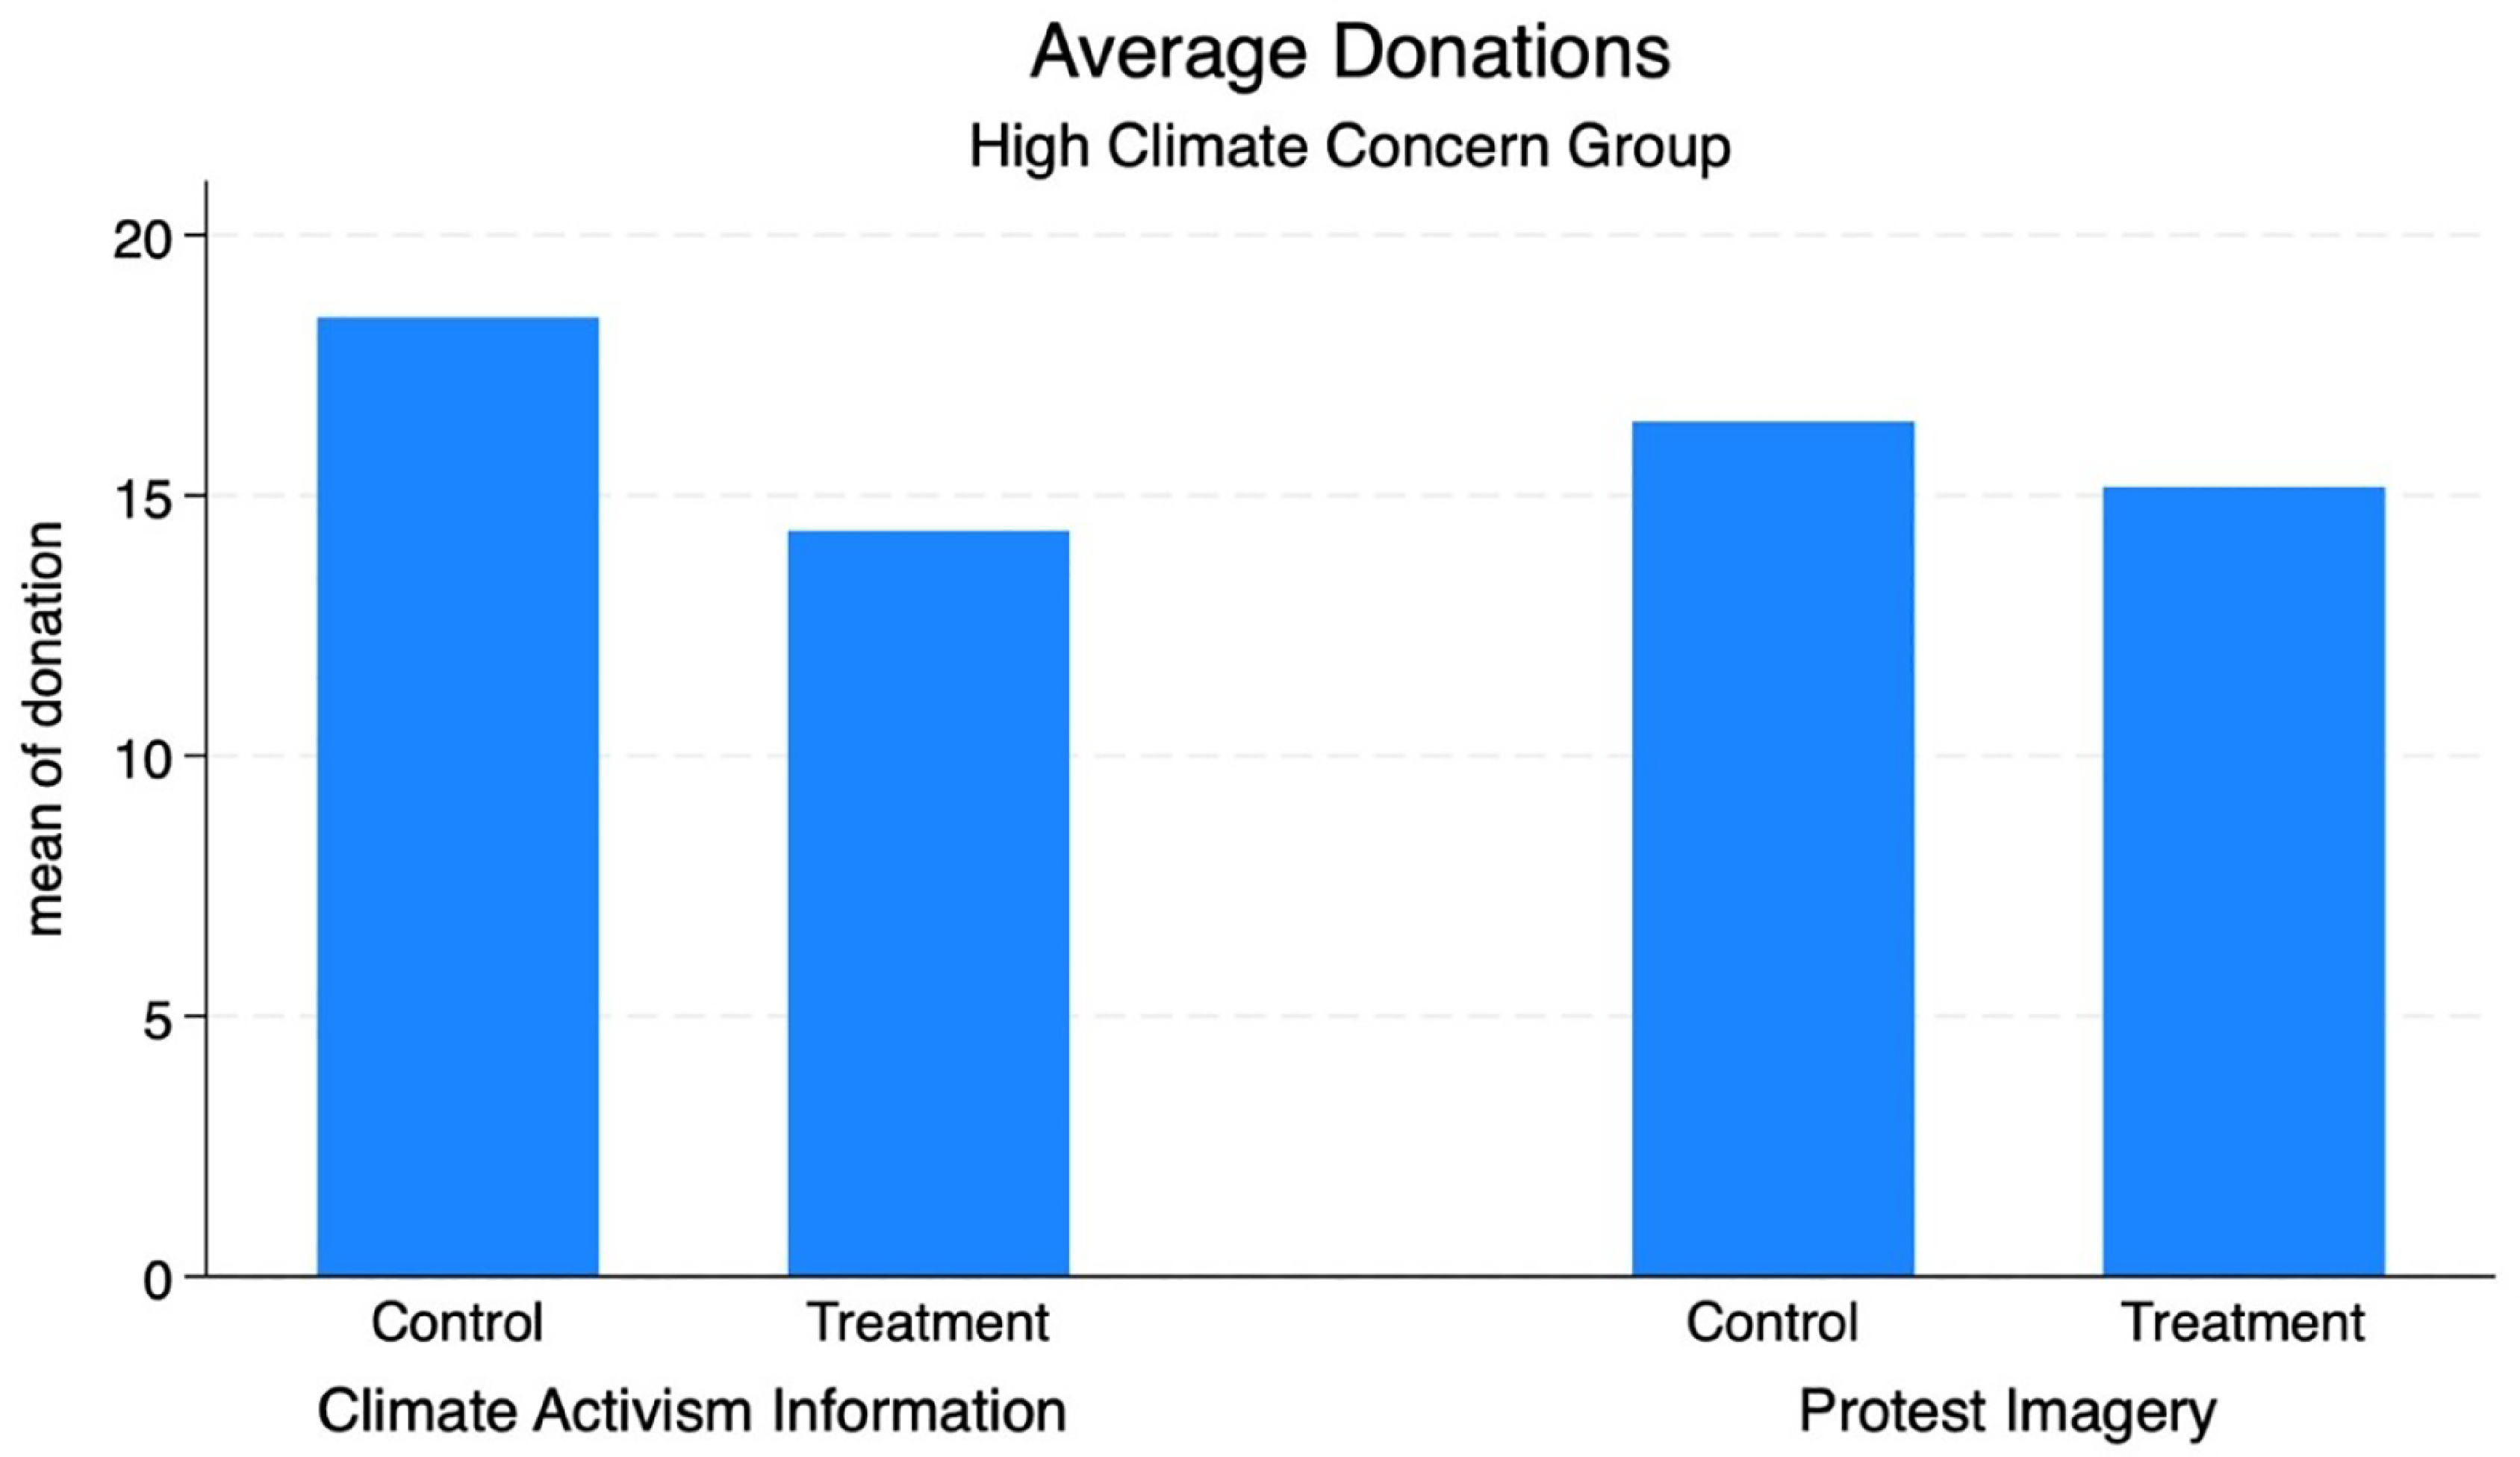
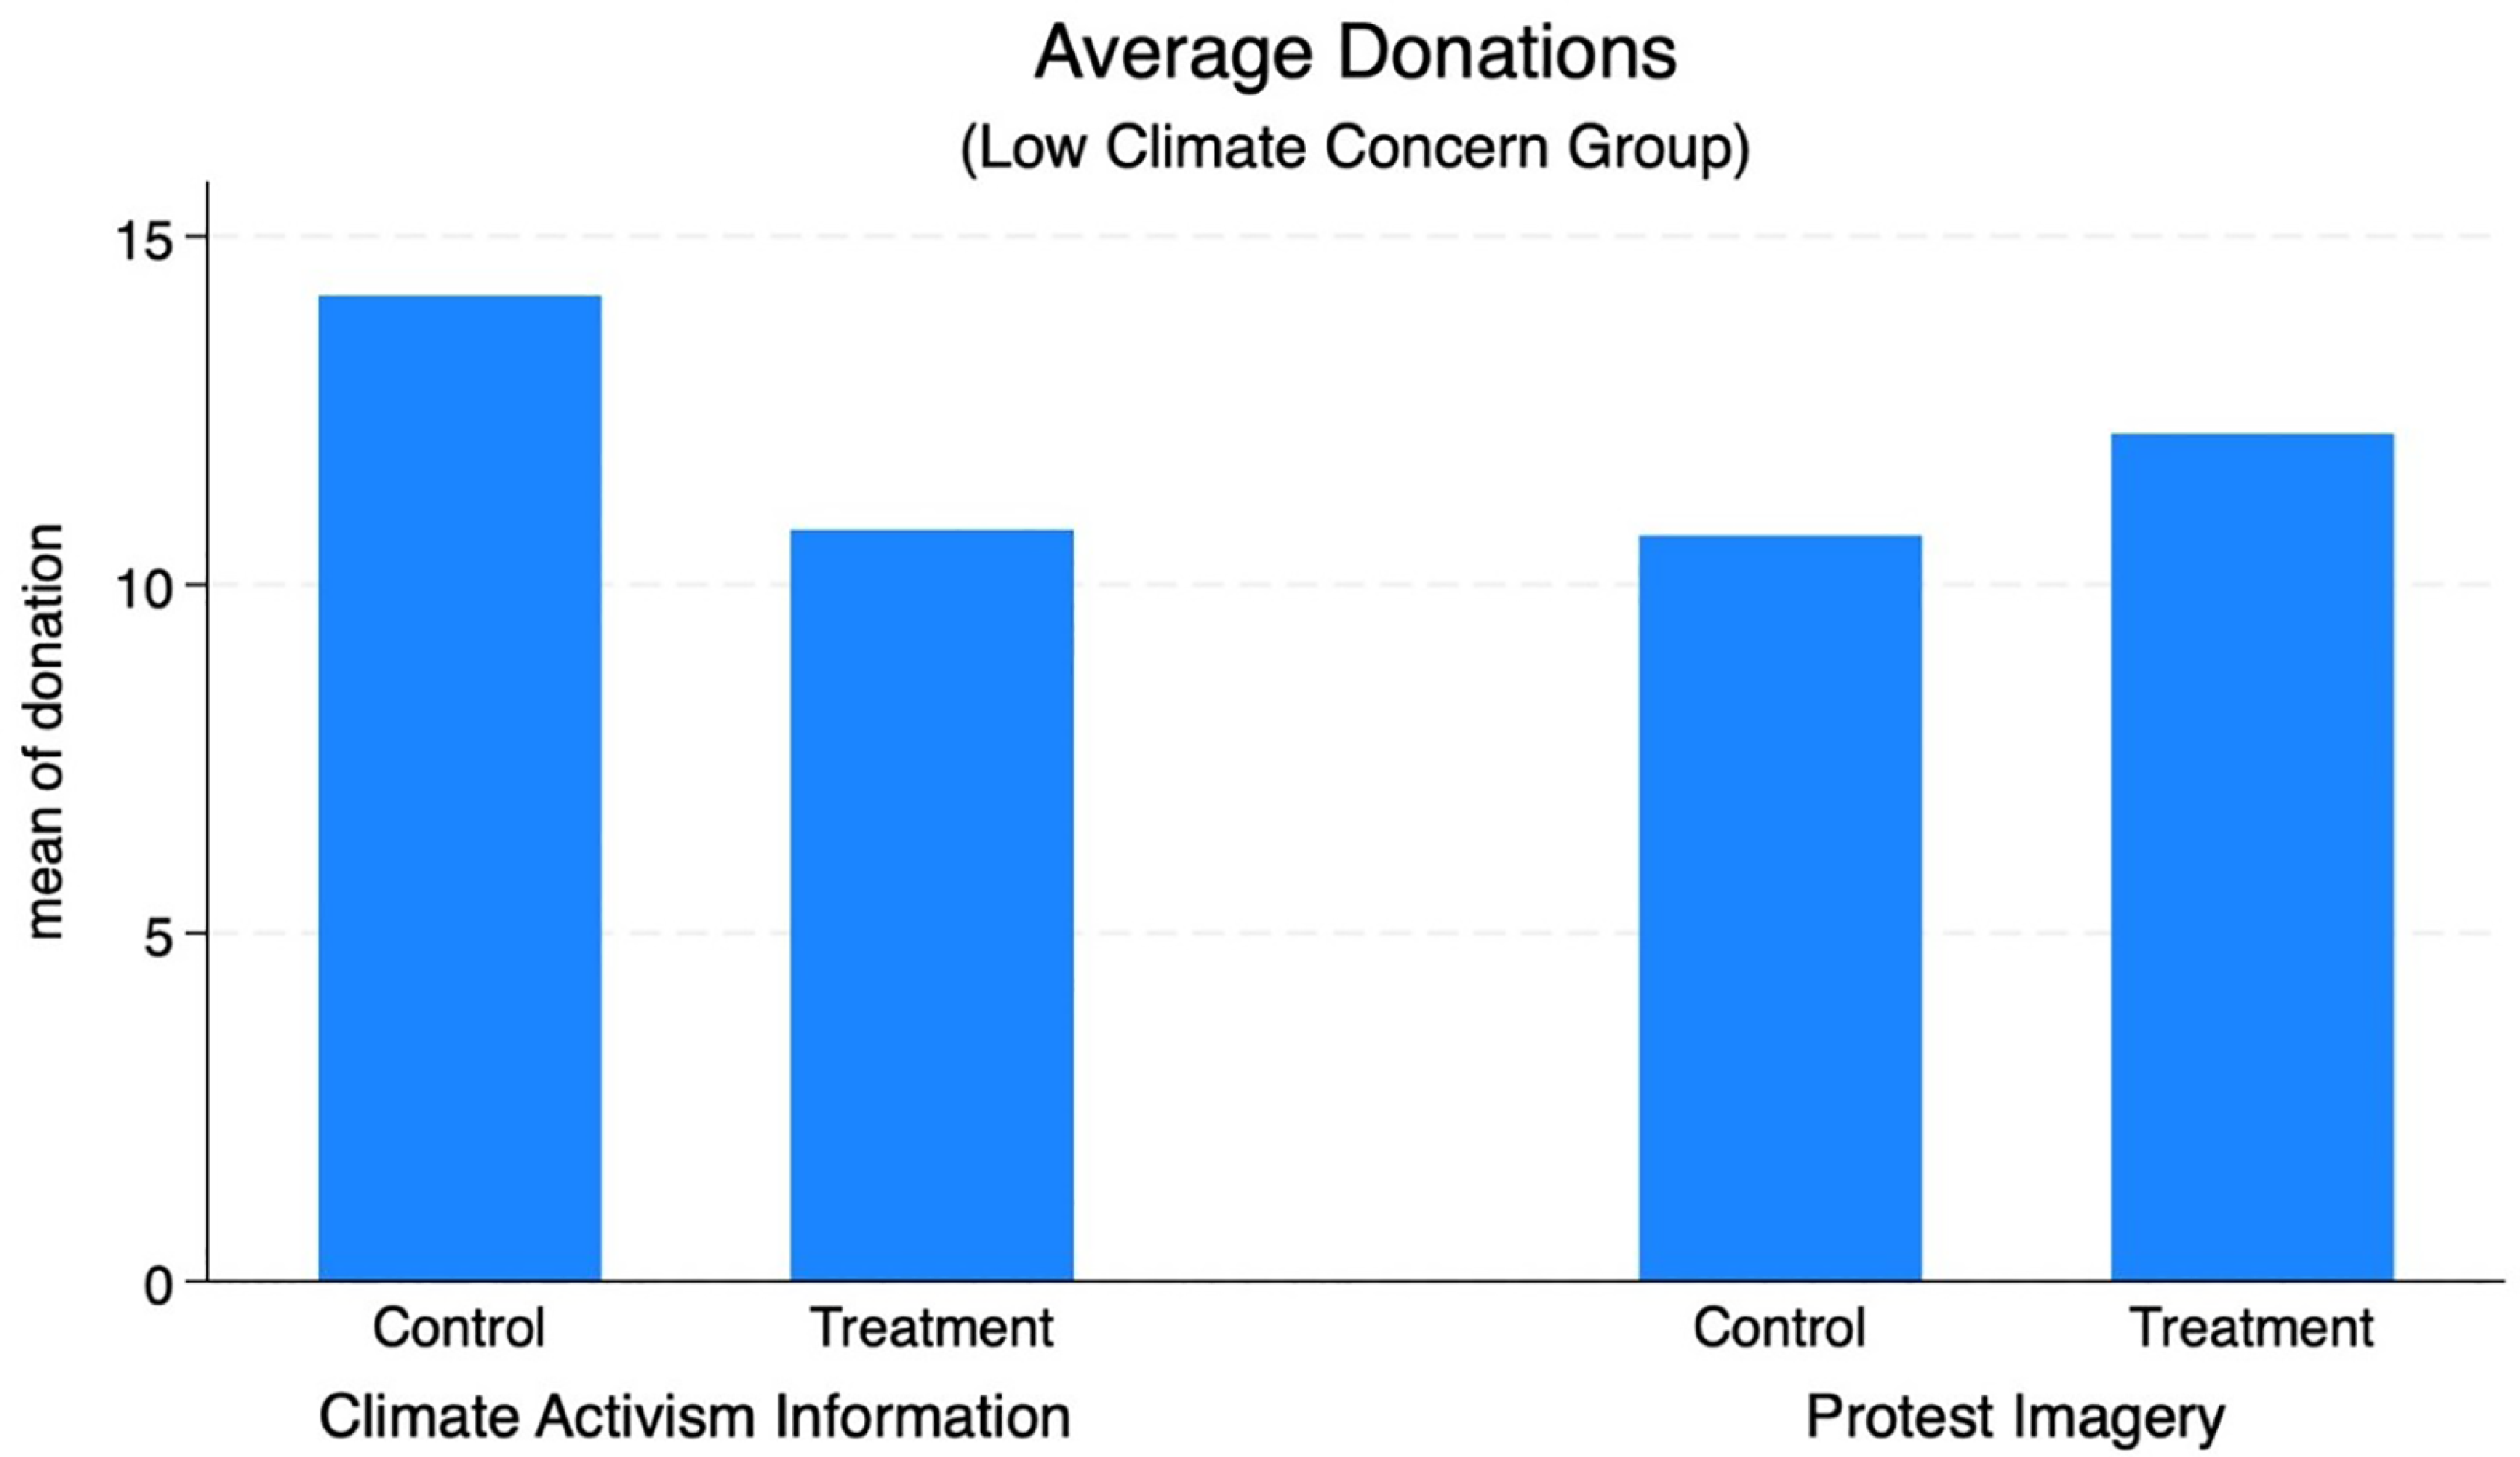
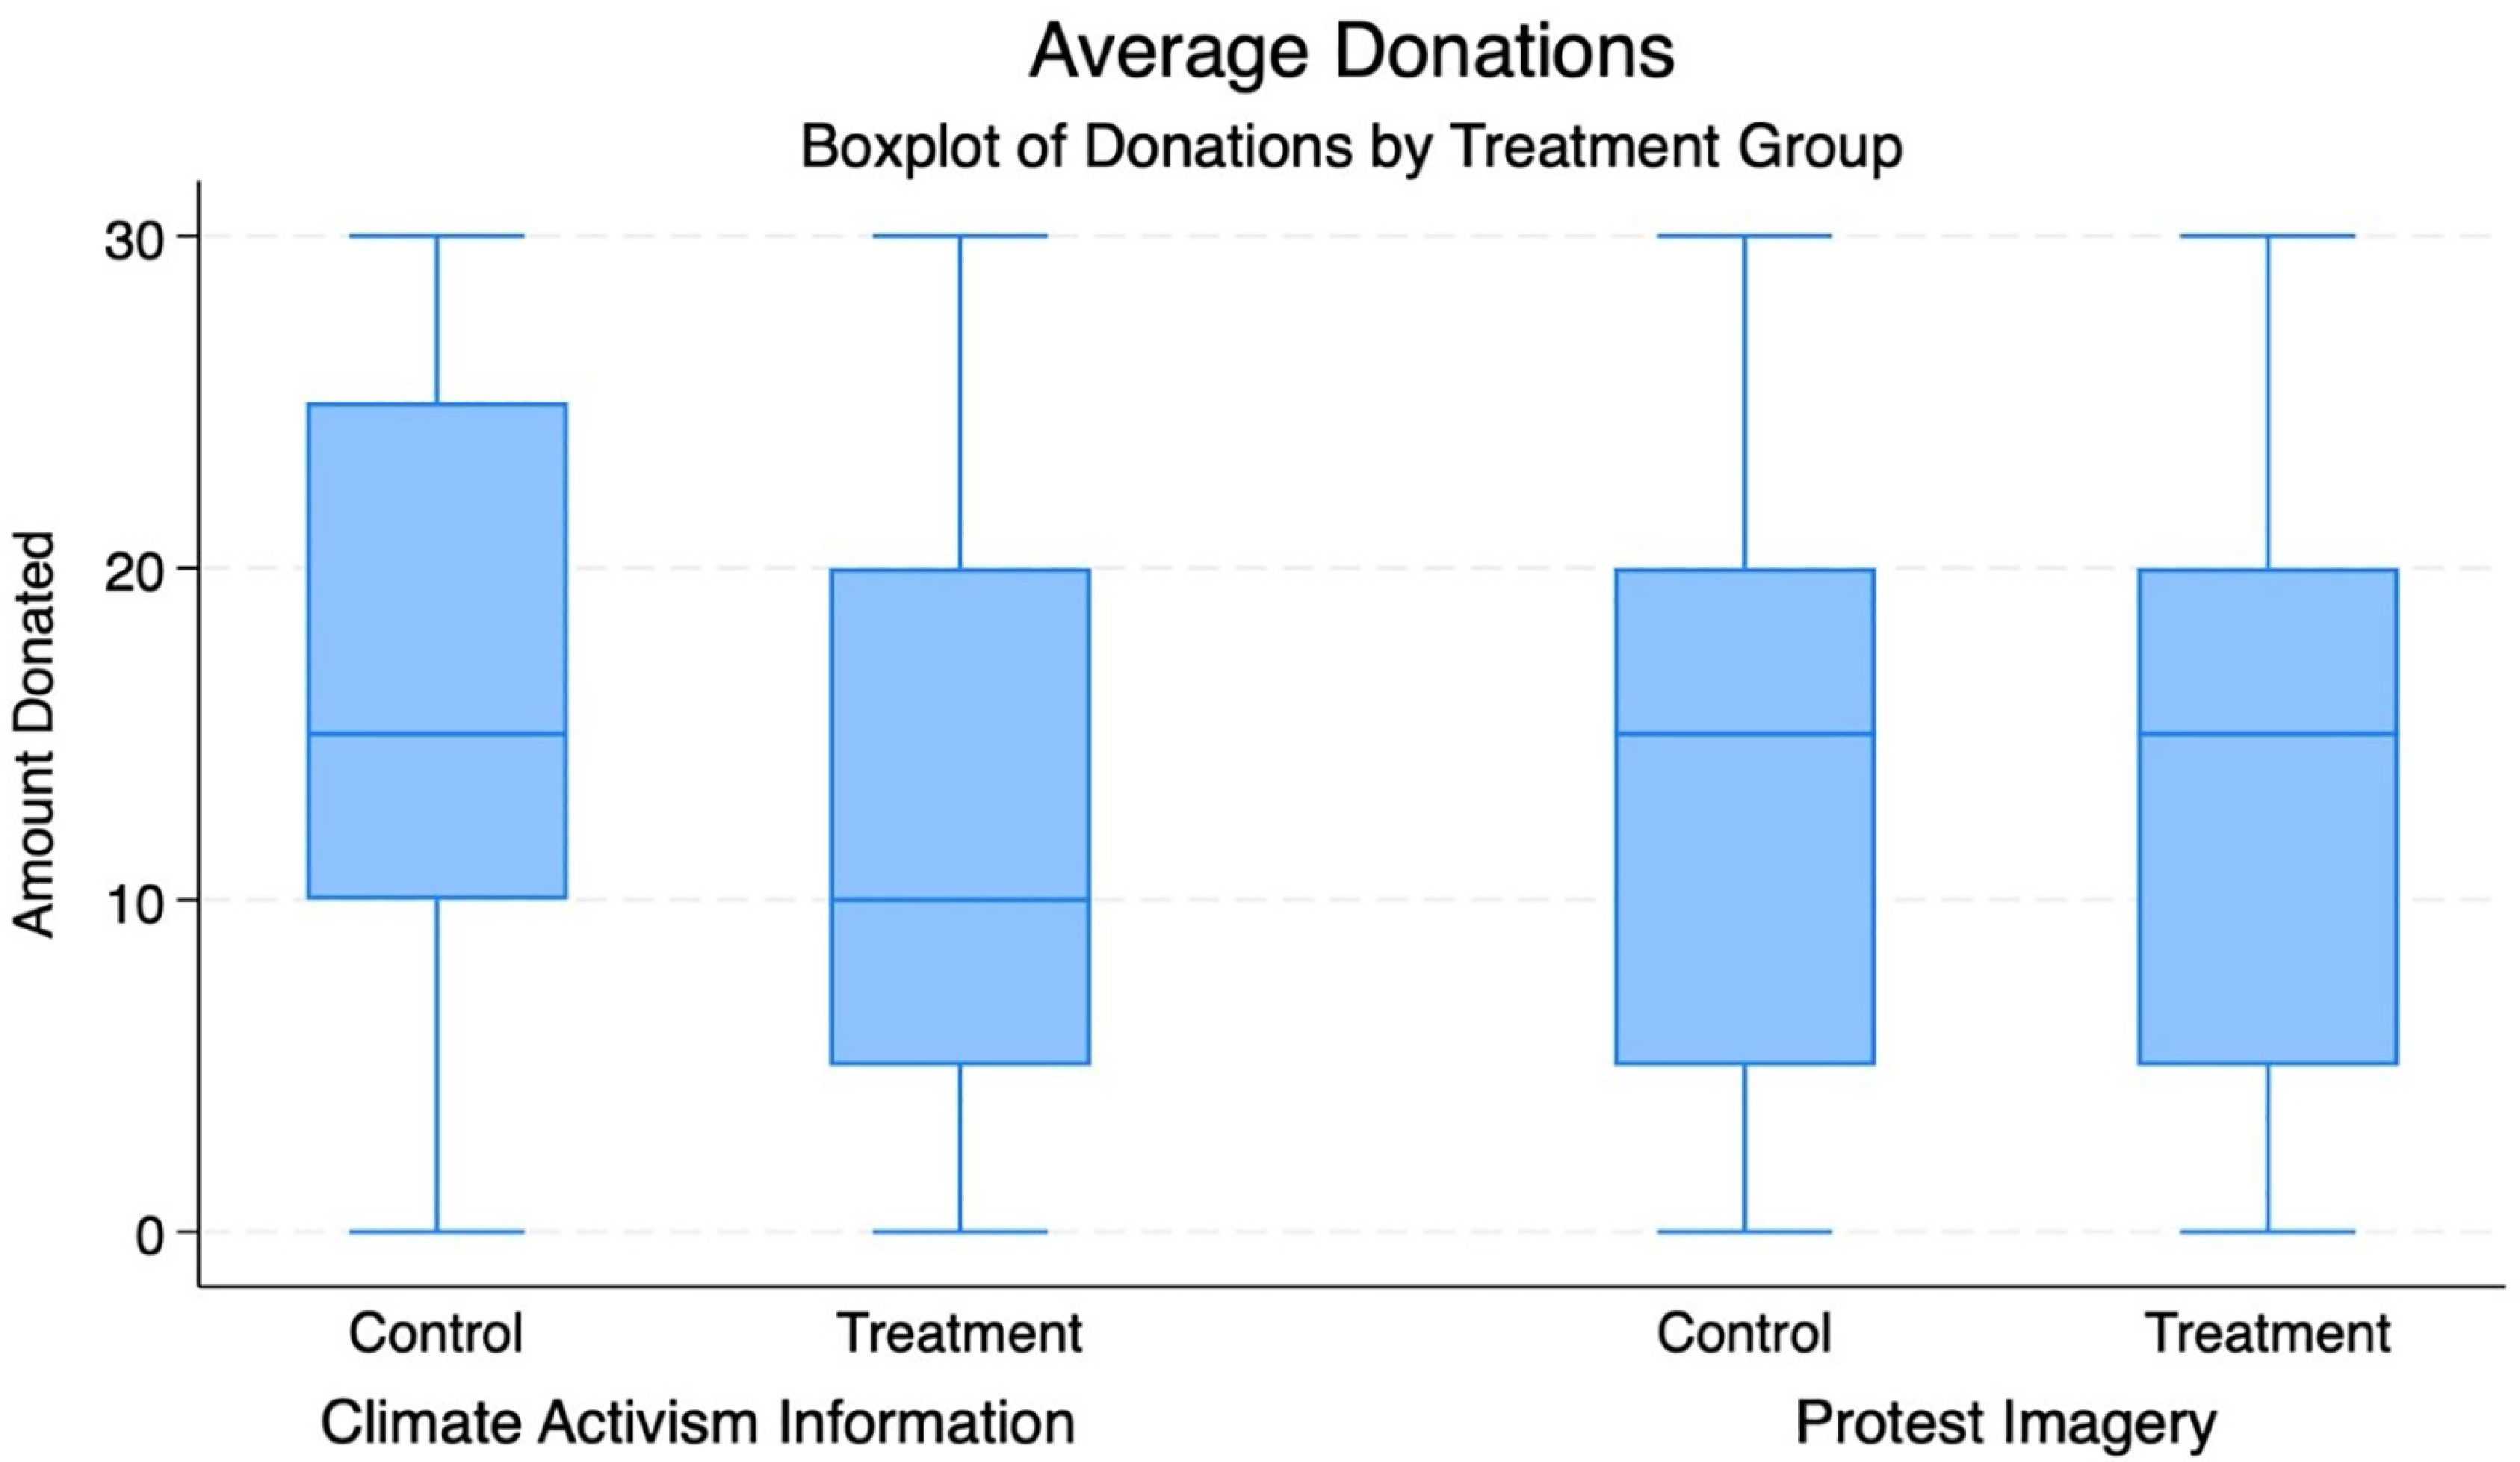
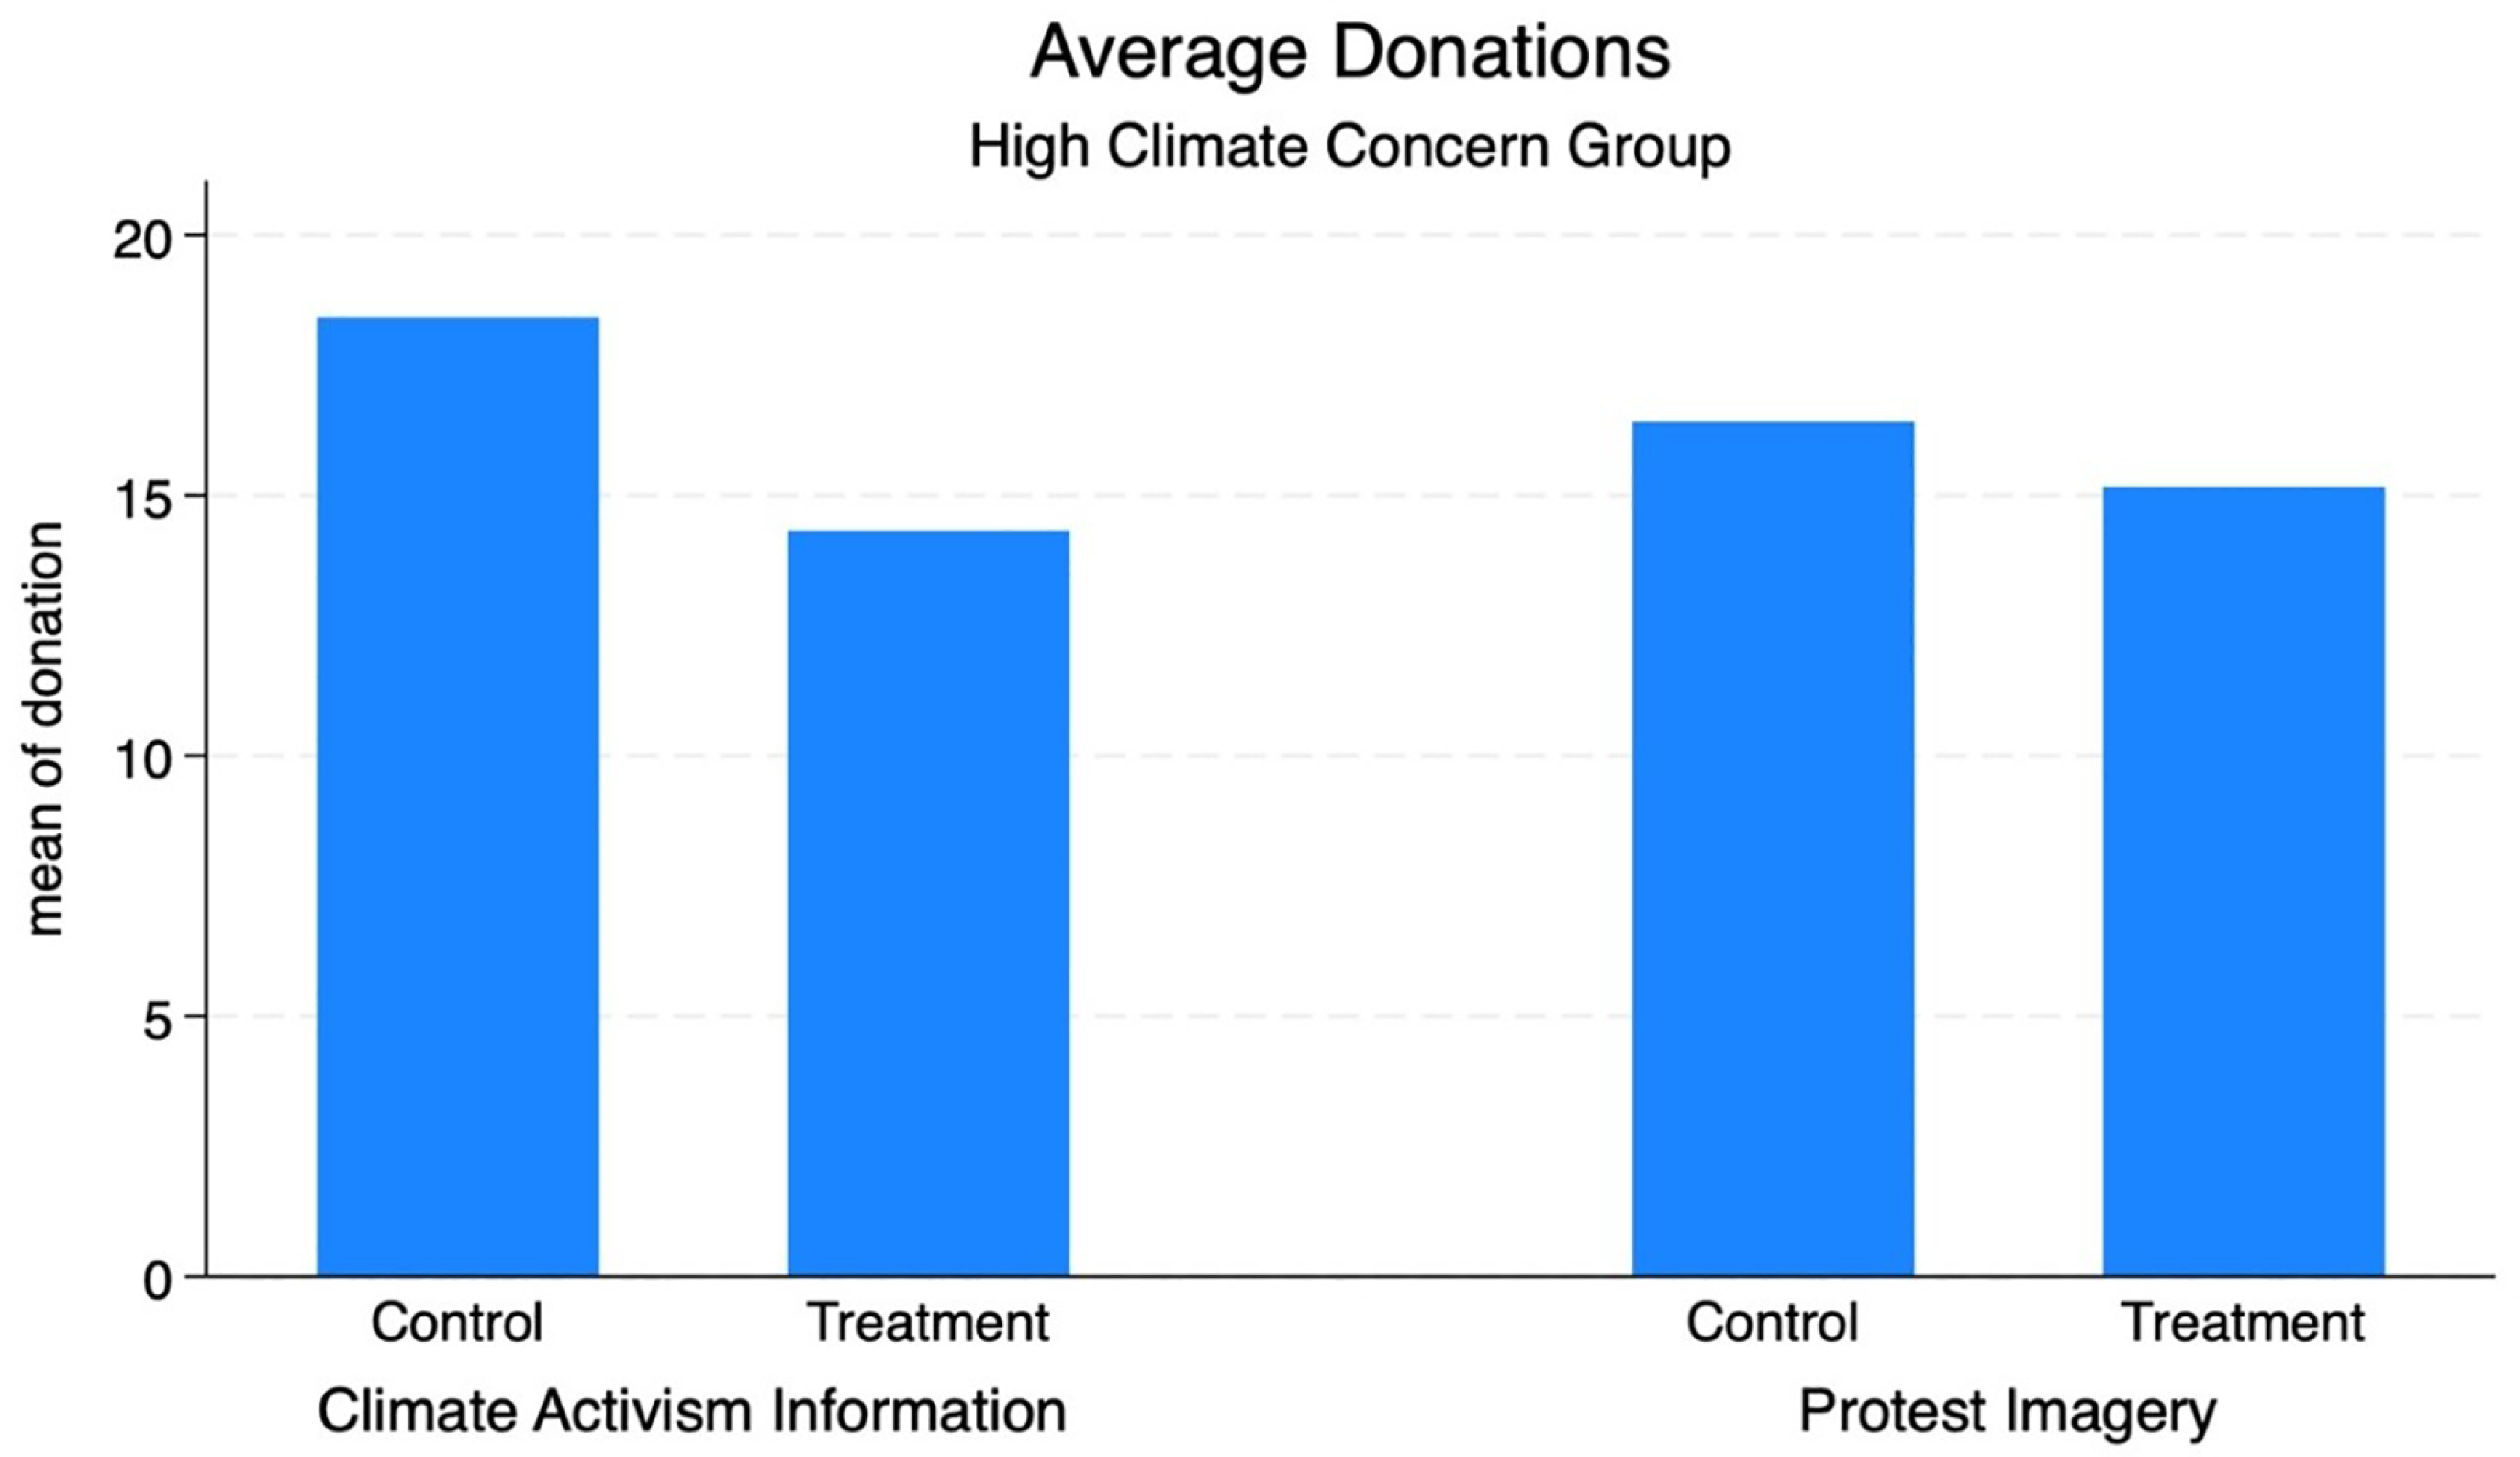
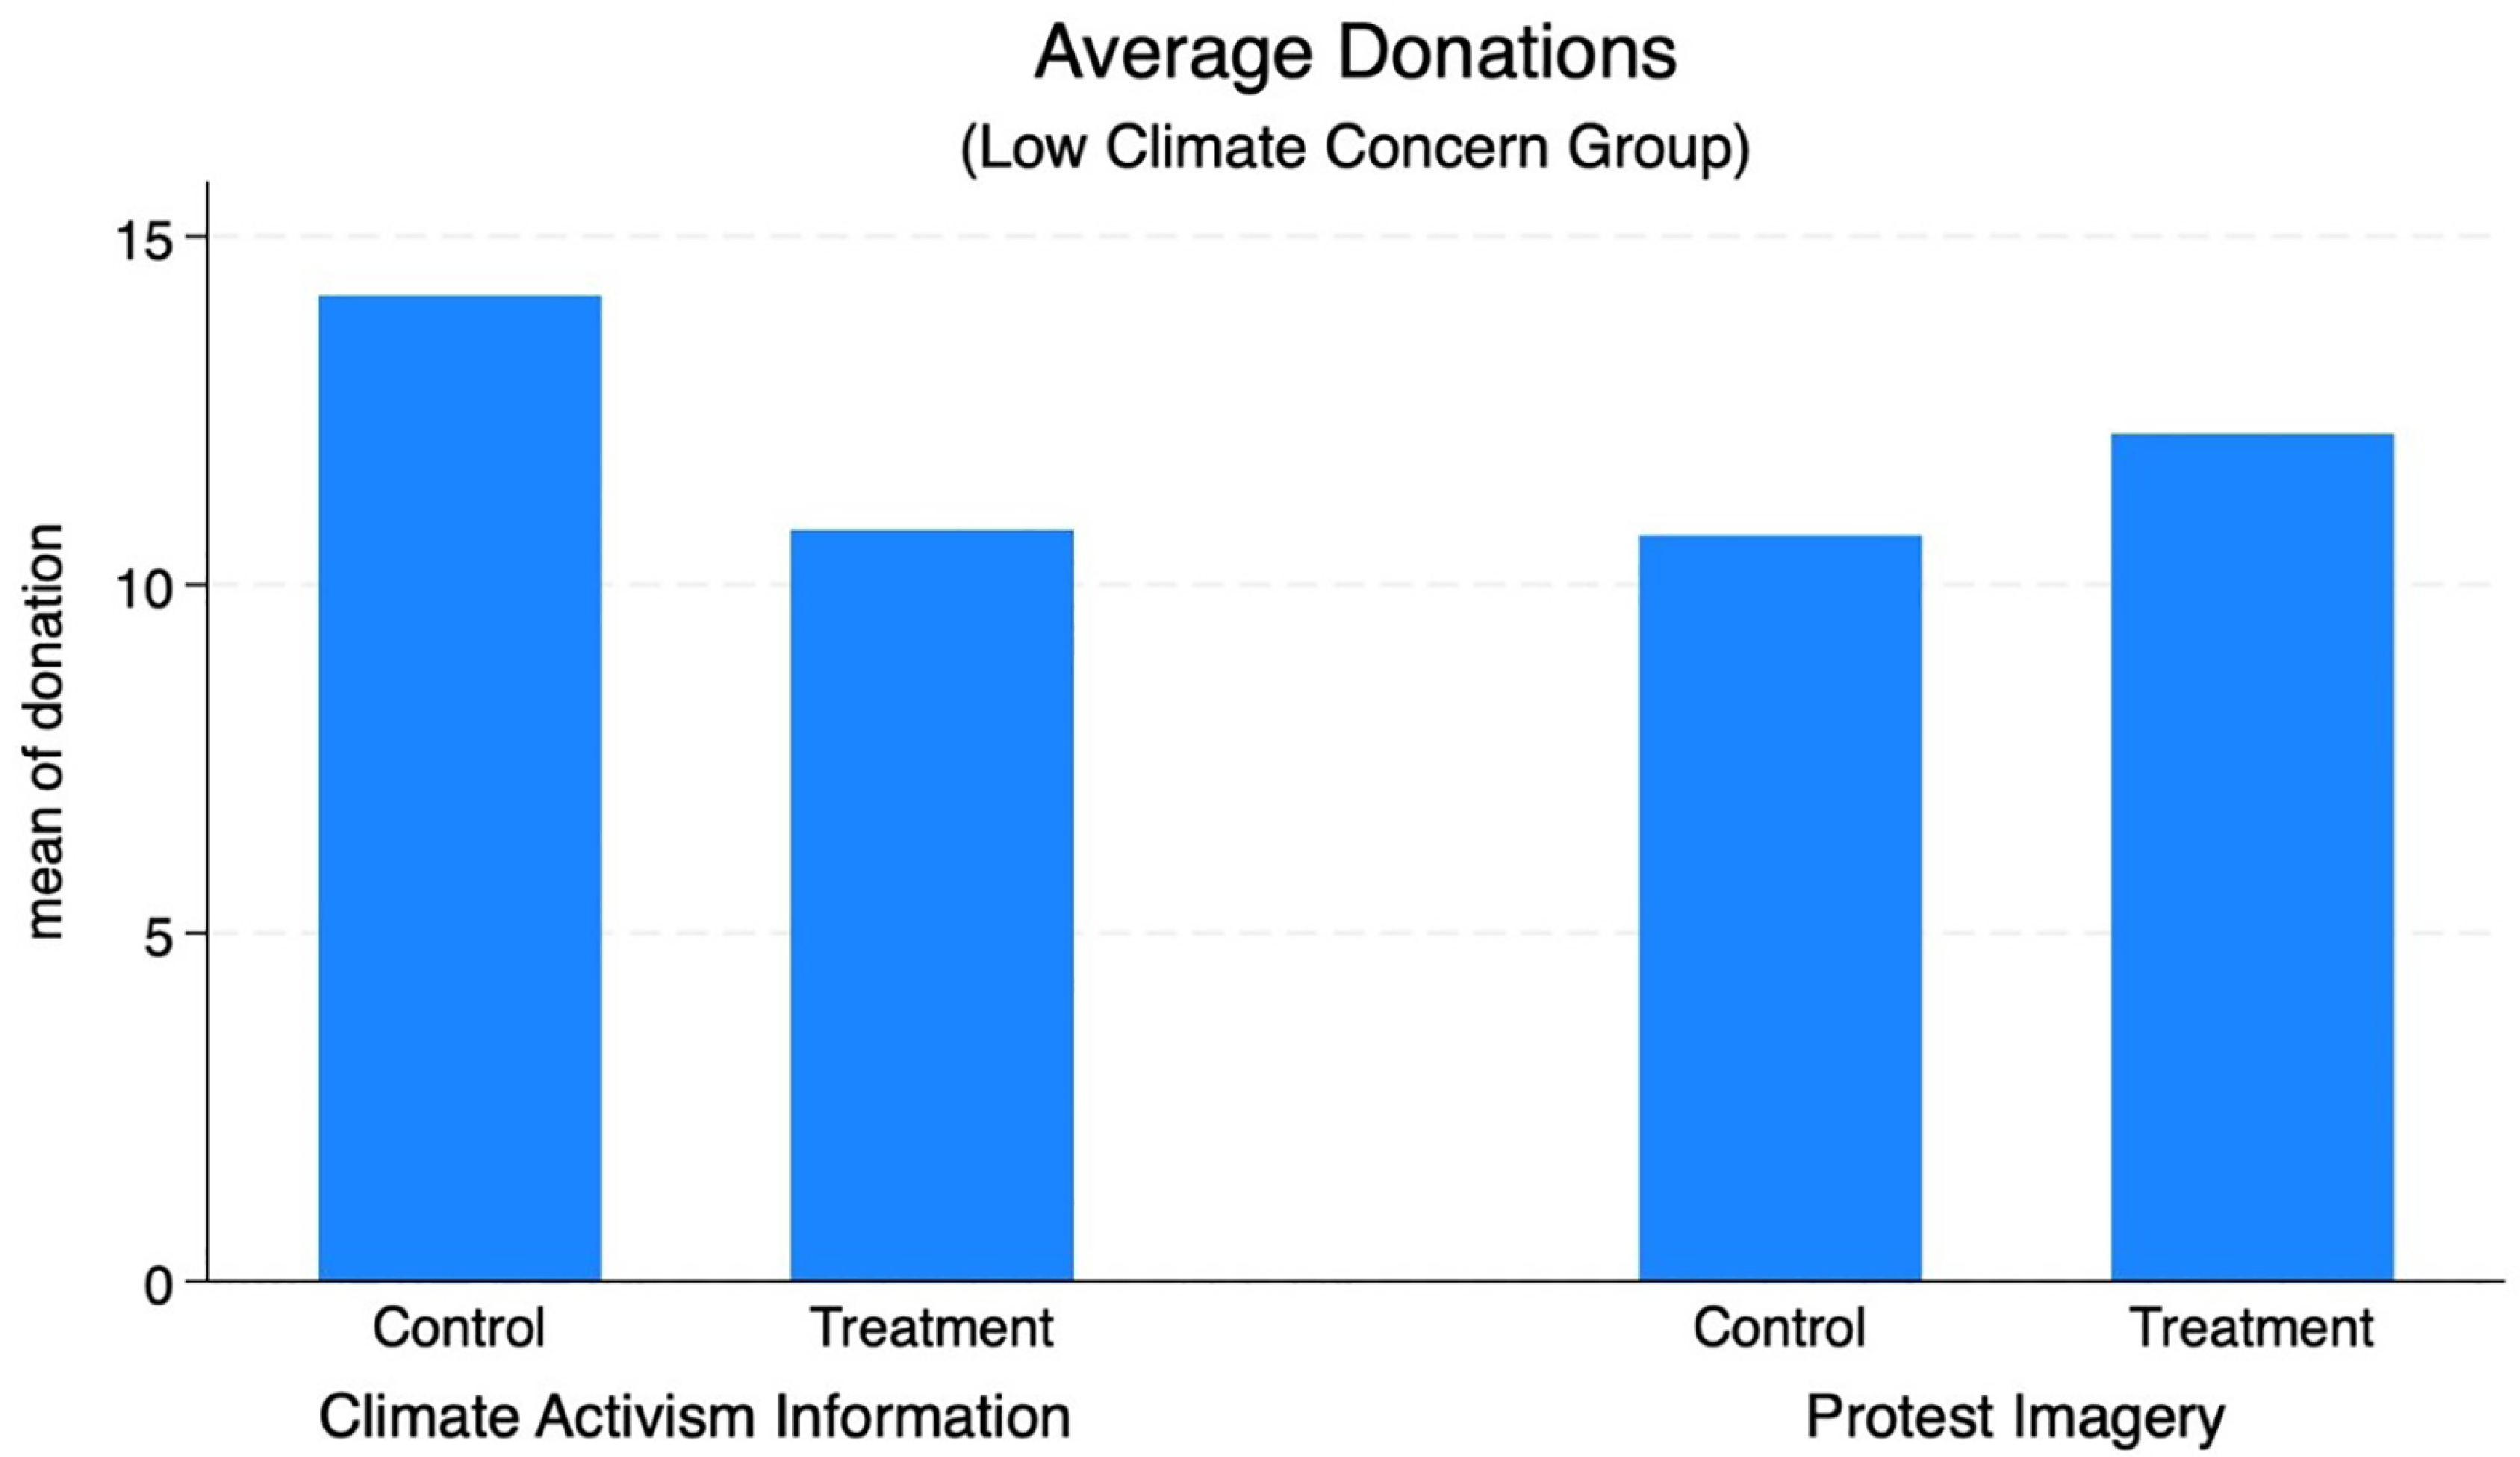
Average donations differ across treatment arms (Figure 3). Participants who received the activism-information treatment donated $13.38 on average, compared with $15.17 among those who did not receive activism information. Differences by protest imagery alone are smaller ($14.15 with protest imagery versus $14.42 with neutral imagery). Figures 4 and 5 suggest heterogeneity by pre-treatment climate concern: among lower-concern participants, pairing activism information with protest imagery appears to increase donations relative to activism information alone, while among higher-concern participants the same imagery appears to decrease donations. These patterns motivate our interaction specification in the regressions.
Average donations.
Note: The figure presents average donation amounts, in dollars, given by participants to climate activism, based on their random assignment to treatment or control for climate activism and for protest imagery.
Average donations for high climate concern.
Note: The figure presents average donation amounts, in dollars, for the group identified as having high climate concern, based on their random assignment to treatment or control for climate activism and for protest imagery.
Average donations for low climate concern.
Note: The figure presents average donation amounts, in dollars, for the group identified as having low climate concern, based on their random assignment to treatment or control for climate activism and for protest imagery.
Tobit: donation
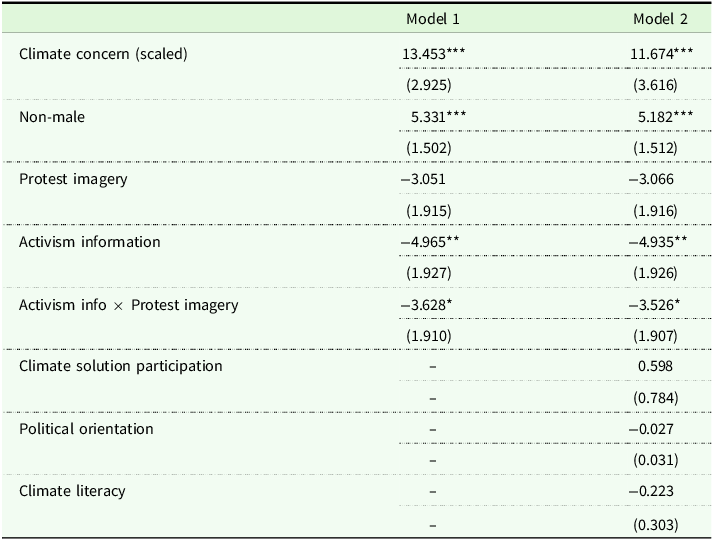
In Table 2, we present the results of the Tobit model for donation amount. As donations are censored at 0 and 30, we use a Tobit specification to account for the lower and upper bounds. The activism-information treatment is negative and statistically significant, indicating lower donations relative to the neutral-information control. Across Models 1 and 2, the coefficient corresponds to a reduction on the order of five dollars under the Tobit scale (Table 2). Protest imagery alone is not statistically significant. The interaction term (Activism information × Protest imagery) is positive relative to the activism-information main effect, suggesting that pairing activism information with protest imagery attenuates the negative association. We interpret these patterns cautiously and in conjunction with the descriptive figures.
Tobit
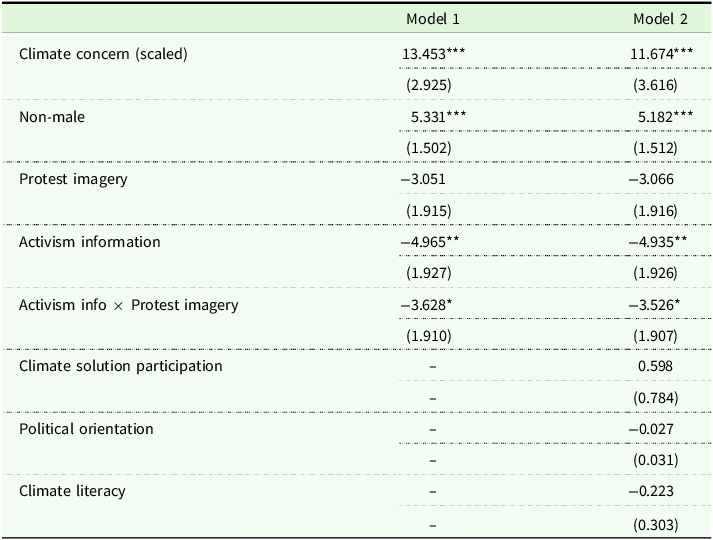
Table 2 Long description
A table comparing two models of climate concern and activism effects on donation amounts. The table has 10 rows and 4 columns. The columns are labeled Model 1, Model 2, and two additional columns for standard errors. The rows are labeled with different variables: Climate concern (scaled), Non-male, Protest imagery, Activism information, Activism info x Protest imagery, Climate solution participation, Political orientation, and Climate literacy. Each row contains values for both models and their corresponding standard errors. Notable trends include significant positive values for Climate concern and Non-male in both models, significant negative values for Activism information, and a positive interaction term for Activism info x Protest imagery in both models. Climate solution participation, Political orientation, and Climate literacy are only present in Model 2 with varying significance.
Note: N = 367. ***designates statistical significance at 0.01, **designates statistical significance at 0.05, and *designates statistical significance at 0.10.
Climate concern and identifying as non-male are positively and statistically significantly associated with higher donations. These patterns are consistent with prior findings that donation behavior differs by gender (Mesch et al. Reference Mesch, Brown, Moore and Hayat2011; Piper and Schnepf Reference Piper and Schnepf2008) and that people who report greater concern about climate change are more likely to support environmental causes (Shrum Reference Shrum2021; Zaval et al. Reference Zaval, Markowitz and Weber2015). In Model 2 of Table 2, participation in climate solutions is positive but not statistically significant, and political orientation and climate literacy are negative but not statistically significant. While other work finds that information and social norms can affect PEB in some settings (Buckley Reference Buckley2020), we do not find a robust association between our solution-participation measure and donations in this sample.
Ordered logit: donation
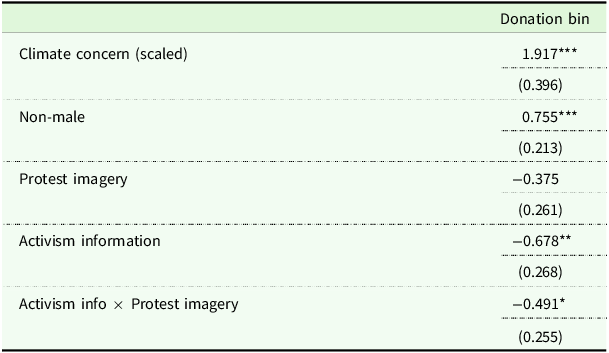
Finally, we consider our findings from the ordered logit model, presented in Table 3. We use an ordered logit to examine how covariates and treatments shift the probability of donating within different ranges rather than only shifting the conditional mean. Donations are grouped into seven ordered bins (defined in the Empirical Analysis section).
Ordered logit regression
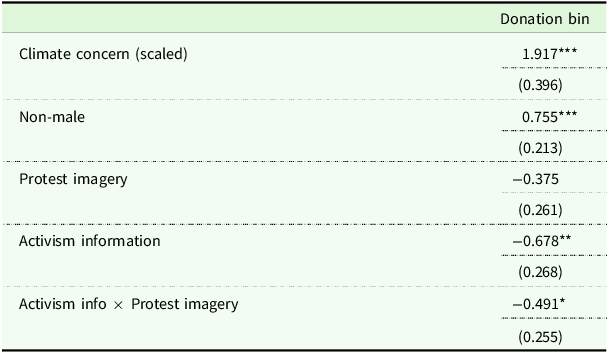
Table 3 Long description
A table showing the results of an ordered logit regression analysis. The table has five rows and three columns. The columns are labeled 'Climate concern (scaled)', 'Non-male', 'Protest imagery', 'Activism information', and 'Activism info x Protest imagery'. The first column lists the variables, the second column shows the coefficients, and the third column shows the standard errors in parentheses. Row 1: Climate concern (scaled), 1.917, 0.396. Row 2: Non-male, 0.755, 0.213. Row 3: Protest imagery, -0.375, 0.261. Row 4: Activism information, -0.678, 0.268. Row 5: Activism info x Protest imagery, -0.491, 0.255. The table presents the impact of different variables on the probability of donating within different ranges.
Note: N = 367. ***designates statistical significance at 0.01, **designates statistical significance at 0.05, and *designates statistical significance at 0.10.
In the ordered logit specification, the direction and statistical significance of climate concern, the non-male indicator, activism information, and the interaction term mirror the Tobit results. To interpret the ordered logit in probability terms, we compute marginal effects for each donation bin (Table 4). Higher climate concern is associated with lower probability of donating zero and higher probability of donating in the highest bins. Activism information, in contrast, increases the probability of donating in the lower and mid-range bins and decreases the probability of donating in the highest bins. Across variables, marginal effects are comparatively small and often insignificant for Bin 4 ($11–15), which may reflect anchoring at the slider’s default value of $15.
Marginal effects by donation bin (Ordered logit)

Table 4 Long description
The table presents marginal effects by donation bin using ordered logit specification. It has 7 columns and 6 rows. The columns are labeled as Bin 1 ($0), Bin 2 ($15), Bin 3 ($610), Bin 4 ($1115), Bin 5 ($1620), Bin 6 ($2125), and Bin 7 ($2630). The rows are labeled as Climate concern, Non-male, Protest imagery, Activism information, and Activism info x Protest imagery. Each cell contains a value and a standard error in parentheses. Row 1: Climate concern, Bin 1 ($0): -0.204*** (0.045), Bin 2 ($15): -0.134*** (0.030), Bin 3 ($610): -0.093*** (0.025), Bin 4 ($1115): 0.026* (0.015), Bin 5 ($1620): 0.084*** (0.021), Bin 6 ($2125): 0.062*** (0.018), Bin 7 ($2630): 0.259*** (0.057). Row 2: Non-male, Bin 1 ($0): -0.088*** (0.029), Bin 2 ($15): -0.057*** (0.017), Bin 3 ($610): -0.033*** (0.009), Bin 4 ($1115): 0.021** (0.011), Bin 5 ($1620): 0.038*** (0.013), Bin 6 ($2125): 0.025*** (0.009), Bin 7 ($2630): 0.092*** (0.024). Row 3: Protest imagery, Bin 1 ($0): 0.043 (0.032), Bin 2 ($15): 0.026 (0.018), Bin 3 ($610): 0.016* (0.009), Bin 4 ($1115): -0.007 (0.007), Bin 5 ($1620): -0.017 (0.012), Bin 6 ($2125): -0.012 (0.008), Bin 7 ($2630): -0.048 (0.032). Row 4: Activism information, Bin 1 ($0): 0.080** (0.036), Bin 2 ($15): 0.047** (0.019), Bin 3 ($610): 0.026*** (0.009), Bin 4 ($1115): -0.017 (0.011), Bin 5 ($1620): -0.032** (0.014), Bin 6 ($2125): -0.022** (0.009), Bin 7 ($2630): -0.083*** (0.030). Row 5: Activism info x Protest imagery, Bin 1 ($0): 0.057* (0.032), Bin 2 ($15): 0.034* (0.018), Bin 3 ($610): 0.020** (0.009), Bin 4 ($1115): -0.011 (0.008), Bin 5 ($1620): -0.023* (0.012), Bin 6 ($2125): -0.016* (0.008), Bin 7 ($2630): -0.062** (0.030).
Note: N = 367. ***p < 0.01, **p < 0.05, *p < 0.10. Cells report marginal effects from the ordered logit model with standard errors in parentheses.
Tobit: attitudes
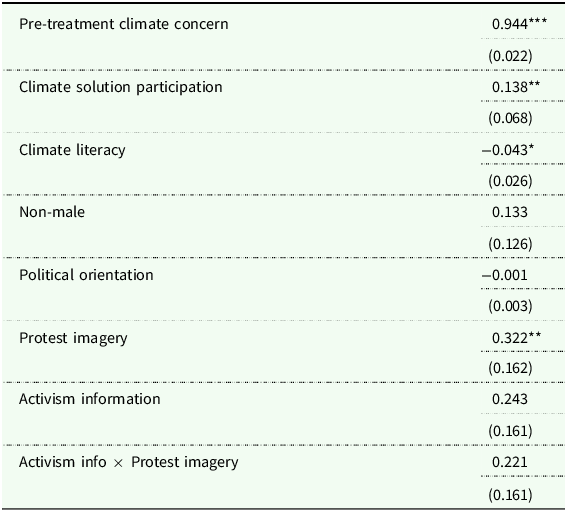
We estimate a Tobit model for post-treatment climate concern (Table 5) as the concern score is bounded between 5 and 21. Pre-treatment climate concern is the strongest predictor of post-treatment concern, with each additional point of pre-treatment concern associated with an increase of about 0.94 points post-treatment. Pro-environmental behavior is positively associated with post-treatment concern, while climate literacy is negatively associated, though the magnitude is small. Regarding treatments, protest imagery has a positive and statistically significant association with post-treatment climate concern. The interaction term (Activism information × Protest imagery) is negative, suggesting that the increase in concern associated with protest imagery is smaller when paired with activism information. This pattern is consistent with prior work showing that protest-related information can shift climate attitudes, though effects may depend on framing and audience (Kountouris and Williams Reference Kountouris and Williams2023).
Tobit model for climate attitudes
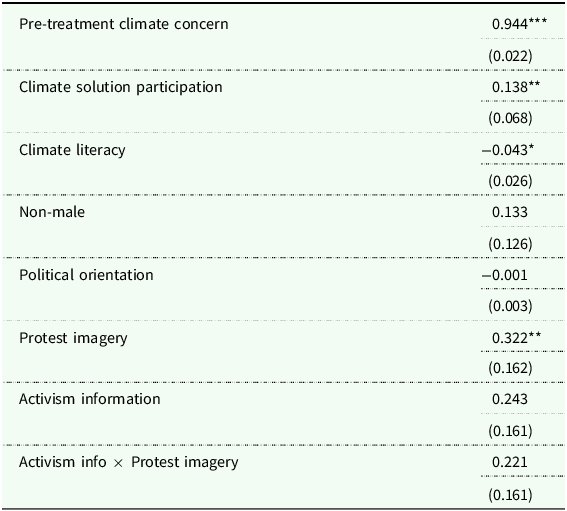
Table 5 Long description
A table with eight rows and three columns. The columns are labeled with the predictors and their associated coefficients and standard errors. The rows are labeled with the following predictors: Pre-treatment climate concern, Climate solution participation, Climate literacy, Non-male, Political orientation, Protest imagery, Activism information, and Activism info × Protest imagery. The values in the table are as follows: Row 1: Pre-treatment climate concern, 0.944, 0.022. Row 2: Climate solution participation, 0.138, 0.068. Row 3: Climate literacy, -0.043, 0.026. Row 4: Non-male, 0.133, 0.126. Row 5: Political orientation, -0.001, 0.003. Row 6: Protest imagery, 0.322, 0.162. Row 7: Activism information, 0.243, 0.161. Row 8: Activism info × Protest imagery, 0.221, 0.161.
Note: N = 367. ***designates statistical significance at 0.01, **designates statistical significance at 0.05, and *designates statistical significance at 0.10.
Robustness checks and limitations
The results of our regressions are robust across alternative specifications. We replicated our main models using Cragg-Hurdle and Poisson regression models. We also checked for heterogeneous treatment effects by pre-treatment climate concern, climate literacy, PEB, gender, and political orientation and did not find meaningful differences in the main patterns. These results can be replicated using our replication package.
Despite these consistent findings, our study has several limitations. First, although we attempted to keep the infographic text neutral, participants’ prior beliefs about climate change, climate activism, and protest may shape how they interpret the information and images, potentially introducing demand characteristics. Second, donations to any nonprofit can be influenced by factors we do not fully observe or control for, such as trust in charities, prior familiarity with the organization, and broader attitudes toward nonprofits and activism (Shreedhar and Mourato Reference Shreedhar and Mourato2019). Third, the climate literacy test was administered before treatment and could increase the salience of climate issues (i.e., prime climate-related considerations) for all participants; while this does not threaten internal validity across randomized treatment arms, it may influence overall levels of expressed concern and donation amounts and thus should be kept in mind when interpreting magnitudes.
Additionally, our sample consists of undergraduate students at a single R1 university in the western United States, and results may not generalize to the broader population (Henrich et al. Reference Henrich, Heine and Norenzayan2010). The direction of extrapolation is ambiguous: students face different budget constraints and may differ in environmental attitudes relative to older populations. In addition, because recruitment materials described the study as being about climate solutions and attitudes, the participant pool may over-represent individuals already interested in climate issues; if so, observed donation levels could be higher than in a more representative sample. Future work could replicate the experiment with a more diverse sample and explore alternative recruitment framings to quantify potential selection effects.
Discussion and conclusion
In this paper, we examined the effect of short informational treatments and images on charitable donation preferences towards climate activism and attitudes towards climate change. In doing so, we delved into a new area of valuing climate change solutions, looking to sociopolitical solutions. Moreover, we attempted to determine how altering an individual’s climate concern might affect their charitable donation preferences towards climate. Our results demonstrate that people highly value climate activism as a climate change solution; that information on activist groups causes people to donate less; and people become more concerned about climate change when witnessing images of protest.
First, the donation levels we observe are toward the upper range reported in experimental studies of charitable giving, including studies involving environmental causes (Cartwright and Thompson Reference Cartwright and Thompson2023; Shreedhar and Mourato Reference Shreedhar and Mourato2019; Shrum Reference Shrum2021). Within our student sample, this suggests substantial willingness to financially support climate advocacy. At the same time, because donations can be motivated by both private benefits (e.g., warm glow) and expected public-good benefits, we interpret the donation amounts as a measure of WTD to the cause rather than as direct evidence about baseline altruism (Andreoni Reference Andreoni1990).
We also find that participants donate less when exposed to additional information about the activism organization. Several mechanisms could generate this pattern. Information may change perceptions of the organization’s scale, professionalism, or need. In our setting, one plausible interpretation is a diffusion-of-responsibility or free-riding mechanism: if information leads participants to believe that the organization (and others) already have the problem handled, perceived marginal impact of an individual donation may fall (Hager et al. Reference Hager, Hensel, Hermle and Roth2019; Olson Reference Olson1965). Consistent with this interpretation, we do not observe a corresponding decrease in climate concern. The interaction results further suggest that pairing organizational information with protest imagery partially attenuates the negative association with donations, potentially because protest imagery conveys urgency or vulnerability in ways that counteract diffusion of responsibility.
We also observe clustering of donations at focal amounts (e.g., $0, $15, and $30) and at $5 increments. The ordered-logit marginal effects show relatively limited movement for Bin 4 ($11–15), which contains the slider default of $15, consistent with an anchoring effect. For practitioners, this suggests that default donation amounts and the granularity of suggested options can meaningfully shape observed giving.
Finally, consistent with prior research on charitable giving, women and non-male participants donate more on average than men (Mesch et al. Reference Mesch, Brown, Moore and Hayat2011; Piper and Schnepf Reference Piper and Schnepf2008). When it comes to donating to environmental causes specifically, prior work also reports higher likelihood of giving among women (Israel Reference Israel2007). In our sample, gender differences in donation amounts do not translate into statistically significant differences in post-treatment climate concern, suggesting that factors other than expressed concern may contribute to observed giving differences. One possibility raised in the philanthropy literature is that motivations for donating may differ by gender (IUPUI Women’s Philanthropy Institute 2015).
Overall, our results indicate substantial WTD to climate advocacy in our participant pool, while also showing that how organizations describe themselves and which images they pair with that information can shift donation behavior and climate concern. For climate advocacy organizations, the findings suggest a trade-off: emphasizing organizational capacity may unintentionally reduce perceived need, whereas imagery that conveys collective urgency may increase concern and offset some of this reduction in donations. Future work could test alternative messaging that explicitly highlights the marginal impact of an individual donor and could replicate the study in more representative samples. Organizations may also explore non-pecuniary incentives for donors (Andreoni and Petrie Reference Andreoni and Petrie2004; Karlan and McConnell Reference Karlan and McConnell2014; IUPUI Women’s Philanthropy Institute 2015), while remaining attentive to the possibility that external incentives can crowd out intrinsic motivations (Shreedhar and Mourato Reference Shreedhar and Mourato2019).
Data availability statement
Replication package is available on GitHub: https://github.com/aljosephson/climate-change_charitable-behavior. The data set used is not public due to student privacy concerns, but anonymized versions are available from the authors upon reasonable request.
Acknowledgments
The authors would also like to thank Haydon Eckstrom, Leah Callovini, Michelle Perfect, and Brandy Perkl for their support.
Funding statement
This work was funded by the Institute of Educational Sciences, the University of Arizona Honors College, and the University of Arizona Graduate and Professional Student Council.
Competing interests
Dr. Josephson has no conflicts of interest to declare. Ms. Gonsalves Wetherell has a friendly association with CCL and has previously attended the meetings. They had no influence over the research, research design, or this manuscript, though ultimately received $948 from this experiment.
Appendix A. Treatment Images
Images are grouped by treatment condition.
A.1 Images shown to all participants
Common climate-comprehension title image.
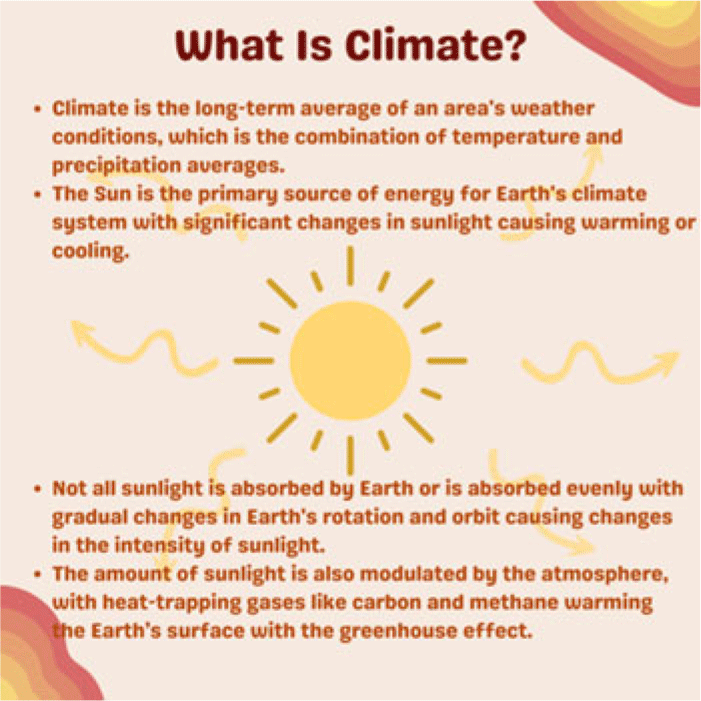
Common climate definition image.
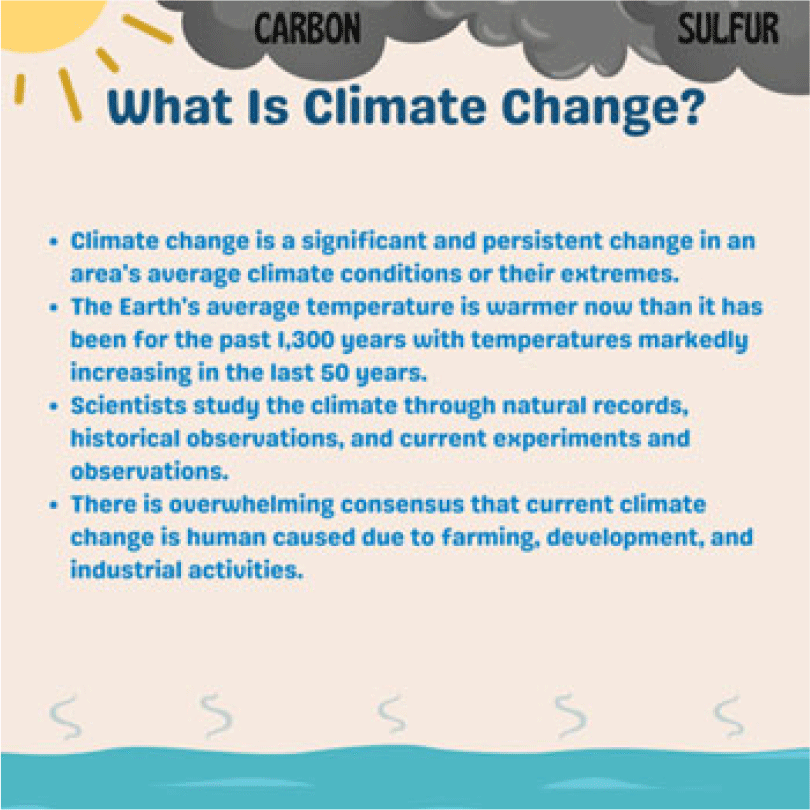
Common climate-change definition image.
A.2 Treatment: no climate-activism information and no protest image
Treatment image: Common climate-change effects without protest imagery.
A.3 Treatment: no climate-activism information and protest image
Treatment image: Common climate-change effects with protest imagery.
A.4 Treatment: climate-activism information and no protest image
Treatment image: Common climate-change effects definition.
Treatment image: Citizens’ Climate Lobby solutions information without protest imagery.
A.5 Treatment: climate-activism information and protest image
Treatment image: Common climate-change effects definition.
Treatment image: Citizens’ Climate Lobby solutions information with protest imagery.
Appendix B. Survey Instruments
Survey instruments used for this are included in B1 through B6.
B.1 Climate Literacy Survey
B.2 Climate Attitudes Survey
B.3 Dictator Game
Dictator-game decision screen.
B.4 Pro-Environmental Behavior (PEB) Survey
B.5 Pro-Social Behavior (PSB) Survey
B.6 Individual Attributes Survey


 Open access

