Buttermilk (BM) is a by-product of the dairy industry, it is the aqueous phase obtained by beating cream to produce butter (Barukčić et al., Reference Barukčić, Jakopović and Božanić2019). It is rich in residues from the membrane of milk fat globules, composed of a complex mixture of proteins, polar and non-polar lipids, which have technological (natural emulsifier; improves creaminess, viscosity, and sensory attributes) and functional properties (Garczewska-Murzyn et al., Reference Garczewska-Murzyn, Smoczyński, Kotowska and Kiełczewska2021). Besides that, milk fat globule membrane (MFGM) has biological potential as improving calcium absorption, immunoregulation, brain and cognitive development, cholesterol homeostasis and modulation of the gut microbiota (Ma et al., Reference Ma, Gong, Liu and Mao2024; Nie et al., Reference Nie, Zhao, Wang, Li, Fang, Wang, Wang and Liu2024; Wilmot et al., Reference Wilmot, Miller, Patil, Kelly and Jimenez-Flores2024). Despite its nutritional characteristics, BM remains underutilized in the dairy industry due to its classification as a low-value by-product, logistical challenges associated with its high perishability, and limited recognition of its functional potential. The absence of standardized processing methods and weak market demand further constrain its valorization.
For these reasons, BM poses a significant environmental threat due to its high content of organic compounds (Trajkovska et al., Reference Trajkovska, Nakov, Prabhat and Badgujar2024). By reducing the disposal of by-products from the manufacture and using them in food formulations, it is possible to act following the Sustainable Development Goals, such as improving nutrition (Goal 2 – Zero Hunger) and reducing food losses throughout the production chain (Goal 12 – Responsible Consumption and Production) (Crowther et al., Reference Crowther, Rappuoli, Corinaldesi, Danovaro, Donohue, Huisman, Stein, Timmis, Timmis, Anderson and Bakken2024; Hassoun et al., Reference Hassoun, Prieto, Carpena, Bouzembrak, Marvin, Pallarés, Barba, Bangar, Chaudhary, Ibrahim and Bono2022; Picart-Palmade et al., Reference Picart-Palmade, Cunault, Chevalier-Lucia, Belleville and Marchesseau2019). In this context, the fermentation of BM can enhance its sensory attributes – such as flavour and texture – as well as its nutritional profile (Li et al., Reference Li, Cheng, Li, Zhao, Qin, Chen, Wang and Wang2020), while also serving as a source of prebiotics, probiotics, and postbiotics (Cuamatzin-García et al., Reference Cuamatzin-García, Rodríguez-Rugarcía, El-Kassis, Galicia, Meza-Jiménez, Baños-Lara, Zaragoza-Maldonado and Pérez-Armendáriz2022).
Lactic acid bacteria (LAB) are well-recognized candidates for the fermentation of BM, and the use of strains with probiotic potential can enhance the functional attributes associated with BM consumption, enabling the development of new health-oriented beverages (Mathur et al., Reference Mathur, Beresford and Cotter2020). The effect of probiotics on modulating the microbiota stands out, contributing to improving immunity, digestion and lipid profile and increasing resistance to infections (Sun et al., Reference Sun, Yin, He, Cao and Jiang2023). Its metabolites such as short-chain fatty acids, bacteriocins and lactic acid act to control the growth of pathogenic bacteria (Yadav et al., Reference Yadav, Kumari, Singh, Sharma and Tiwari2022). Probiotics beverages have increased market value, not only by improving the aroma and flavour profile but also by offering various health benefits and extending shelf life (Mojikon et al., Reference Mojikon, Kasimin, Molujin, Gansau and Jawan2022; Terhaag et al., Reference Terhaag, Sakai, Ruiz, Garcia, Bertusso and Prudêncio2025). Unfortunately, utilizing bacterial strains can be challenging, as probiotic viability and count can be affected by nutritional, processing and microbiological factors (Arab et al., Reference Arab, Yousefi, Khanniri, Azari, Ghasemzadeh-Mohammadi and Mollakhalili-Meybodi2022; Farahmand et al., Reference Farahmand, Ouoba, Raeisi, Sutherland, Ghoddusi, Dulf and Cristian Vodnar2021). Furthermore, the dosage must be sufficient to ensure beneficial health effects, and the effects must be evaluated considering the body’s digestion and absorption process (Hill et al., Reference Hill, Guarner, Reid, Gibson, Merenstein, Pot, Morelli, Canani, Flint, Salminen and Calder2014).
One of the genera highlighted from the perspective of probiotics is Lactobacillus (Álvarez-Arraño and Martín-Peláez, Reference Álvarez-Arraño and Martín-Peláez2021). Lactobacillus gasseri (L. gasseri) is one of the popular LAB used as probiotic (Meybodi et al., Reference Meybodi, Mortazavian, Arab and Nematollahi2020) and different strains have been studied in the treatment of overweight and obesity, including SBT2055 (LG2055) (Kawano et al., Reference Kawano, Miyoshi, Ogawa, Sakai and Kadooka2016), BNR17 (Kim et al., Reference Kim, Yun, Kim, Kwon and Cho2018) and LG-G12 (Dias et al., Reference Dias, Duarte, Mota, Alpino, Louzano, Conceição, Mantovanie, Pereira, Oliveira, de Oliveira Mendes and Porcellato2023). Lactobacillus gasseri LG08 showed a potential effect on the regulation of the microbiota and the antioxidant system (Liang et al., Reference Liang, Meng, Zhang, Jianguo, Fang, Hu, Tang and Li2023).
In addition to probiotics, the incorporation of substances with antioxidant properties into BM can further enhance the functionality of beverages, while also contributing to more appealing colour and flavour characteristics for the final consumer. Curcumin, a phenolic compound originating from the rhizome of Curcuma longa (Jabczyk et al., Reference Jabczyk, Nowak, Hudzik and Zubelewicz-Szkodzińska2021; Neyrinck et al., Reference Neyrinck, Alligier, Memvanga, Névraumont, Larondelle, Préat, Cani and Delzenne2013), has been studied for its antioxidant and anti-inflammatory properties (Hewlings and Kalman, Reference Hewlings and Kalman2017), protective effects on cardiovascular diseases (Yang et al., Reference Yang, Zhu, Chen, Ji, Li, Wu, Pan and Li2024); aging process (Nunes et al., Reference Nunes, Mendes, Lima, Chehadi, Lamas, Haber and Bueno2024); promising anticancer agent (Cacciola et al., Reference Cacciola, Cuciniello, Petillo, Piccioni, Filosa and Crispi2023) and anti-obesogenic effect (Moetlediwa et al., Reference Moetlediwa, Ramashia, Pheiffer, Titinchi, Mazibuko-Mbeje and Jack2023). Furthermore, the polyphenols from Curcuma longa can act as prebiotics, modulating microbiota with antimicrobial action, interfering with membrane permeability and quorum sensing (Singh et al., Reference Singh, Cabral, Kumar, Ganguly, Rana, Gupta, Lauro, Carbone, Reis and Pandey2019). These combined properties make Curcuma longa an excellent candidate for inclusion in a fermented BM-based beverage with functional health claims.
This study aimed to create a functional dairy beverage with high antioxidant potential, combining possible probiotic and bioactive compounds, through the fermentation of BM, a nutritionally rich medium and the incorporation of curcumin, and to examine its proximal composition, technological, microbiological and antioxidant characteristics, as well as to evaluate its toxicity.
Materials and methods
Materials and beverages production
The BM was donated by Laticínios Escola of Fundação Arthur Bernardes. The probiotic L. gasseri LG08 was purchased in lyophilized form (210 billion CFU/g) from LEMMA Supply (Jardinópolis, São Paulo, Brazil). Curcumin was purchased from Exodus Científica (São Paulo, Brazil).
Four different types of formulations were prepared: (1) pasteurized buttermilk (BM); (2) pasteurized buttermilk + curcumin (CUR); (3) pasteurized fermented buttermilk (FBM) and (4) pasteurized fermented buttermilk + curcumin (FCUR). For preparation, the BM was pasteurized (heated to 65 ºC for 30 minutes) and frozen until the moment of use. Then, it was heated to 90 ºC for 2 minutes and cooled to 44 ºC. L. gasseri LG08 was added in a proportion of 1 mg of probiotic (2.1 × 10⁸ CFU/mg): 1 ml of BM and kept at 44 ºC for 24 hours (Lima et al., Reference Lima, Monteiro and Pasquali2022). After this period, it was kept refrigerated for 12 hours. Curcumin was then added to BM (CUR) and to the fermented buttermilk (FCUR) considering a dosage of 15 mg/ml.
All beverages were analysed in biological triplicates to evaluate the proximate composition, titratable acidity, water-holding capacity (WHC), total phenolics, antioxidant, microbiological and in vitro cytotoxicity (Fig. 1). The colorimetric analysis was performed in technical triplicate.
Experimental workflow for beverages preparation and evaluation of physicochemical, microbiological, antioxidant and cytotoxic activities.

Buttermilk beverage composition
Before producing the BM-based formulations, the proximal composition of the BM utilized was analysed. The composition of the BM was determined through the quantification of moisture, ash, lipids and proteins, following the precepts of the renowned Association of Official Chemical Analytical Methods (AOAC, 2012). The total carbohydrate content was calculated by deducting from 100 the aggregate sum of moisture, ash, lipids and proteins, thus revealing their proportion using the different methods. All carbohydrates present in BM were considered as available carbohydrates, as BM is not a source of dietary fibre. The total energy value was calculated by considering 4 kcal/g for carbohydrates and protein, and 9 kcal/g for lipids.
Physicochemical characteristics during storage period
To assess the shelf life of the beverages, they were subjected to physical, chemical and microbiological analyses at 0 to 28 days of storage. Throughout the 28-day storage period, the beverages were kept in refrigeration and a sample of each was collected weekly to perform the analysis of pH, titratable acidity, soluble solids, measured in degrees Brix and WHC.
pH
The pH value was determined directly in the samples using a PG 1000 digital pH meter (GEHAKA), calibrated with pH 4.0 and 7.0 buffer solutions.
Titratable acidity
Titration of the beverages was performed using a 0.1 mol/l NaOH solution and phenolphthalein as the indicator. Titratable acidity was calculated according to the equation (% lactic acid = V × N × F), where V is the volume of NaOH solution used in the titration (ml), N is the molarity of the NaOH solution (0.1 mol/L) and F is the correction factor accounting for the dilution step (5 ml of sample diluted in 25 ml of water). The results were expressed as percent lactic acid (g/100 ml) (AOAC, 1985).
Total soluble solids
Total soluble solids were evaluated by direct reading at room temperature, on an Abbé bench refractometer with a scale graduated in degrees Brix, previously calibrated with distilled water in accordance with the guidelines previous described (Instituto Adolfo Lutz, 2008).
Water-holding capacity
The WHC was estimated as previous described with modifications (Grasso et al., Reference Grasso, Alonso-Miravalles and O'Mahony2020). Approximately 2 g of each beverage were centrifuged at 640 × g for 20 minutes at 4 °C and then the supernatant aqueous phase was collected and weighed. WHC was calculated using the equation:
 \begin{equation*}WHC{\text{ }}\left( \% \right) = \left( {1 - \frac{{supernatant{\text{ }}mass{\text{ }}\left( g \right)}}{{sample{\text{ }}mass{\text{ }}\left( g \right)}}} \right){\text{ }}x{\text{ }}100\end{equation*}
Colorimetric analysis
The objective evaluation of the colour of the beverage samples was performed using a Colour Quest II colorimeter (Hunter Lab, Reston, VA), connected to a computer equipped with the Universal software system. The equipment was properly calibrated for included reflectance, using an observer angle of 10° and D65 illuminant, with the positioning of the light protection devices, calibrated white tile and calibrated grey tile on the reflectance port. The CIELa*b* colour system uses three coordinates: L*, which represents the lightness of a sample (ranging from 0 for black to 100 for white); a*, which indicates colour on the red–green axis (from –80 for green to +100 for red); and b*, which reflects colour on the yellow–blue axis (from –50 for blue to +70 for yellow). In simpler terms, L* shows how light or dark the sample is, while a* and b* describe its colour hue. The samples were transferred to an appropriate quartz cuvette with a capacity of 50 ml for readings to be taken. The hue angle (hº) and saturation (C*) values were calculated from the a* and b* values, according to equations:
 \begin{equation*}C* = {\text{ }}\sqrt {{a^{*2}} + {b^{*2}}} \end{equation*}
 \begin{equation*}{h^{\text{o}}} = Arc\;\tan \left( {\frac{{{b^*}}}{{{a^*}}}} \right)\end{equation*}
The total colour difference (∆E) equation was used to verify the colorimetric stability of beverages about the storage period under controlled light and temperature conditions.
 \begin{equation*}\Delta E = {\text{ }}\sqrt {{{\left( {\Delta L*} \right)}^2} + {{\left( {\Delta a*} \right)}^2} + {{\left( {\Delta b*} \right)}^2}} \end{equation*}
Microbiological analysis
The most probable number (MPN) analysis for the samples was performed according to the methodology of the Compendium of Methods for the Microbiological Examination of Foods of the American Public Health Association (APHA, 2015) with adaptations. Briefly, the samples were diluted in peptone water and serial dilutions were made, from which aliquots were inoculated in lauryl sulfate tryptose (LST) broth containing Duhan tubes. In sequence the tubes were incubated at 37 ± 1 °C for 24 hours. After this period, the result was expressed in MPN/ml of sample.
The LAB and total bacteria count were performed according to the methodology previous described with adaptations, using the same dilutions (Arya, Reference Arya2020). From these, aliquots were inoculated in selective Man Rogosa and Sharpe (MRS) and standard plate count (SPC) agar medium and then incubated at 37 ± 1 °C for 24 hours under anaerobic conditions using an anaerobic jar. After this period, the colony count was performed and the result expressed in colony forming units per millilitre of sample (CFU/ml−1).
Determination of total phenolics and antioxidant capacity
The extraction of total phenolic compounds was performed as previous described (Pereira et al., Reference Pereira, Ávila, Alpino, Cruz, Almeida, Simões, Bernardes, Xisto Campos, de Oliveira, de Oliveira Mendes and Gouveia Peluzio2023). Briefly, 1 ml of each beverage were mixed with 10 ml of aqueous methanolic solution (70:30%, v/v). The extraction was carried out at room temperature, in the dark, for 4 hours with shaking. The extracts were centrifuged at 1420 × g for 10 min and filtered, and the supernatants were used for analysis of total phenolics, DPPH (2,2-diphenyl-1-picryl-hydrazyl-hydrate) and ABTS (2,2’-azino-bis-3-ethylbenzothiazoline-6-sulfonic acid).
The analysis of total phenolics of the extracts was performed using the methodology of Singleton and Rossi (Reference Singleton and Rossi1965) with modifications (Cândido et al., Reference Cândido, Silva and Agostini-Costa2015). Briefly, 500 µl of a sodium carbonate solution (7.5%) was reacted with 100 µl of the samples, this was mixed for 3 minutes and then added 400 µl of the Folin–Ciocalteu reagent solution (1:10) was added and let reacted for 1 hour out of light. Then the absorbances were recorded at 760 nm using a microplate reader (Thermo Fisher Scientific, Multiskan GO, Finland). For this analysis, a standard curve of gallic acid was used and the results were expressed as mg gallic acid equivalents per ml of beverage (µM GAE ∙ ml−1 of beverage).
The analysis of antioxidant capacity by DPPH radical method was performed using the methodology of Kim et al. (Reference Kim, Lee, Lee and Lee2002) with modifications (Cândido et al., Reference Cândido, Silva and Agostini-Costa2015). Briefly, the DPPH radical was prepared in 80% ethanol at a concentration of 0.01 mM, dissolved using an ultrasound bath for 10 minutes. The solution was then adjusted to an absorbance of 0.700 ± 0.005 at 517 nm. 100 µl of the sample dilution was reacted with 700 µl of DPPH radical and incubated for 1 hour. The absorbances were recorded at 517 nm using a microplate reader (Thermo Fisher Scientific, Multiskan GO, Finland). Four sample dilutions in 80% ethanol were used to elaborate the sample curve and a Trolox standard curve was used, and the results were expressed as µM of Trolox equivalents per ml of aqueous extract (µM TE ∙ mL−1 of aqueous extract).
The analysis of antioxidant capacity by ABTS radical method was performed using the methodology of Re et al. (Reference Re, Pellegrini, Proteggente, Pannala, Yang and Rice-Evans1999) with modifications, adapted by Cândido et al. (Reference Cândido, Silva and Agostini-Costa2015). Briefly, the ABTS radical was generated by mixing 7 mM ABTS with 2.45 mM potassium persulfate and incubating the solution at 50 °C for 15 minutes. The ABTS radical was diluted in 80% ethanol to an absorbance of 0.700 ± 0.005 at 734 nm. 100 µl of sample dilution was reacted with 700 µl of ATBS radical and allowed to react for 6 minutes. Absorbance was measured at 734 nm using a microplate reader (Thermo Fisher Scientific, Multiskan GO, Finland). Four samples’ dilutions in 80% ethanol were used to generate the sample curve, and a Trolox standard curve was used to express results as µM of Trolox equivalents per ml of beverage (µM TE ∙ mL−1 of beverage).
In vitro cytotoxicity
The cell viability of RAW 264.7 macrophages was assessed using the 3-[4,5-dimethylthiazol-2-yl]-2,5-diphenyl tetrazolium bromide (MTT) assay, as previously described (Liu et al., Reference Liu, Su, Wang and Li2012). Briefly, RAW 264.7 macrophages were cultured in 96-well plates at a density of 2 × 10⁴ cells/well in 200 µl of RPMI medium supplemented with 10% foetal bovine serum and 0.1 g/l penicillin/streptomycin. Cells were incubated at 37 °C, with 5% CO₂ for 24 hours. Thereafter, the cells were treated with the different tested beverages and incubated for an additional 24 hours at the same conditions. The beverages BM, FBM, CUR and FCUR were diluted to a concentration of 250 µg/ml and 100 µg/ml in RPMI medium, with a maximum of 0.5%.
The control group (100% growth) consisted of cells cultured only in medium without any added compounds, with 0.5% dimethyl sulfoxide (DMSO). Subsequently, 50 µl of MTT solution (0.5 mg/ml) was added to each well, and the cells were incubated for 1 hour at 37 °C. The formazan crystals formed during incubation were dissolved in 100 µl of DMSO, and absorbance was measured at 570 nm. The results were expressed as a percentage of absorbance relative to the control group.
The protective effect of the beverages following H₂O₂ exposure was also evaluated using the MTT assay (3-[4,5-dimethylthiazol-2-yl]-2,5-diphenyltetrazolium bromide). RAW 264.7 macrophages were incubated at 37 °C with 5% CO₂ for 24 hours and treated with the different beverages for an additional 24 hours. After incubation, the cells were exposed to 1.25 mM hydrogen peroxide for 3 hours. This H2O2 concentration was determined from preliminary toxicity assays, in which a range of concentrations was tested to identify the level that produced a significant reduction in cell viability without inducing immediate cell lysis. This strategy enabled the selection of an appropriate dose to assess the protective effects of the beverage against oxidative stress. Subsequently, the test was performed as previously described (Liu et al., Reference Liu, Su, Wang and Li2012).
Statistical analysis
The normality of the variables was determined by the Shapiro-Wilk test. The beverages variables were expressed as mean ± standard deviation. For comparison among experimental formulations, the analysis of variance (ANOVA) means comparison test were used for parametric variables, followed by the Tukey post hoc test, and for non-parametric variables, Kruskal-Wallis followed by Dunn’s, using BM as the control. For comparison over storage time, ANOVA was performed. Statistical analyses were performed using GraphPad Prism version 9, assuming a p-value < 0.05.
Results and discussion
Determination of the proximal composition
The composition of the BM used in this study is 94.32% moisture, 0.46% fat, 1.41% protein, 4.81% carbohydrate, 0.46% ash, corresponding to 29.02 kcal/100 ml.
In Brazil, decree no. 9.013 of 2017 defines BM as a dairy product resulting from the churning of pasteurized cream during the butter manufacturing process, which may be presented in liquid, concentrated or powder form. Due to its nutritional quality, BM has been used as a dairy ingredient in the preparation of beverages and dairy compounds, being regulated in legislation in Brazil through Ordinance SDA/MAPA no. 1,174 (2024) and regulatory instruction no. 80 (2020). It can be used as an emulsifier and a stabilizer in food systems, while promoting positive health effects (Taşkoparan et al., Reference Taşkoparan, Altınay and Barbaros Özer2025). The amount of fat in our BM was very similar to what was described by Ogrodowczyk et al. (Reference Ogrodowczyk, Kalicki and Wróblewska2021), while the amount of protein was lower compared to other studies (Krebs et al., Reference Krebs, Pouliot, Doyen, Venema and Brisson2023; Ogrodowczyk et al., Reference Ogrodowczyk, Kalicki and Wróblewska2021).
Physicochemical analysis
Over the time evaluated, all beverages showed a decrease in pH value (Fig. 2A). At the initial time point, BM was 7.79, FBM was 5.48, CUR was 8.12 and FCUR was 5.35; at the final time point, BM was 6.75, FBM was 4.91, CUR was 6.61 and FCUR was 4.84 (Fig. 2A). Fermented beverages presented a higher amount of lactic acid when compared to non-fermented ones throughout the entire evaluation period and remained stable after the first week of evaluation. Non-fermented beverages increased their lactic acid content from the 21st day of evaluation. Beverages with added curcumin showed less variation in titratable acidity compared to those without curcumin (Fig. 2B).
Variation of pH (A), titratable acidity (B), total soluble solids (C) and water-holding capacity (D) of buttermilk-based beverages during 28 days of storage period at 8 °C. BM, buttermilk; FBM, fermented buttermilk; CUR, curcumin; FCUR, fermented curcumin. Data represented as mean and standard deviation of biological triplicates. Small letters refer to statistically significant differences (p < 0.05) between the beverages using ANOVA compared to BM at the same time. Capital letters refer to statistically significant differences (p < 0.05) using ANOVA, followed by the Tukey post hoc test between storage days.

Throughout the 28-day storage period, all beverages showed a pH decrease. As expected, the fermented beverages showed lower pH values and a higher titratable acidity, consistent with who reported a similar pH decrease in low-fat fermented beverages, attributed to the continued activity of LAB converting lactose into lactic acid during storage. Despite these changes, pH stabilized after 7 days of storage, which was predictable as the fermentation process is usually used to enhance the shelf life of dairy products (Li et al., Reference Li, Cheng, Li, Zhao, Qin, Chen, Wang and Wang2020). Regarding titratable acidity, for fermented beverages, consistent with the pH stability results, values at 7, 14, 21 and 28 days were also observed to be more similar, while the lactic acid content of the unfermented beverages increased on the 21st day. For FBM and FCUR, as the pH decreases, acidity increases proportionally and steadily, which is typical of fermented or acidified products. For BM and CUR, the same proportional trend is observed, although the increase in acidity is more subtle during the first weeks.
According to Regulatory Instruction no. 76, of 26 November 2018, the natural acidity of fresh milk ranges from 0.14% to 0.18% lactic acid. Values above 0.18% indicate microbial development, especially through the action of lactic bacteria that convert lactose into lactic acid. Buttermilk naturally contains LAB, which lead to its fermentation (Gebreselassie et al., Reference Gebreselassie, Abrahamsen, Beyene, Abay and Narvhus2016). In fermented milk beverages, once the live culture is added and the mixture of milk and bacteria is incubated, there is a significant increase in acidity due to the fermentation of lactose by bacteria such as Lactobacillus (Tomovska et al., Reference Tomovska, Gjorgievski and Makarijoski2016).
Fermentation is a process well known and one of the oldest methods used to preserve food in an economic way. Furthermore, it improves nutritional value since the fermentation process alters the sensory aspects of the food, and the microbial activity produces metabolites as vitamins and organic acids with effects on health (Jang et al., Reference Jang, Lee and Paik2024). The LAB rapidly produce organic compounds such as lactic acid, acetic acid, ethanol, enzymes and bacteriocins, responsible for the rapid acidification of the environment, reducing the risk of food spoilage by other microorganisms (Aguirre-Garcia et al., Reference Aguirre-Garcia, Nery-Flores, Campos-Muzquiz, Flores-Gallegos, Palomo-Ligas, Ascacio-Valdés, Sepúlveda-Torres and Rodríguez-Herrera2024). The pasteurization process reduced the content of these bacteria in BM, which explains the longer time required to reduce the pH and increase the lactic acid amount when compared to beverages that had L. gasseri added. In the case of L. gasseri, a homofermentative strain, the only acid produced is the lactic acid (de Lima et al., Reference Lima, de Almeida, Mera, Bernardes, Garcia and Muniz2021).
Regarding soluble solids, stability was observed throughout the evaluation period (Fig. 2C). A significant drop is observed in the first week of BM and FBM, followed by stability, while drinks added with curcumin show greater stability throughout the period evaluated. This can be explained by the use of lactose by bacteria and the subsequent formation of lactic acid, leading to an initial reduction in soluble solids and stabilization over time. This is an important assessment for analysing the nutritional quality of dairy products, as it mainly represents the solute concentration of lactose, mineral salts and vitamins. Beverages with added curcumin showed less variation in soluble solids compared to those without curcumin (Fig. 2C).
In the first week, the beverages with L. gasseri showed higher initial WHC. From day 7 onwards, FBM, CUR and FCUR showed higher WHC compared to BM. BM showed a decline over time, while the others did not change (Fig. 2D). At all-time evaluated points, the WHC of the beverages with L. gasseri was higher than the ones without it. The WHC reflects gel network stability and syneresis tendency (Xu et al., Reference Xu, Guo, Du and Zhang2019). A high WHC is desirable in fermented dairy products, as it contributes to the physical stability of the matrix, reduces syneresis and promotes better texture and appearance during storage (Arab et al., Reference Arab, Yousefi, Khanniri, Azari, Ghasemzadeh-Mohammadi and Mollakhalili-Meybodi2022).
Li et al. (Reference Li, Cheng, Li, Zhao, Qin, Chen, Wang and Wang2020) and Costa et al. (Reference Costa, Costa, Rocha, Campos, Oliveira, Santos, Sartori, Ferreira, Fante, de Alvarenga and de Souza2025) associated lower pH with higher WHC, which was also observed in our study. In the study of Zhao et al. (Reference Zhao, Feng and Mao2020), comparing different amounts of BM powder in the formulation of yogurts, it has shown that the addition improved WHC and viscosity. The constituents of BM, especially phospholipids and proteins, possess strong emulsifying and water-retention abilities. Phospholipids have a greater water retention capacity due to their amphiphilic nature, which is an interesting characteristic for the food industry, especially to understand the behaviour of using BM in the production of fermented beverages. Additionally, the higher hydration of BM and the interactions between residual proteins and milk fat globule membrane components can further enhance WHC (Garczewska-Murzyn et al., Reference Garczewska-Murzyn, Smoczyński, Kotowska and Kiełczewska2021; Romeih et al., Reference Romeih, Abdel-Hamid and Awad2014; Santos et al., Reference Santos, Leonel, Ramos, Hudson, Pinto, Rezende, Vidigal and dos Santos Pires2024).
The BM and FBM samples presented a higher luminosity value (L*), a greenish tendency (a*) and a slightly yellowish hue (b*) (Table 1), characteristic of milk. The samples with added curcumin (CUR and FCUR) presented lower luminosity, were more reddish and yellowish, and were closer to the extremes of the reference values of the colour diagram (Fig. 3).
Buttermilk-based beverages tested. BM, buttermilk; FBM, fermented buttermilk; CUR, buttermilk + curcumin; FCUR, fermented buttermilk + curcumin.

Colour parameters L*, a*, b*, C* and hº of buttermilk-based beverage samples over 28 days

BM, buttermilk; FBM, fermented buttermilk; CUR, curcumin; FCUR, fermented curcumin. Data represented as mean and standard deviation of three technical replicates. Small letters refer to statistically significant differences (p < 0.05) between the beverages using ANOVA compared to BM at the same time. Capital letters refer to statistically significant differences (p < 0.05) using ANOVA, followed by the Tukey post hoc test between storage days.
The colorimetric evaluation showed differences among all beverages, both when compared to BM and individually over time, although the visual differences between BM and FBM, as well as between CUR and FCUR, were nearly imperceptible (Fig. 3). The C* Index, which assesses colour saturation and intensity, decreased over time in beverages without curcumin and increased in CUR and FCUR, being stronger in the last week. A different result was found by Etxabide et al. (Reference Etxabide, Kilmartin and Maté2021), in which solutions containing curcumin decreased their intensity over time. In the same study, a more basic pH showed a change in colour, with a change from yellow to yellow-brown, while at low pH the colour remained, justified by the predominance of keto form of curcumin in an acidic medium.
Microbiological
None of the samples showed gas formation in the Durham tubes or turbidity in the LST broth. In the SPC, bacteria with the same macromorphology were observed in all samples on both PCA and MRS media; therefore, only the results from MRS will be discussed.
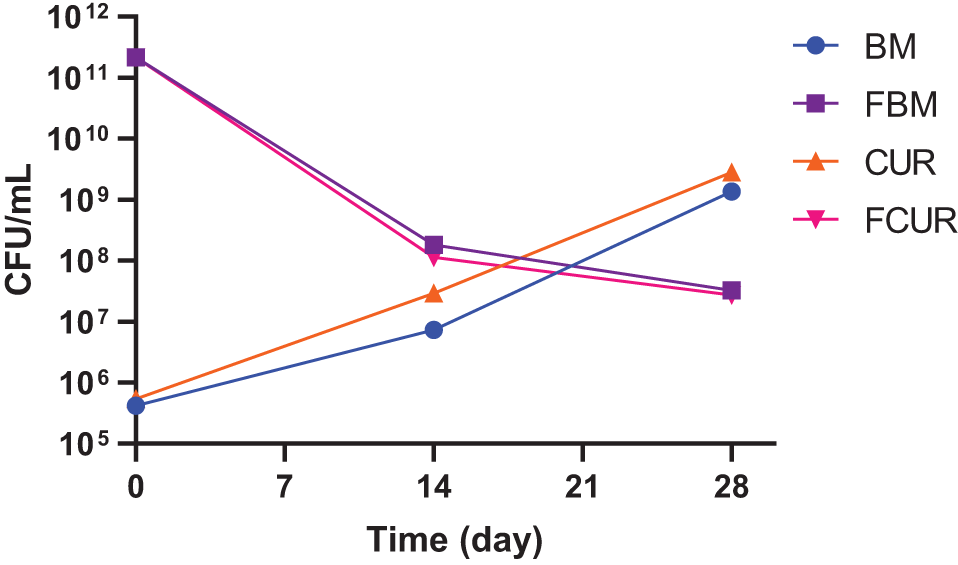
The initial concentration of LAB in the BM was 4.2 × 10⁵ CFU/ml. During the evaluation period, the microbiological content increased, reaching 1.35 × 10⁹ CFU/ml in the last week (Fig. 4). We considered the count provided on the strain packaging by the manufacturer as time zero in beverages containing L. gasseri. After 1 week, the count of LAB in FBM was 8.01 × 10⁸ CFU/ml and in FCUR 7.14 × 10⁸ CFU/ml. In the following week, 1.82 × 10⁸ CFU/ml and 1.13 × 10⁸ CFU/ml were obtained, respectively. At the end of the 28st days, there was a very significant reduction, where FBM presented 5.0 × 10⁷ UFC/ml and FCUR 6.5 × 10⁷ UFC/ml in the 21st day and 3.25 × 10⁷ UFC/ml and 2.72 × 10⁷ UFC/ml in the 28st day.
Microbiological CFU log of buttermilk-based beverages tested throughout storage. BM: buttermilk; FBM: fermented buttermilk; CUR: buttermilk + curcumin; FCUR: fermented buttermilk + curcumin.

The LST analysis, part of the MPN method, is a classic microbiological analysis used to detect total coliforms in food, water and other environmental samples. None of the samples presented gas or turbidity in the Duhan tubes, indicating the absence of coliforms and effectiveness pasteurization of the BM used in the preparation of the beverages. SPC medium was used to identify other microorganisms that could be present and was evaluated at the first two points in all beverages. Only LAB were detected, reinforcing the effect of pasteurization and the growth of L. gasseri LG08. This observation was confirmed by CFU counts in MRS agar. The beverage was produced according to the information provided on the label (2.1 × 10¹¹ CFU/g). Over time, microbial counts declined, as observed in other BM-based products (Ogrodowczyk et al., Reference Ogrodowczyk, Markiewicz, Szmatowicz, Koźniewski and Wróblewska2025). The general decrease in microbial counts over time can be attributed to factors such as nutrient depletion, pH changes, and the antimicrobial activity of compounds present in additives (Ogrodowczyk et al., Reference Ogrodowczyk, Markiewicz, Szmatowicz, Koźniewski and Wróblewska2025). Curcumin addition (FCUR) resulted in a decrease in LAB counts compared to fermented buttermilk without curcumin (FBM) on days 7 and 14, indicating a possible initial inhibitory effect, as some phenolic compounds, specifically curcumin, have natural antimicrobial properties that can selectively inhibit bacterial growth (Buniowska-Olejnik et al., Reference Buniowska-Olejnik, Mykhalevych, Urbański, Berthold-Pluta, Michałowska and Banach2024; Pacheco-Ordaz et al., Reference Pacheco-Ordaz, Wall-Medrano, Goñi, Ramos-Clamont-Montfort, Ayala-Zavala and González-Aguilar2018). However, by day 21, the bacterial count in FCUR remained slightly higher than in FBM, suggesting that the LAB may have adapted to the stress caused by curcumin, becoming more resistant to other types of stress. This could explain their greater viability over time. Additionally, curcumin may have contributed to greater microbial stability over time by delaying the more pronounced decline in LAB by high consumption of nutrients viability observed in the control sample. Furthermore, the addition of curcumin did not alter the overall microbial profile of the BM. The abundance and metabolic activity of microbial communities, along with the added curcumin, play a role in the stability, organoleptic properties, nutritional value and shelf life of the developed beverages.
Determination of total phenolics and antioxidant capacity
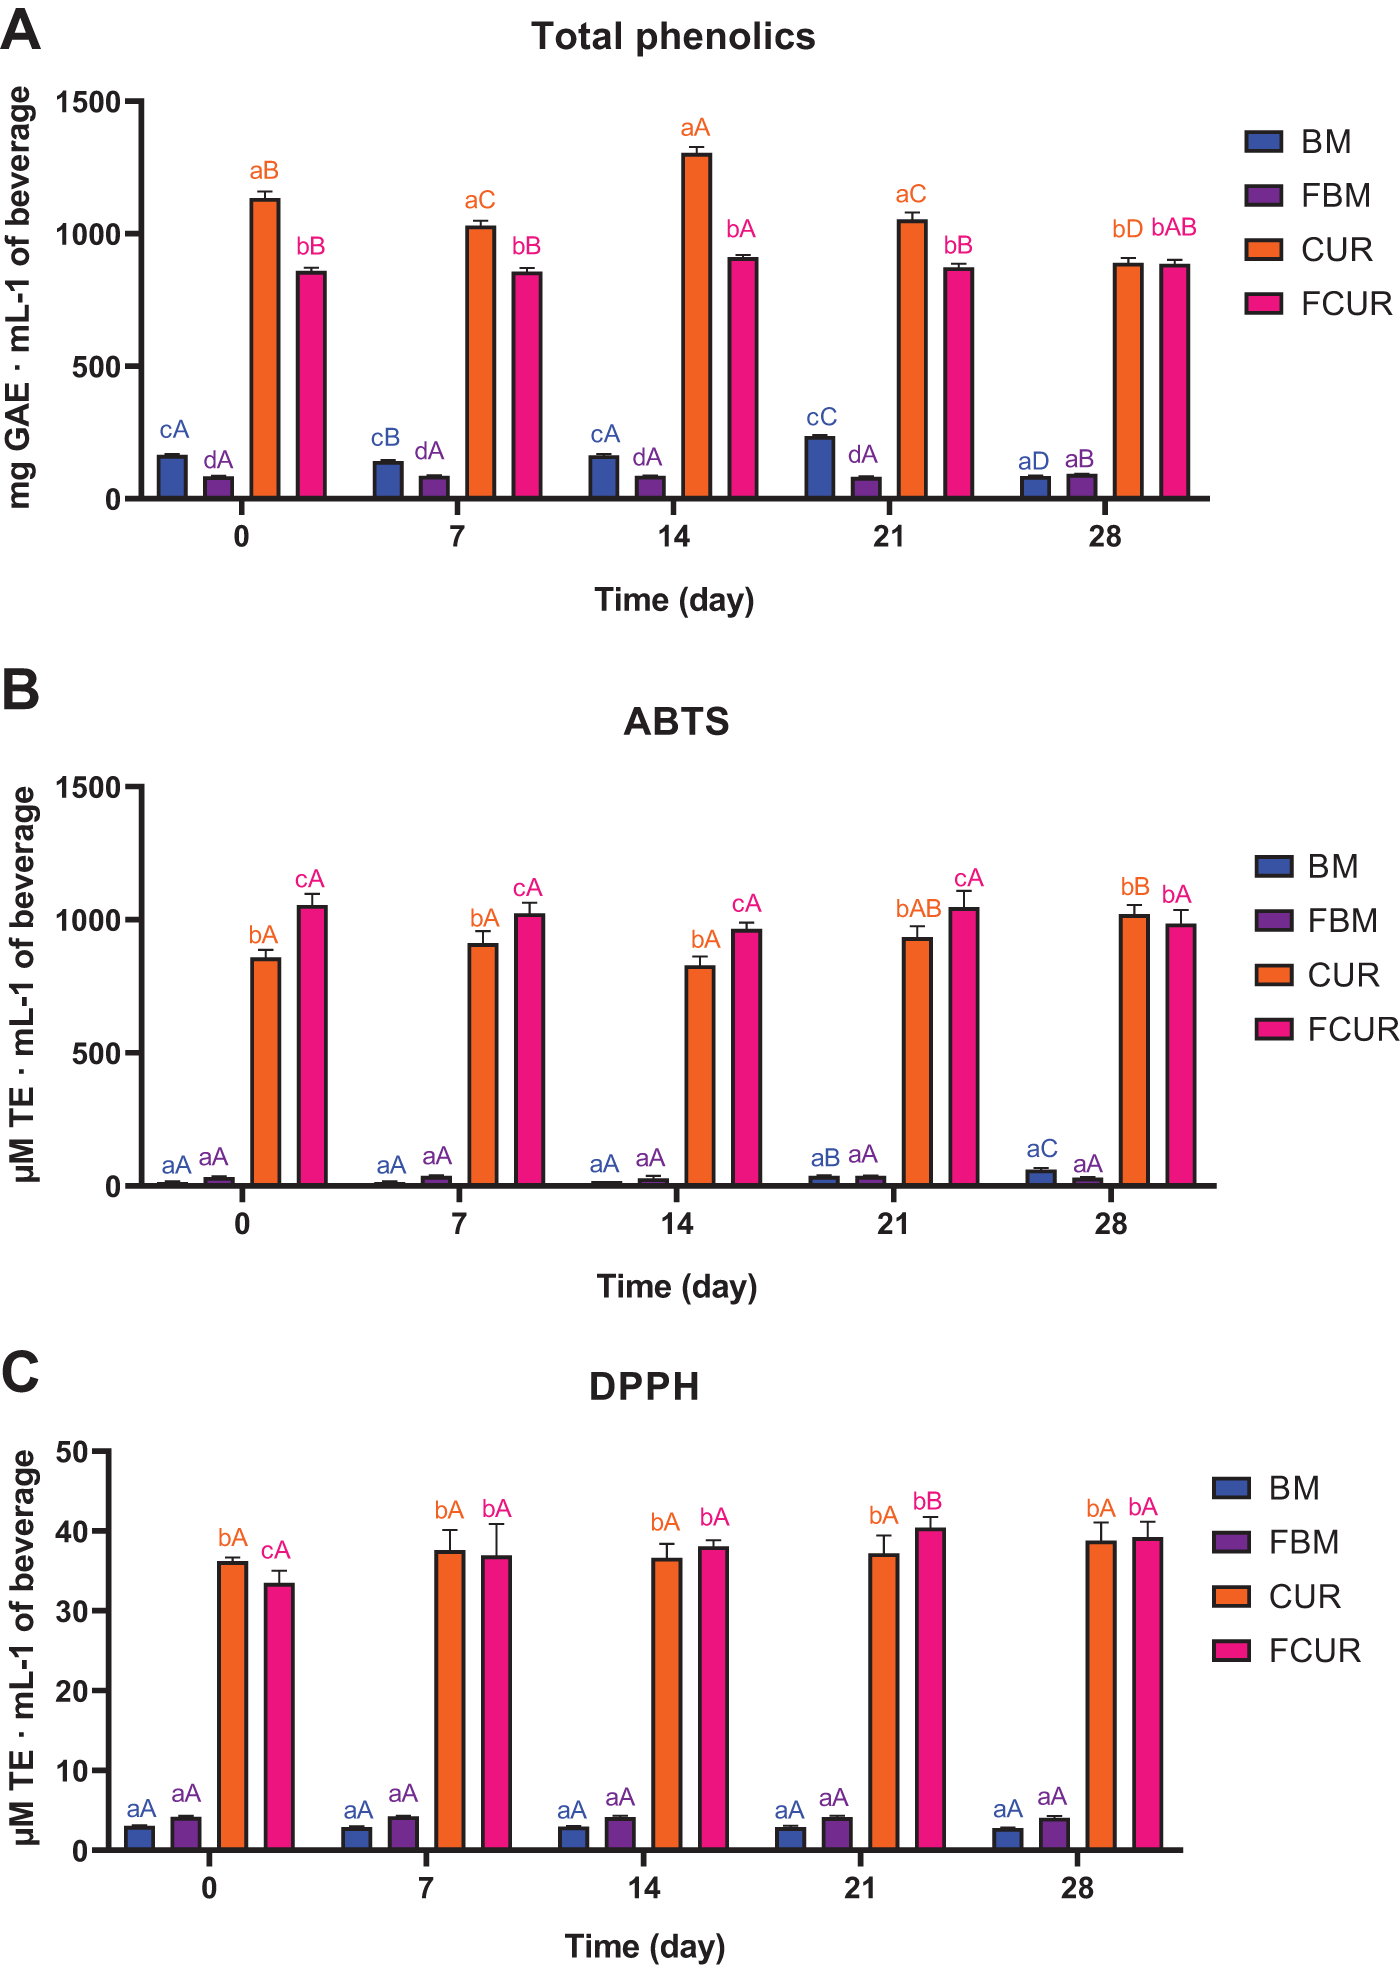
In the evaluation of total phenolic compounds, beverages containing curcumin presented the highest amounts across all weeks when compared to all other formulations. BM exhibited a higher concentration compared to FBM in all weeks, except on the last week of evaluation (Fig. 5A). A similar pattern was observed when comparing CUR and FCUR, with the fermented beverage containing less phenolic compounds.
Total phenolic compounds and antioxidant activity in buttermilk-based products. A, total phenolics; B, ABTS; C, DPPH; BM, buttermilk; FBM, fermented buttermilk; CUR, buttermilk + curcumin; FCUR, fermented buttermilk + curcumin. Data represented as mean and standard deviation of biological triplicates. Small letters refer to statistically significant differences (p < 0.05) between the beverages using ANOVA compared to BM at the same time. Capital letters refer to statistically significant differences (p < 0.05) using ANOVA, followed by the Tukey post hoc test between storage days.

The free radical quenching capacity of the samples was measured using the ABTS method, and the results showed that there was no difference between BM and FBM. However, FCUR has a higher capacity compared to CUR across all evaluated weeks, except in the final week, when the fermentation process did not alter the antioxidant capacity (Fig. 5B). The DPPH method also showed no differences in eliminating free radicals when compared to BM and FBM, or between CUR and FCUR, except during the first week, when CUR showed a higher antioxidant capacity compared to FCUR. (Fig. 5C).
In the evaluation of total phenolic compounds, BM presented a higher quantity when compared to FBM, except on the last week of evaluation (Fig. 5A). This fact may be due to the use of phenolic compounds present in BM as a substrate for the growth of microorganisms, justifying the reduction after the fermentation. Similarly, for the beverages added with curcumin, the fermented sample (FCUR) exhibited significantly lower levels of phenolic compounds compared to the non-fermented curcumin beverage (CUR). This supports the idea that, even though curcumin initially inhibited bacterial growth, the LAB may have adapted to the stress caused by curcumin and begun to use it as a substrate. In a study by Ghiamati Yazdi et al. (Reference Ghiamati Yazdi, Soleimanian-Zad, van den Worm and Folkerts2019) evaluating turmeric extracts, it was observed that in addition to being digested by probiotic microorganisms, it supported the growth of Lactobacillus rhamnosus GG (LGG) and Bifidobacterium animalis BB12. In a study by Zam (Reference Zam2018), it was shown that the administration of curcumin reduced dysbiosis, increasing the abundance of bifidobacteria, lactobacilli and butyrate-producing bacteria. The ABTS and DPPH methods showed no differences in free radical scavenging capacity between BM and FBM (Fig. 5B and 5C). When the curcumin was added to the BM (CUR) and to the FBM (FCUR), the total phenolics and the antioxidant capacity (ABTS) was improved when compared to BM (Fig. 5A and 5B). The reduction of total phenolics comparing CUR (BM added with curcumin) to FCUR (FBM added with curcumin) (Fig. 5A) can also be explained by the utilization of phenolics compounds as a prebiotic (Neyrinck et al., Reference Neyrinck, Sánchez, Rodriguez, Cani, Bindels and Delzenne2021). Curcumin has some very interesting effects on health, but the low bioavailability of curcuminoids is a limitation (Shabbir et al., Reference Shabbir, Rubab, Daliri, Chelliah, Javed and Oh2021). Although curcuminoids have low solubility in aqueous solutions and limited bioavailability, BM has been shown to effectively carry and stabilize them. Curcuminoid molecules interact with BM components by binding to the hydrophobic regions of proteins and partitioning into the fat phase. This interaction enhances the water solubility of curcuminoids and improves their stability in aqueous media (Fu et al., Reference Fu, Shen, Ajlouni, Ng, Sanguansri and Augustin2014, Reference Fu, Augustin, Shen, Ng, Sanguansri and Ajlouni2015, Reference Fu, Augustin, Sanguansri, Shen, Ng and Ajlouni2016).
In vitro analysis
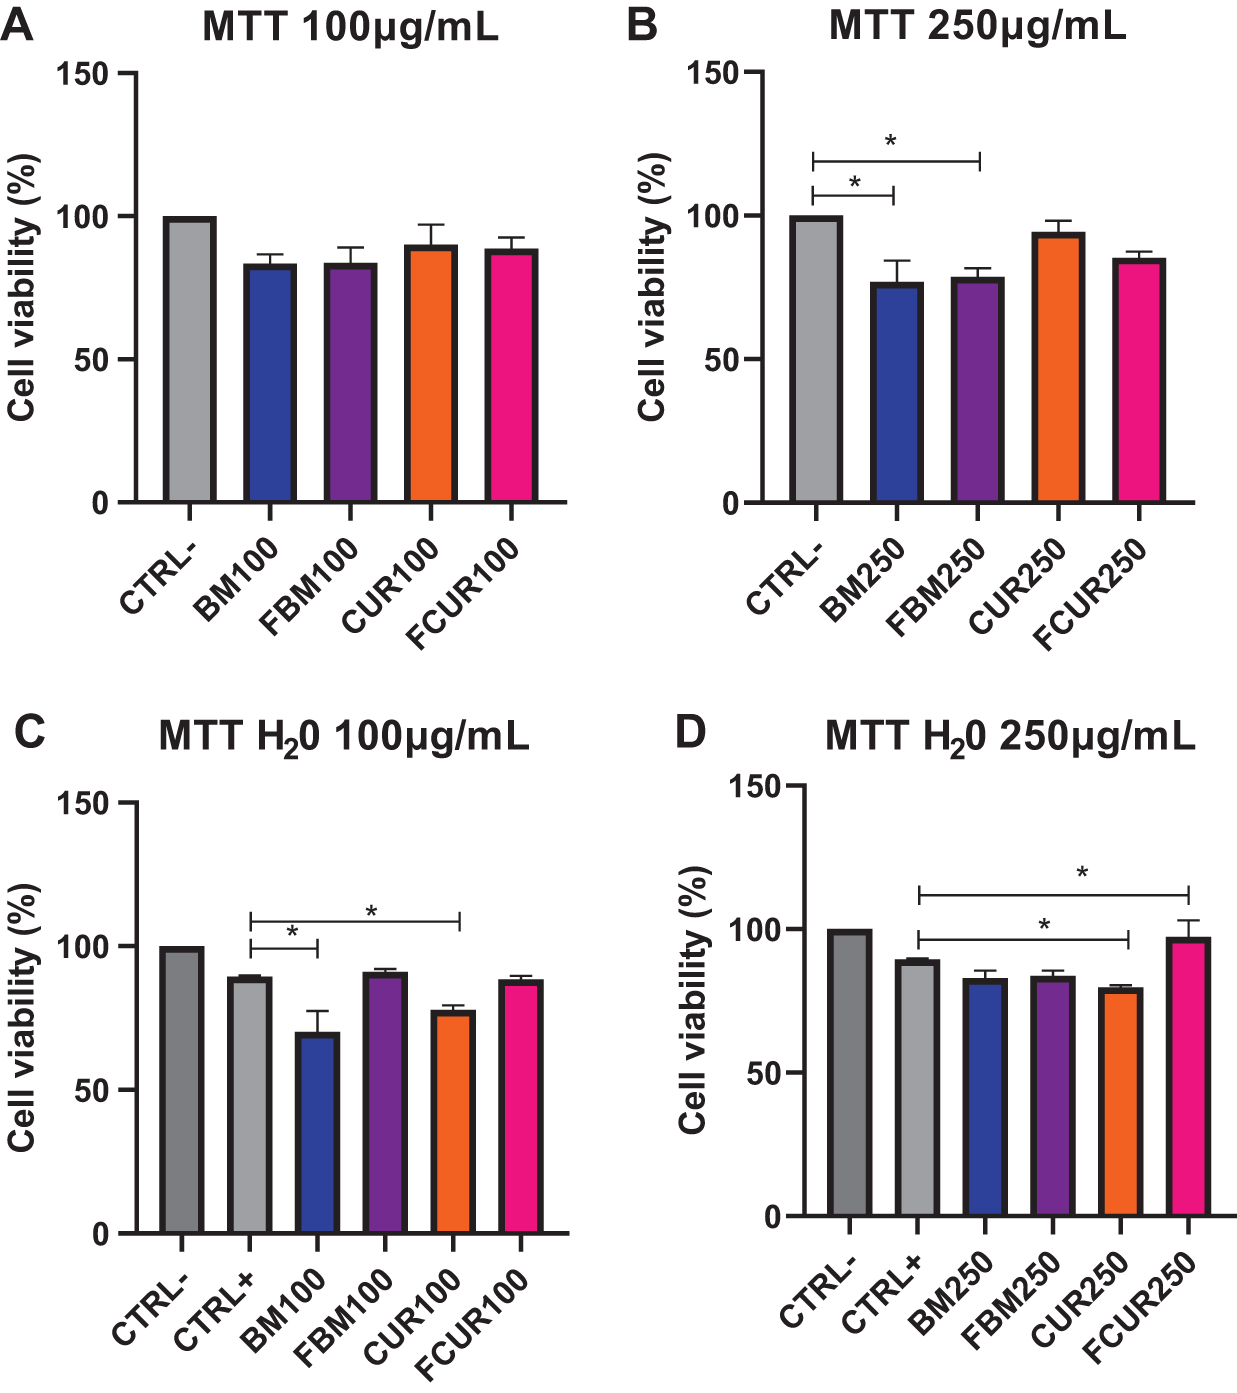
In the evaluation of cell viability, the concentration of 100 μg/ml of all products did not show differences in relation to the control (Fig. 6A). However, when using 250 μg/ml of the products, the BM (76.96 ± 14.75) and FBM (78.74 ± 5.81) formulations had a reduction in viability when compared to the control (Fig. 6B), that represents 100%. When subjected to stress with hydrogen peroxide, at a concentration of 100 μg/ml, the BM and CUR treatments did not protect the cells, reducing their viability, compared to the positive control (Fig. 6C). At a concentration of 250 μg/ml, only the FCUR formulation showed a difference in relation to the control, exerting a protective action on the cells (Fig. 6D).
In vitro evaluation of cytotoxicity of tested products at 100 μg/ml (A), 250 μg/ml (B) and after hydroperoxide exposure at 100 μg/ml (C) and 250 μg/ml (D). CTRL, control; BM, buttermilk; FBM, fermented buttermilk; CUR, buttermilk + curcumin; FCUR, fermented buttermilk + curcumin. Data represented as mean and standard deviation of biological triplicates. ANOVA followed by the Tukey post hoc test performed between groups * indicates significant difference between products compared to buttermilk.

Curcumin has demonstrated various biological activities, including antioxidant, anti-inflammatory, anti-proliferative, pro-apoptotic, antibacterial, and anti-cancer effects, through distinct cellular actions and molecular mechanisms (Epstein et al., Reference Epstein, Sanderson and MacDonald2010). The use of curcumin was effective in preventing the expression of inflammatory cytokines caused by LPS in macrophages (Guimarães et al., Reference Guimarães, Leite, Spolidorio, Kirkwood and Rossa2013) and reducing the accumulation of nitrite and the pro-inflammatory cytokines interleukin (IL) 6 and 1β and tumour necrosis factor alpha (TNFα) (De Aguiar, Reference De Aguiar2019). In different concentrations of curcumin (10−8 M, 10−7 M, 10−6 M and 10−5 M), the MTT viability test showed that curcumin was not toxic to the cell, at the different concentrations used and the treatment of the culture with curcumin inhibited the production of IL-6 (Tonetto and Stabile, Reference Tonetto and Stabile2023). These studies highlight the potential of curcumin and its derivatives in modulating the inflammatory response in RAW 264.7 macrophages, suggesting therapeutic applications in inflammatory and infectious conditions.
Conclusion
The analysis of the technological parameters of the fermented BM with added curcumin during storage demonstrated that the combination performed well in terms of stability and functionality. The addition of curcumin may influence the microbiological stability and overall quality of fermented BM. Furthermore, from an antioxidant point of view, the addition of curcumin, the most present compound of Curcuma longa and widely recognized by its antioxidant and anti-inflammatory effect, was decisive for a greater effect, without presenting a cytotoxic effect. In addition, the use of products that are not widely used by industry helps reduce waste, in line with sustainable proposals, and should be encouraged.
Acknowledgements
The authors thank the National Council for Scientific and Technological Development (CNPq) process nº 308635/2022-1 (research productivity grant to M.C.G.P.) and Fundação de Amparo à Pesquisa do Estado de Minas Gerais (FAPEMIG), Belo Horizonte, Brazil, process nº BPD-00566-22 for the support to the research and FAPEMIG Sandwich Doctorate Abroad Program (BDSS) and Postdoctoral Internship (BEPD) - UFV / FAPEMIG – 2024 (scholarship for I.X.C.). We also thank Laticínios Escola of Fundação Arthur Bernardes for donating buttermilk.
Competing interests
The authors have declared no conflicts of interest for this article.