

Introduction
The complexity of people’s subjective consciousness has led some economists to rethink how to measure financial well-being (FWB). Historically, measurement has primarily relied on objective financial indicators. However, subjective well-being measures, which take individuals’ feelings and perceptions into account, are increasingly being incorporated. Recent work defines FWB as “a set of conditions that enable people to fulfill present and recurrent financial obligations (short-term needs), make consumption decisions without getting stressed financially (short-term wants), prepare for facing economic contingencies (long-term needs), and pursue future financial goals (long-term wants)” (García-Mata and Zerón-Félix Reference García-Mata and Zerón-Félix2022). Indeed, FWB should now capture both objective (e.g., incomes, assets, and consumption) and subjective (e.g., perceptions of current financial situation, confidence in the future, and sense of achievement) measures of individuals (Brüggen et al. Reference Brüggen, Hogreve, Holmlund, Kabadayi and Löfgren2017; Joo Reference Joo2008). Although theories and empirical studies on consumers’ FWB are well-developed, those on farmers’ FWB remain limited.
There are three main gaps in farmers’ FWB that we seek to address. First, subjective aspects need to be better incorporated in economic studies. Although many economic theories incorporate subjective aspects like risk aversion, tastes, and preferences into consideration, they usually treat these factors as “exogenous” (Becker Reference Becker1965; Hvide and Panos Reference Hvide and Panos2014). In other words, they focus primarily on how individuals’ subjective characteristics influence their economic choices, but they rarely think the other way – How could economic activities shape one’s subjective aspects? Second, farmers’ roles as both producers and consumers need to be considered more in the context of FWB. Many works studying farmers’ FWB use the same or similar frameworks constructed for consumers’ FWB (İzmen and Üçdoğruk Gürel Reference İzmen and Üçdoğruk Gürel2020; Kassem Reference Kassem2013), and some others consider both roles but only in objective views (Becker Reference Becker1965; Singh et al. Reference Singh, Squire and Strauss1986; Taylor and Adelman Reference Taylor and Adelman2003). Third, to the best of our knowledge, there is no compelling and widely used framework or research agenda to help understand farmers’ FWB.
To address gaps in previous literature and account for farmers’ unique characteristics, we propose a structured conceptual framework to study farmers’ FWB. The conceptual framework we built consists of two sections: the determinants and measurements of farmers’ FWB. In the determinants section, our framework analyzes the determinants of farmers’ FWB through micro, meso, and macro levels, as well as the determinants’ impacts on farmers’ households or farms. For the measurement section, we assess the FWB through 16 dimensions within 4 categories: household-subjective category, household-objective category, farm-subjective category, and farm-objective category. Based on the framework and previous literature, we further propose 16 detailed financial ratios to measure objective dimensions of FWB, and we construct a questionnaire with 38 questions to measure subjective dimensions of FWB. Finally, after aggregating the measurements (16 financial ratios and 38 survey questions) into the 16 dimensions, we provide a visualization evaluation figure to present and compare the measurement results.
We apply our framework to 100 ranchers in the U.S. Generally, we find that these ranchers feel better about their households’ finances than their ranches’. And they are more positive about the ranches’ future financial situations than their current situations. After regressing the subjective FWB on the ranchers’ demographics, we find that individuals’ age, herd size, land size, location, economics-related degree, primary occupation as farmer, household income, and expenditure have statistically significant impacts on their FWB perceptions. In addition to the analysis of their subjective aspects, we chose two ranchers with their objective dimensions to build our FWB measurement figures and provide comparisons. This application helps illustrate our framework and shows its advantages.
The remainder of the paper is organized as follows. In Section “General Financial Well-Being,” we briefly discuss the theoretical foundations of general FWB. Section “Literature Review on Farmers’ Financial Well-Being” provides a literature review focusing on farmers’ FWB and discusses gaps in previous literature. In Section “A Conceptual Framework for Farmers’ FWB,” we propose a specialized conceptual framework to study farmers’ FWB, and Section “Designing a Questionnaire Based on Our Framework” further discusses some details for designing empirical studies based on our framework. Section “Application: Subjective FWB of U.S. Cattle Producers” applies our framework to beef ranchers in the U.S. to study their subjective FWB, while Section “Application: Combining Objective and Subjective FWB of U.S. Cattle Producers” compares two ranchers’ FWB measurement figures to illustrate our framework. Section “Conclusions and Implications” concludes.
General financial well-being
Economic well-being and FWB have historically been treated as equivalent and used interchangeably (Joo Reference Joo2008). This interchangeability is applied in many related studies (García-Mata and Zerón-Félix Reference García-Mata and Zerón-Félix2022). Some other terminologies like financial satisfaction, financial happiness, financial wellness, financial efficacy, economic insecurity, and financial health also have similar meanings in previous literature (Ghazali et al. Reference Ghazali, Alwi, Abd Aziz and Hazudin2020; Nanda and Banerjee Reference Nanda and Banerjee2021). However, some literature underlines the distinction between economic well-being and FWB. For example, Sorgente and Lanz (Reference Sorgente and Lanz2017) define the objective components of FWB as economic well-being. Joo (Reference Joo2008), while acknowledging their frequent interchangeable use, notes that “generally, financial well-being tends to include broader aspects of financial life, whereas economic well-being is most often associated with income level.”
The understanding of FWB has evolved over time, and this process has been speeding up in recent decades. García-Mata and Zerón-Félix (Reference García-Mata and Zerón-Félix2022) reviewed the origins and development of the conception of FWB. They believe FWB originates from a simple concept of “happiness or general satisfaction with the financial situation” and has developed into a more comprehensive connotation (García-Mata and Zerón-Félix Reference García-Mata and Zerón-Félix2022; Porter Reference Porter1990). Using bibliometric analysis, Kaur et al. (Reference Kaur, Singh and Singh2021) document a substantial increase in published articles on FWB, from only 2 in 1995 to 44 in 2019. They also observe a notable surge in publications beginning in 2014, many of which are conceptual in nature.
At the core of these evolving conceptual contributions is the definition of FWB, with recent works enriching our understanding in the following ways. First, FWB should include individuals’ perceptions or feelings (Brüggen et al. Reference Brüggen, Hogreve, Holmlund, Kabadayi and Löfgren2017; Salignac et al. Reference Salignac, Hamilton, Noone, Marjolin and Muir2020). Second, FWB should encompass not only the present financial situation but also expectations regarding the financial future (Brüggen et al. Reference Brüggen, Hogreve, Holmlund, Kabadayi and Löfgren2017; Salignac et al. Reference Salignac, Hamilton, Noone, Marjolin and Muir2020). Third, a good state of FWB extends beyond meeting people’s financial obligations; it can also involve fulfilling desires, experiencing a sense of freedom, and enjoying life (García-Mata and Zerón-Félix Reference García-Mata and Zerón-Félix2022).
These theoretical contributions not only clarify the definition of FWB but also deepen our broader understanding of the concept. The Consumer Financial Protection Bureau (CFPB, 2017) provides four key elements of FWB: “has control over one’s finances,” “capacity to absorb a financial shock,” “on track to meet those financial goals,” and “being able to make choices that allow one to enjoy life.” Salignac et al. (Reference Salignac, Hamilton, Noone, Marjolin and Muir2020), drawing on prior research, emphasize that FWB interacts with an individual’s environment and should be understood within a life-course framework. They also argue for three dimensions of FWB: “meeting expenses and having some money left over, being in control, and feeling financially secure” (Salignac et al. Reference Salignac, Hamilton, Noone, Marjolin and Muir2020). By employing a systematic review and meta-analysis, Ngamaba et al. (Reference Ngamaba, Armitage, Panagioti and Hodkinson2020) expound and examine the association between FWB and subjective well-being. Moreover, some work explores conceptual frameworks or research agendas to guide future FWB studies (Brüggen et al. Reference Brüggen, Hogreve, Holmlund, Kabadayi and Löfgren2017; Fu Reference Fu2020; Nanda and Banerjee Reference Nanda and Banerjee2021; Salignac et al. Reference Salignac, Hamilton, Noone, Marjolin and Muir2020).
Besides theoretical studies on general FWB, review articles focused on more specific areas also contribute to the literature. Glenn et al. (Reference Glenn, Allen Scott, Hokanson, Gustafson, Stoops, Day and Nykiforuk2021) review community-level intervention strategies to promote FWB. Gonçalves et al. (Reference Gonçalves, Ponchio and Basílio2021) review articles on women’s FWB. They provide a great example by analyzing the determinants of women’s FWB in three levels: individual level, household level, and society level. Some other articles review subareas of FWB related to consumers, researchers, and young adults (Kaur et al. Reference Kaur, Singh and Singh2021; Lee et al. Reference Lee, Lee and Kim2020; Nanda and Banerjee Reference Nanda and Banerjee2021; Shim et al. Reference Shim, Xiao, Barber and Lyons2009; Sorgente and Lanz Reference Sorgente and Lanz2017). However, to the best of our knowledge, no review has specifically focused on farmers’ FWB.
After reviewing the relevant literature and considering the purposes of this study, we adopt the definition proposed by García-Mata and Zerón-Félix (Reference García-Mata and Zerón-Félix2022), which conceptualizes FWB as “a set of conditions that enable people to fulfill present and recurrent financial obligations (short-term needs), make consumption decisions without getting stressed financially (short-term wants), prepare for facing economic contingencies (long-term needs), and pursue future financial goals (long-term wants).” This recent definition aligns well with our objective of analyzing farmers’ FWB. To develop an integrated conceptual framework for examining farmers’ FWB, this study adopts the broader conceptualization, encompassing both objective and subjective dimensions.
Literature review on farmers’ financial well-being
Despite arguments on several nuanced issues, the fundamental theories underlying FWB are well-developed in previous literature. However, in empirical work, a one-size-fits-all theory may be inappropriate, which means theories and research agendas in subareas are needed. Also, there are some gaps in previous empirical work, which we will discuss in the following sections. In this paper, we will specifically focus on farmers’ FWB.
To better identify the gaps in previous literature related to farmers’ FWB, we first construct a literature review using the ScopusFootnote 1 database to search for relevant articles. Scopus is the largest abstract and citation database of peer-reviewed literature,Footnote 2 and many review articles on FWB utilize this database (Datta and Behera Reference Datta and Behera2022; Gonçalves et al. Reference Gonçalves, Ponchio and Basílio2021; Kaur et al. Reference Kaur, Singh and Singh2021; Oczkowski and Doucouliagos Reference Oczkowski and Doucouliagos2015; Sorgente et al. Reference Sorgente, Totenhagen and Lanz2022).
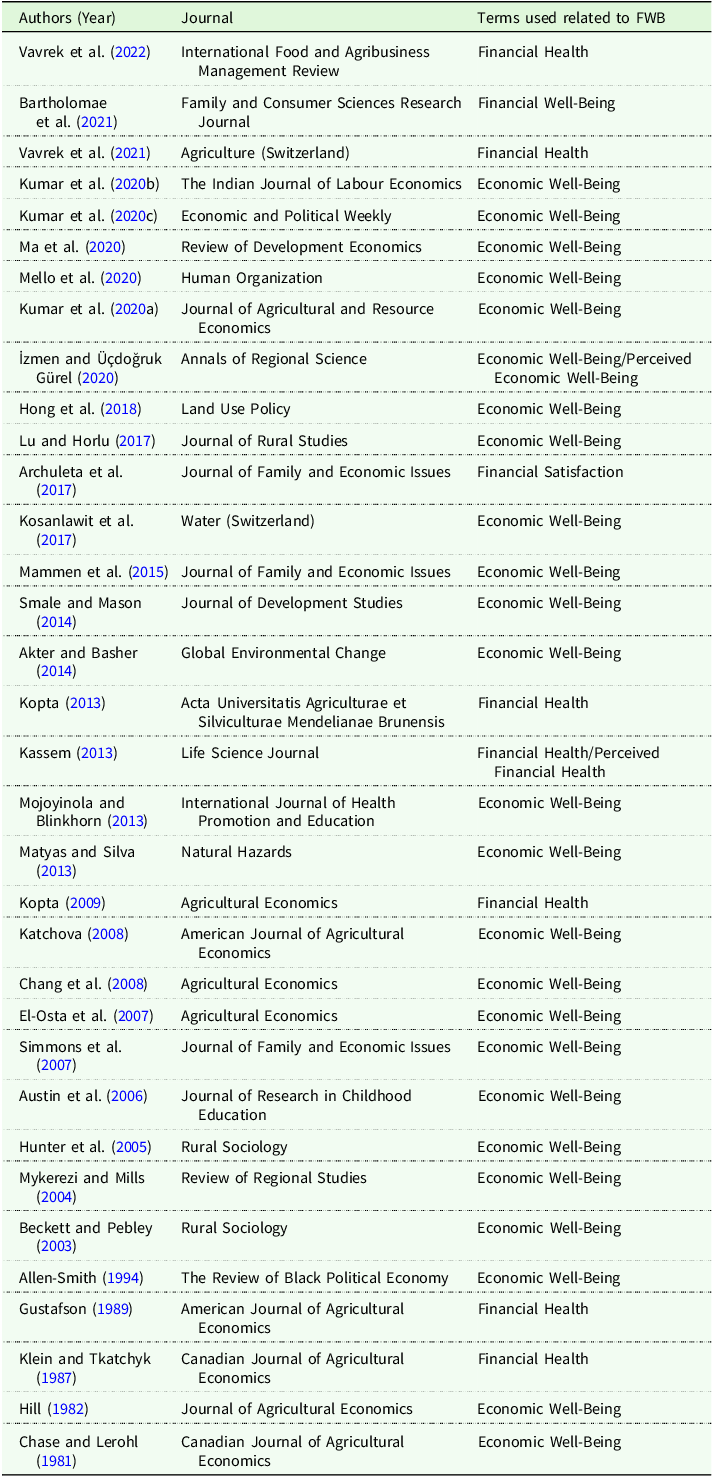
After the searching and cleaning proceduresFootnote 3 , a final set of 34 articles remains for further analysis (see Table 1). From Table 1, we can observe that in the context of studies related to farmers’ FWB, the term “economic well-being” is used most often (25 of the 34 articles), the term “financial health” is used for 7 articles, and “financial satisfaction” and “financial well-being” are only used once, respectively. Although all these 33 articles include terms like economic well-being or financial health in their titles, only 4 articles carefully discussed the terms’ definitions (see Table A.1 in the Appendix).
Articles summary

Table 1. Long description
A table summarizing 34 articles on farmers’ financial well-being, focusing on terms used and journals. The table has 34 rows and 3 columns. Column headers are Authors (Year), Journal, and Terms used related to FWB. Each row lists the authors and year, the journal name, and the terms used related to financial well-being. Notable terms include economic well-being, financial health, financial satisfaction, and financial well-being. The table shows that economic well-being is the most frequently used term, appearing in 25 articles, followed by financial health in 7 articles, and financial satisfaction and financial well-being each appearing once.
We then analyze the measures of economic well-being or other terms used in the 34 articles; see Table A.2 in the Appendix for details. Although in theoretical work, economic well-being and FWB usually have similar content with both subjective and objective aspects, empirical work related to farmers usually regards economic well-being as the objective side of financial situations. Among the empirical works that incorporate subjective indicators, the term “perceived economic well-being” is often highlighted (Beckett and Pebley Reference Beckett and Pebley2003; İzmen and Üçdoğruk Gürel Reference İzmen and Üçdoğruk Gürel2020). While some literature relies on respondents’ general perceptions of their financial situation, e.g., the general perception of economic conditions, comparison with past or neighbors (Beckett and Pebley Reference Beckett and Pebley2003; İzmen and Üçdoğruk Gürel Reference İzmen and Üçdoğruk Gürel2020; Simmons et al. Reference Simmons, Braun, Wright and Miller2007), some other literature focuses more on detailed life experiences like income level, food security, childcare, employability, health care security, housing security, transportation, reliance on assistance programs, and capabilities (Akter and Basher Reference Akter and Basher2014; İzmen and Üçdoğruk Gürel Reference İzmen and Üçdoğruk Gürel2020; Mammen et al. Reference Mammen, Dolan and Seiling2015). We find that the most frequently used objective measures of FWB were income, consumption, wealth, financial index, and their derivatives (see Table A.2 in the Appendix). Although various variables are used to measure the FWB of farmers, we observe that agricultural economics research lags in incorporating farmers’ subjective perceptions, despite the importance of these dimensions.
We further analyze the determinants of FWB mentioned in these 34 articles. Details are available in Table A.3 in the Appendix. We categorize these determinants into three analytical levels: Macro level, Meso level, and Micro level. Macro-level determinants include factors of societies, nations, economics, policies, and environments. Meso-level determinants include factors related to communities, parties, organizations, and groups. Micro-level determinants are factors at the individual or household level. Our analysis shows that the literature varies widely in the determinants considered, and each analytical level includes numerous variables that may influence FWB. Although factors are multitudinous, some concerns remain for empirical studies. First, to the best of our knowledge, there is no convincing and widely used framework or research agenda to help decide what factors might affect farmers’ FWB. Second, the boundary between FWB measures and FWB determinants is usually obscure. For example, while some articles may identify household income or household wealth as the measures or proxies of FWB (Hunter et al. Reference Hunter, Boardman and Onge2005; Katchova Reference Katchova2008), others use income or wealth as the determinants of FWB (İzmen and Üçdoğruk Gürel Reference İzmen and Üçdoğruk Gürel2020; El-Osta et al. Reference El-Osta, Mishra and Morehart2007). Third, the dual roles of farmers are often unidentified. Some papers consider farmers as consumers, while others consider them as producers, but only a few studies include both roles in their consideration. These gaps point out the need for a new framework specifically for farmers’ FWB.
A conceptual framework for farmers’ FWB
A conceptual framework specifically for farmers is needed not only because of the gaps in previous literature, but also because farmers are different from other groups, at least in the following ways. First, farmers are not only consumers but also producers. By reviewing the theoretical work on FWB, we find that many papers only consider subjects as “consumers,” although they use the word “individuals” to identify their study subjects. Thus, their main measurement of individuals’ FWB became whether or not their income and consumption can meet their needs and wants. Although there are well-developed agricultural household models that view farmers as both consumers and producers (Singh et al. Reference Singh, Squire and Strauss1986; Taylor and Adelman Reference Taylor and Adelman2003), FWB, especially subjective FWB, is still missing in these theories. Only a few empirical FWB studies have implied that farmers are also producers (Akter and Basher Reference Akter and Basher2014; Archuleta et al. Reference Archuleta, Zimmerman, Williams, Olsen, Coffman and Burr2017), but the studies do not provide a structured theory or conceptual model to support their practice. Farmers’ roles as producers distinguish them from consumers alone because farmers face more risks in production, like weather, pests, and disease, and the uncertainty of their income can affect their perceptions of financial security (Harwood et al. Reference Harwood, Heifner, Coble, Perry and Somwaru1999; Kahan Reference Kahan2008). The influence of food price fluctuations also has complex effects on farmers (Harwood et al. Reference Harwood, Heifner, Coble, Perry and Somwaru1999; Kahan Reference Kahan2008). For most non-farm households, these fluctuations only influence their expenditures, but for farm households, their incomes may also be affected. Moreover, farmers’ financial expectations and life goals might be different. Farmers’ satisfaction with their careers is highly related to their farm business and their relationship with nature (Gao and Arbuckle Reference Gao and Arbuckle2024). Thus, farmers’ household and business aspects are highly related to each other (Archuleta et al. Reference Archuleta, Zimmerman, Williams, Olsen, Coffman and Burr2017), and so are their financial decisions.
Second, farmers can consume their own-produced food. Farmers are usually primary commodity producers, which means their products can meet some of their basic needs, which is common for smallholders (Huang et al. Reference Huang, Antonides and Nie2020). The potential for own-produced food may shape farmers’ production and consumption decisions, connection to markets, etc. (Bellon et al. Reference Bellon, Kotu, Azzarri and Caracciolo2020; Zhou et al. Reference Zhou, Liu, Liu and Zhao2025).
Third, farmers may differ from urban residents in terms of demographic characteristics and access to public resources. Their education levels, religious affiliations, political orientations, racial composition, access to health care, and other characteristics may systematically differ from those of urban populations (Afoakwah and Koomson Reference Afoakwah and Koomson2021; Hu Reference Hu2024). For example, in the United States, Whites accounted for 78.2 percent of the rural population compared to 57.3 percent of the urban population, and 19 percent of the rural population was aged 65 or older, compared with 15 percent in urban areas in 2017 (Cromartie Reference Cromartie2018). These differences can shape farmers’ financial attitudes, knowledge, behavioral patterns, and perceptions (Greteman et al. Reference Greteman, Garcia-Auguste, Gryzlak, Kahl, Lutgendorf, Chrischilles and Charlton2022; Oliver-Marquez et al. Reference Oliver-Marquez, Guarnido-Rueda and Amate-Fortes2021; Valentine and Khayum Reference Valentine and Khayum2005).
Fourth, farmers can have both non-farm income and farm income. According to Whitt et al. (Reference Whitt, Lacy and Lim2023), “about 84 percent of all U.S. farm households earn the majority of their total household income from off-farm sources and often use off-farm income to cover some portion of farm expenses.” Self-employment, wage or salary jobs, and unearned income sources like public and private pensions, interest and dividend payments, etc., are the primary off-farm income sources (Whitt et al. Reference Whitt, Lacy and Lim2023).
Fifth, many farmers maintain separate household and farm finances, yet both have impacts on their FWB. Farmers often separate farm and household finances for reasons such as financial security, tax reporting, management efficiency, and ownership structures. For instance, U.S. farmers with a typical sole proprietorship farm are obliged to report their farm income or loss and submit a detailed tax form (Schedule F in most cases) to the IRS, which requires them to keep separate and accurate financial records for their farms.Footnote 4 Although this practice distinguishes farm finances from household finances, both components play important roles in shaping overall FWB.
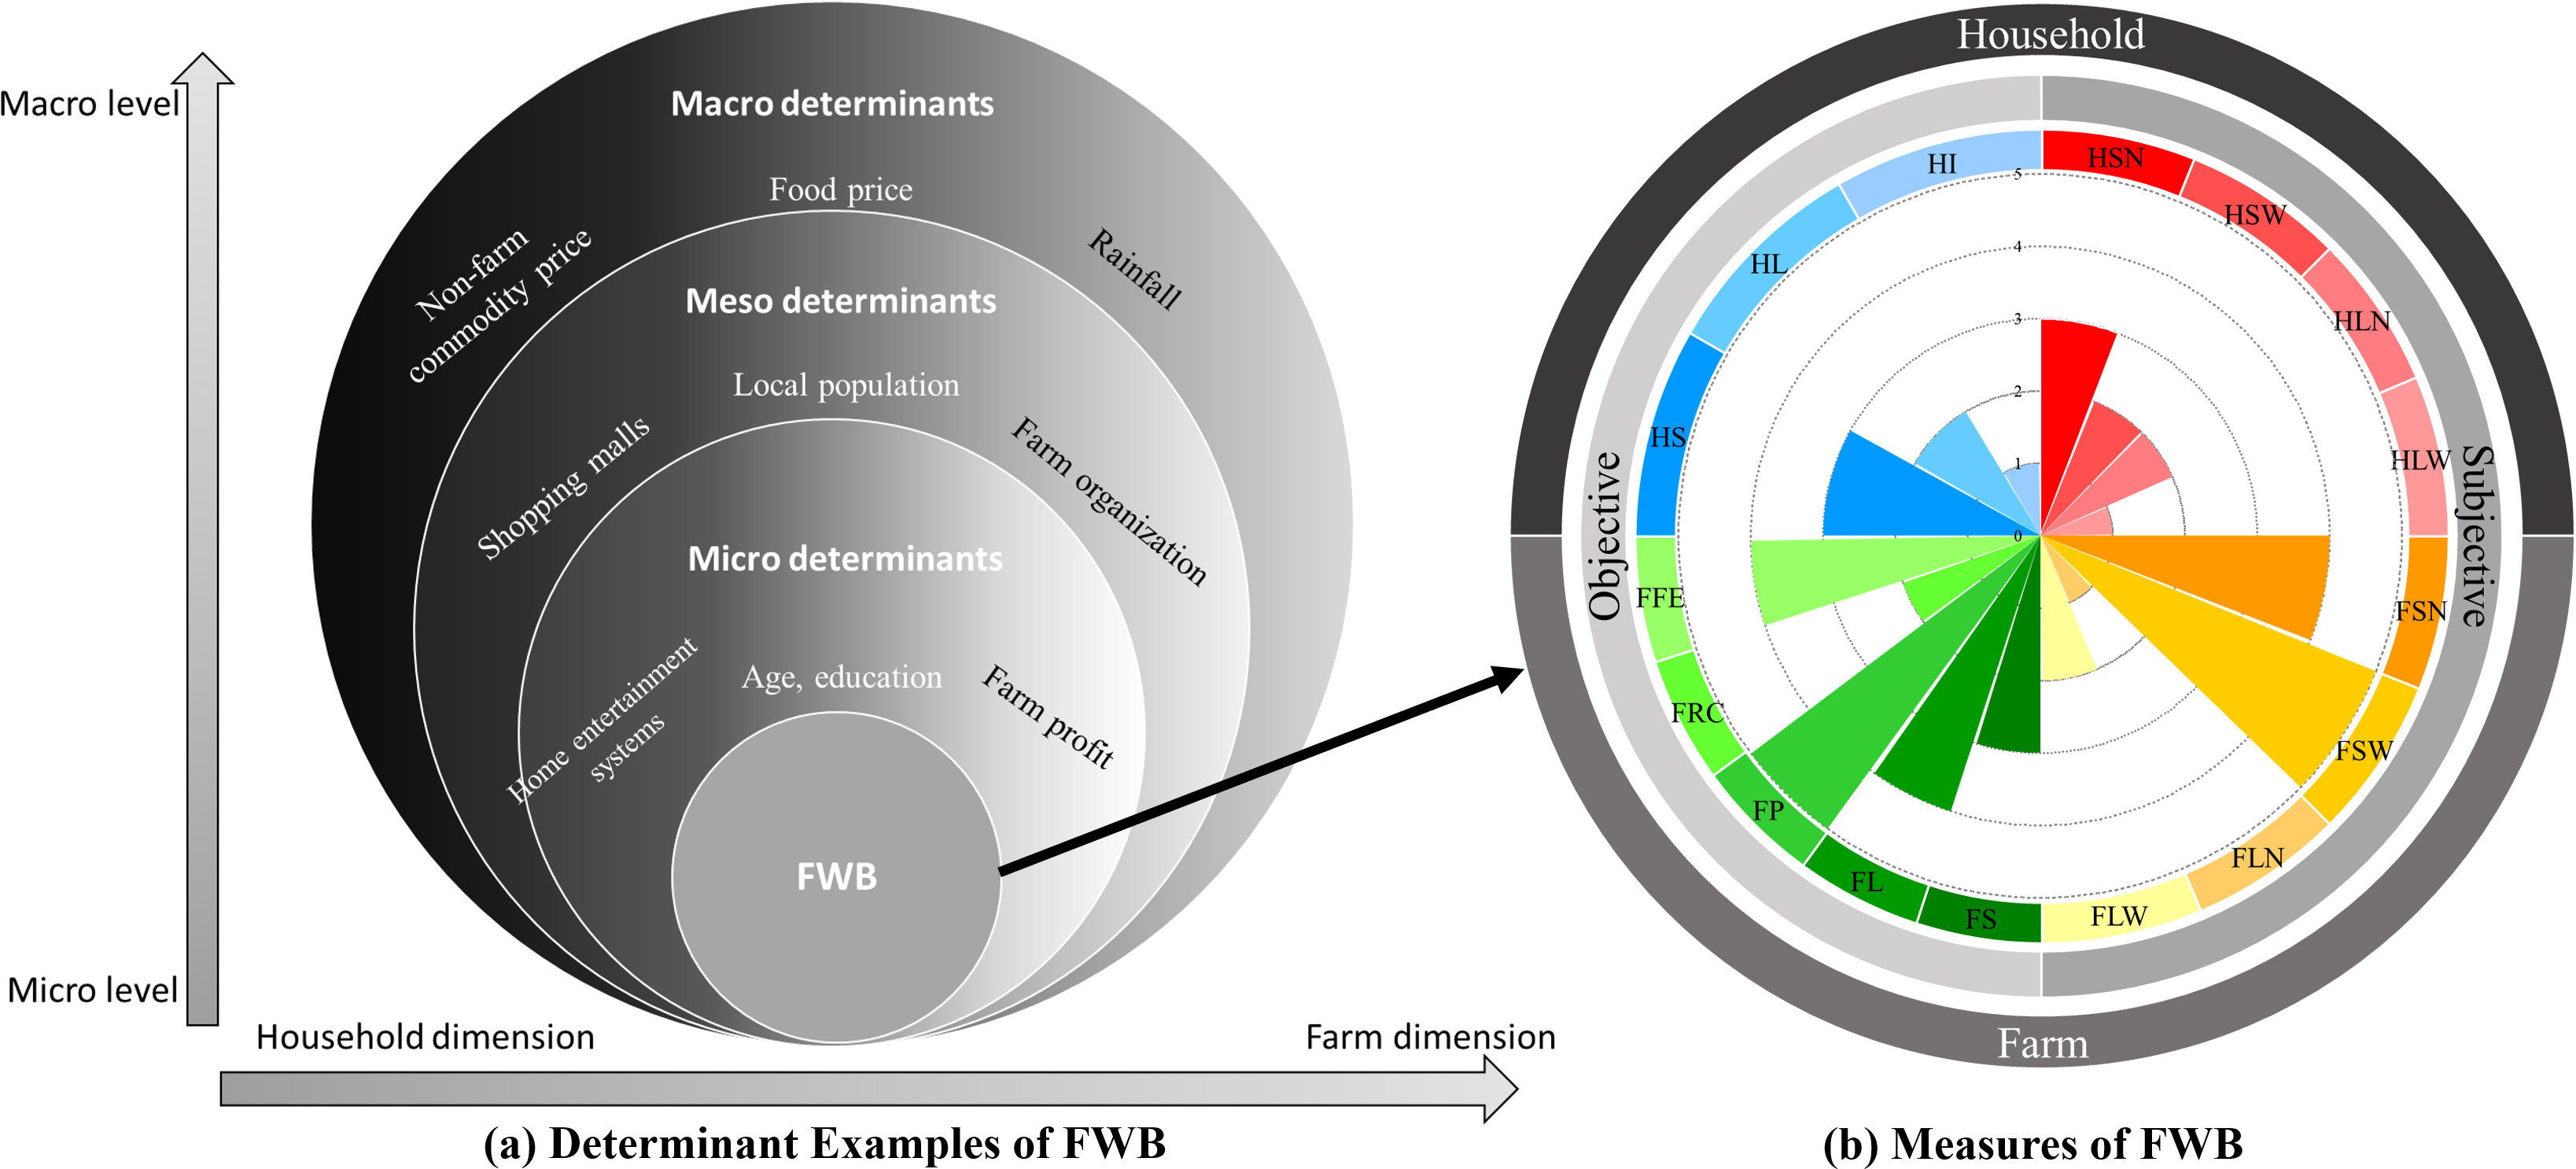
To address these gaps in previous literature and fully consider farmers’ characteristics, we propose the following conceptual framework (see Figure 1) to help understand farmers’ FWB and provide a research agenda for future empirical studies. Our conceptual framework consists of two sections: the determinants and the measurements of farmers’ FWB, which are illustrated respectively by the two subfigures of Figure 1. In the first section (Panel (a) of Figure 1), we present a structure for how to consider the determinants or influences of farmers’ FWB. On the y-axis, we classify the influence into three analytical levels: Macro level, which includes those factors of societies, nations, economics, policies, and environments; Meso level, which includes those factors related to communities, parties, organizations, and groups; and Micro level, which includes those factors at the individual or household level. At every analytical level, we show several example factors to help understand the classification. Then, for the x-axis, we consider the roles of farmers as consumers and producers. Determinants listed on the left side would have stronger impacts on farmers’ FWB when considering them as consumers, determinants listed on the right would have more impact on their roles as producers, and the determinants listed in the middle would have impacts on both. By combining both the x-axis and y-axis, we can better classify these factors. For example, at the Micro level, home entertainment systems like TVs would affect the farmers’ FWB more through their roles as consumers. Farm organization would have an influence that affects their FWB more through the producer channel. The age and education of farmers could have impacts on both the consumer side and the producer side.
At the core of Panel (a) of Figure 1 is the dependent variable: farmers’ FWB, which can be further measured through Panel (b) of Figure 1. To comprehensively measure farmers’ FWB, we built Panel (b) of Figure 1 with 16 dimensions of measures. We propose these dimensions based on previous works of García-Mata and Zerón-Félix (Reference García-Mata and Zerón-Félix2022); Greninger et al. (Reference Greninger, Hampton, Kitt and Achacoso1996); and Kim and Lyons (Reference Kim and Lyons2008), the Farm Financial Scorecard.Footnote 5 These 16 dimensions are divided into four categories based on whether they are on the subjective or objective sides and household or farm sides. In the household-subjective category, we have four dimensions: (1) household short-term needs (HSNs), (2) household short-term wants (HSWs), (3) household long-term needs (HLNs), and (4) household long-term wants (HLWs). In the farm-subjective category, there are the following four dimensions: (1) farm short-term needs (FSN), (2) farm short-term wants (FSW), (3) farm long-term needs (FLNs), and (4) farm long-term wants (FLWs). In the farm-objective category, we have five dimensions: (1) farm solvency, (2) farm liquidity (FL), (3) farm profitability (FP), (4) farm repayment and replacement capacity (FRRC), and (5) farm financial efficiency. Finally, in the household-objective category, we have the following three dimensions: (1) household solvency (HS), (2) household liquidity (HL), and (3) household investment (HI).
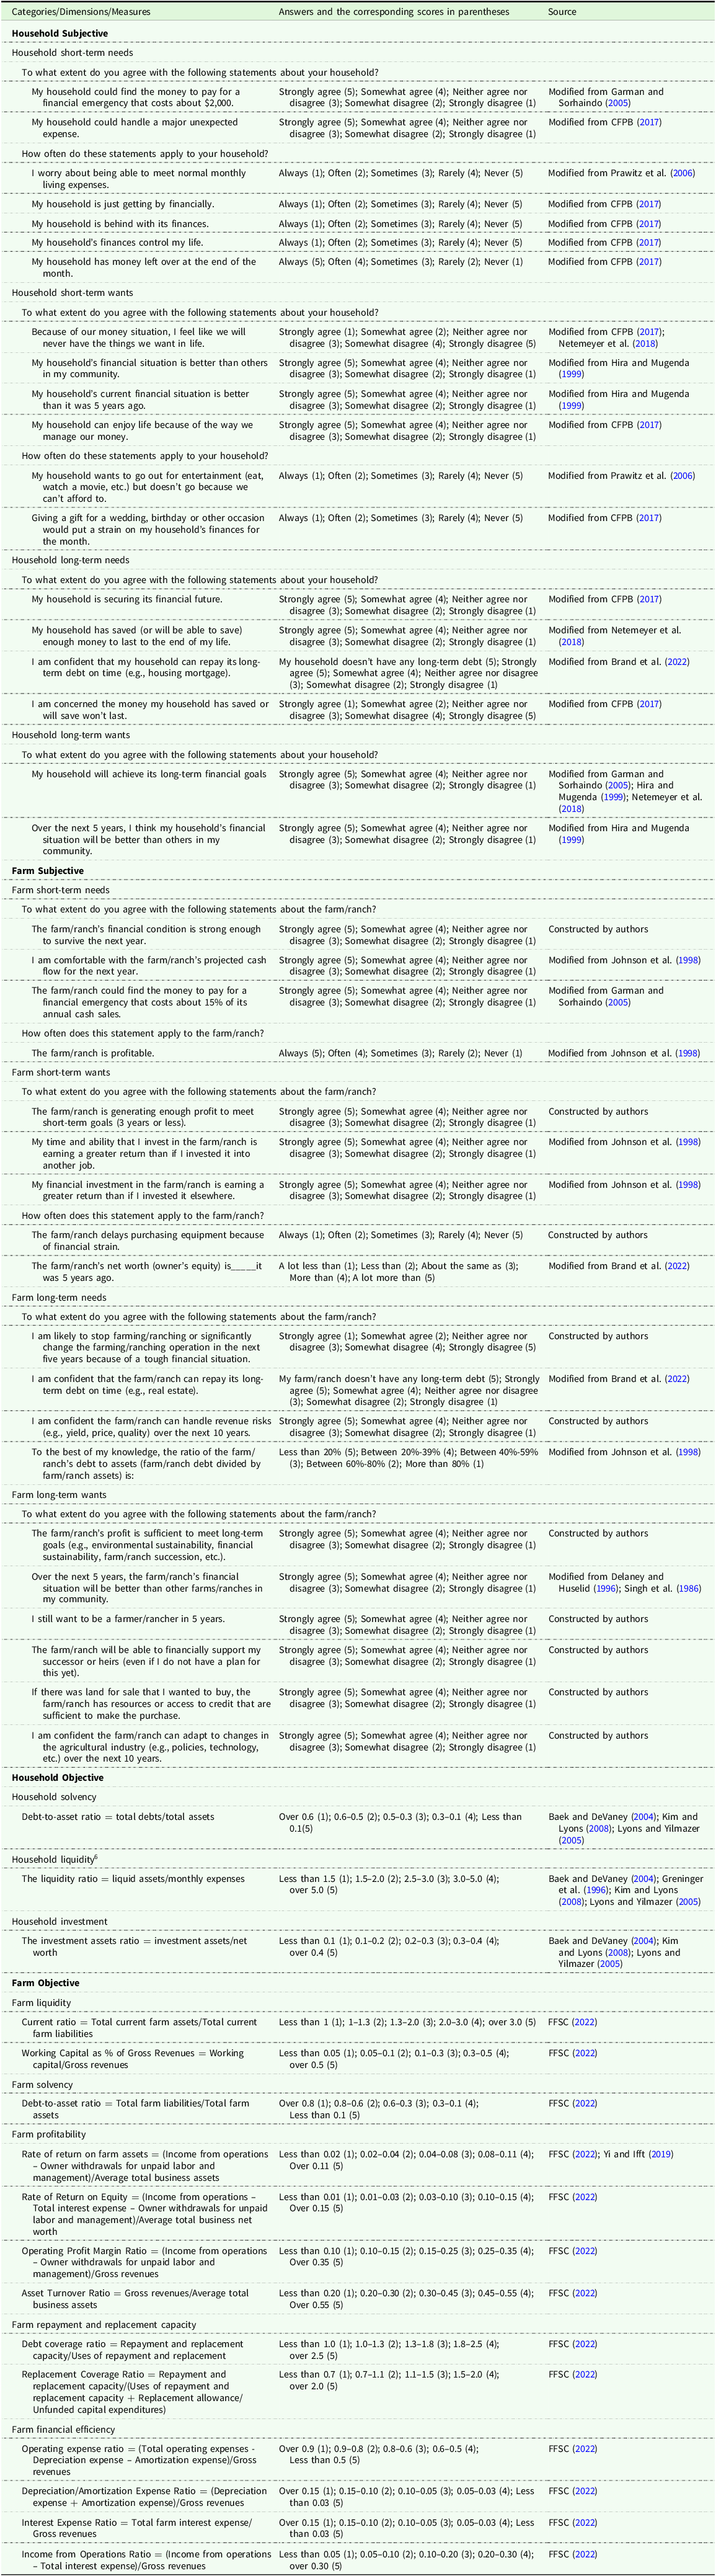
In each dimension, there is at least one (usually more) measure (perceptions or financial ratios) to assess the corresponding aspect of farmers’ FWB. Although there is some flexibility for researchers to choose detailed measures based on their circumstances, we propose an example set for each dimension (see Table 2). We also provide rules for converting these measures into numerical scores ranging from 1 to 5, where 1 represents the worst outcome and 5 the best; the detailed rules are presented in Table 2. It should be noted that for objective measures, we provide specific benchmarks to facilitate the transformation of raw financial ratios into these indexed scores. These benchmarks are intended as suggestions; they may be adjusted by future researchers to better align with specific study purposes or the unique characteristics of a targeted population. The next step is determining how to aggregate scores within the same dimension and, if an overall FWB index is required, how to combine the scores of the eight dimensions. Ideally, a weighted average should be used, which gives more weight to the more meaningful or informative perceptions or financial ratios. This method can be illustrated with the following equation:
 $S_{d}=\sum _{m\in d}W_{m}\times S_{m}$
where S
d
is the aggregated score of the dimension d. m represents the measures within the dimension d. W
m
and S
m
are the weight and score of the measure m, respectively. And W
m
follows
 $\sum _{m\in d}W_{m}=1.$
This weighted equation can also be applied for aggregating dimension scores into an overall FWB index.
Suggested measures/survey questions of FWB

Table 2. Long description
Panel A: Table with dimensions and corresponding measures for assessing farmers’ well-being. Panel B: Rules for converting measures into numerical scores ranging from 1 to 5. Panel C: Equation for aggregating scores within dimensions and combining dimension scores into an overall index.
Researchers applying this framework can determine the weights, if any, assigned to each measure/dimension in accordance with their study’s purpose and the relative importance of these measures/dimensions to the target population. For example, consider respondents from contract poultry operations, where farms often operate with relatively high leverage. These operations typically hold substantial assets but have comparatively low equity. In this context, the rate of return on farm assets may provide a more informative measure of farms’ profitability than the rate of return on equity. Because high leverage can inflate the rate of return on equity, this measure may obscure meaningful variation in operational performance, whereas the rate of return on assets better captures underlying productivity differences. Therefore, greater weight could be assigned to the rate of return on farm assets when constructing the score on the FP dimension. Alternatively, when evaluating the FWB of young farmers – who are typically at an early stage of wealth accumulation with poor short-term financial health – their long-term financial prospects may be more important than short-term outcomes for both farmers and researchers. In such cases, researchers may choose to assign greater weight to long-run dimensions.
With the aggregated scores of dimensions calculated above, a rose diagram can be drawn to illustrate and compare the FWB of different farmers (See Panel (b) of Figure 1). For instance, in our sample figure, the dimension “FL” is graded with “4” and the dimension “HSW” is only graded with “2,” and two corresponding circular sectors with different sizes are drawn based on these grades.
Our proposed conceptual framework provides a comprehensive and efficient system to understand farmers’ FWB and help conduct empirical studies. Farmers’ characteristics as consumers and producers are taken into full consideration, the potential missing variable problems can be avoided, and, significantly, both subjective and objective aspects are included in the system. Given the broad foundation and adaptability of our framework, we believe that the framework, if carefully adjusted for different circumstances, is applicable to various farming systems.
Conceptual framework.
Note: Figure 1 presents a conceptual framework to study farmers’ FWB. The first figure shows the relationships of the determinants in macro, meso, and micro levels, and illustrates how they ultimately impact the core of the framework: farmers’ FWB. The second figure illustrates the 16 dimensions to measure farmers’ FWB. In the household-subjective category, we have four dimensions: (1) household short-term needs (HSN), (2) household short-term wants (HSW), (3) household long-term needs (HLN), and (4) household long-term wants (HLW). In the farm-subjective category, there are four dimensions: (1) farm short-term needs (FSN), (2) farm short-term wants (FSW), (3) farm long-term needs (FLN), and (4) farm long-term wants (FLW). In the farm-objective category, we have five dimensions: (1) farm solvency (FS), (2) farm liquidity (FL), (3) farm profitability (FP), (4) farm repayment and replacement capacity (FRRC), and (5) farm financial efficiency (FFE). Finally, in the household-objective category, we have the following three dimensions: (1) household solvency (HS), (2) household liquidity (HL), and (3) household investment (HI).

Designing a questionnaire based on our framework
Another key contribution of this study is the design of an integrated survey to measure farmers’ subjective FWB. As noted earlier, while financial ratios are well-established and widely used to assess objective FWB, there are few tools available for evaluating farmers’ subjective FWB. For each of the 8 objective dimensions and 8 subjective dimensions, we propose at least one question or ratio to measure the corresponding aspect. We suggest that researchers applying this framework include all 16 dimensions and choose at least one question or ratio to measure each dimension.
During the survey design and evaluation, we refer to the procedures proposed by Boateng et al. (Reference Boateng, Neilands, Frongillo, Melgar-Quiñonez and Young2018); Gehlbach and Brinkworth (Reference Gehlbach and Brinkworth2011); and Kaplowitz et al. (Reference Kaplowitz, Lupi and Hoehn2004). We first listed all the related survey questions used in the literature we reviewed. Then we chose and modified some of the questions to best fit our research purposes. To fully implement our framework, we also innovatively developed additional questions, particularly for the farm-subjective FWB dimensions, where existing literature is limited. After finishing the survey draft, we invite experts to evaluate and validate the survey. These experts include professors, farm business extension educators, and researchers in research institutions. We then follow the protocols provided by Beatty and Willis (Reference Beatty and Willis2007); Boateng et al. (Reference Boateng, Neilands, Frongillo, Melgar-Quiñonez and Young2018); and Fowler (Reference Fowler1995) to conduct 2 rounds of cognitive interviews with some of our experts and 3 more ranchers. Finally, we sent the survey to 31 ranches for pilot testing. The pilot testing results suggest content validity and reliable item/scale development of our survey.
Besides the testing and piloting procedures, we also applied two post-survey verification methods, i.e., Cronbach’s alpha and Factor analysis, to further validate the construction of our survey. The data used are collected from the application discussed in Section “Application: Subjective FWB of U.S. Cattle Producers,” and the detailed illustration and results of these two methods are provided in Appendix B. Generally, the results of Cronbach’s alpha indicate that the survey questions under the same dimension are consistent with each other, and the dimensions under the same category (e.g., dimensions of HSN, HSW, HLN, HLW under the category Household-subjective category) also show great internal consistency and reliability. The factor analysis confirms that our dimensions underlying the same category are measuring similar factors, while dimensions under different categories can uniquely measure different factors. These two confirmations support the validity and reliability of our survey questions and structures.
We also suggest that researchers pay further attention to the following three points in constructing their own questionnaires. First, researchers should try to elicit the farmers’ goals for their farm operations and their lives, especially their financial goals. Because of the difference in financial goals, two farmers with similar financial situations might have significantly different perceptions of well-being. Second, researchers could try to look into farmers’ self-consumption levels because they might impact FWB. For example, a farmer with a higher self-consumption level may be less affected by the risks of price fluctuation and food insecurity. Further, consuming the food they produce could make them less concerned about food safety issues and strengthen their emotional bond with their farm. Finally, own-consumption behaviors may significantly reduce transaction costs, such as fuel and time spent traveling to food stores. Finally, in an ideal circumstance, the importance of every measure and dimension to the farmers should be surveyed. In Equation (1) of Section “A Conceptual Framework for Farmers’ FWB,” we provide a weighted average method to aggregate the scores of measures into scores of dimensions. The weights depend on both the study purpose of researchers and the measures’ significance to farmers.
Application: subjective FWB of U.S. Cattle producers
To empirically apply our framework and the subjective FWB questions, we distributed our survey to U.S. cattle producers. From January to April 2023, we sent out recruitment messages to target pasture-based beef producers in Michigan, Oklahoma, Texas, Wyoming, and Colorado through our research teams’ networks, such as University listservs, Noble Research Institute, and State Cattleman’s Associations, and we got about 300 ranchesFootnote 7 that were willing to participate. We then kept ranches that maintained at least a grass-fed cow-calf enterprise, had sold a minimum of 10 cattle in the previous year, and had a minimum of 5 years of experience as a farm/ranch owner, operator, or manager. After further considering their variation in terms of grazing experiences and practices, ranch sizes, locations, demographics, etc., we selected 88 cattle ranches and sent them the subjective FWB survey during May to June 2023 and during April to September 2024. We received 178 valid questionnaires (95 in 2023 and 83 in 2024) from 100 ranchers, distributed across 84 households, and these 84 households are from the 70 ranches that responded. There are some ranches that correspond to multiple households, and some households with multiple individuals filling out the survey, so we observe a higher number of individual responses than the number of ranches. Although we share 37 participating farms with Vivas and Hodbod (Reference Vivas and Hodbod2024) and 58 farms with Smith et al. (Reference Smith, Gordon, Gosnell and Hodbod2025), this study distinguishes itself in several key aspects. First, the aim of our study is different. Vivas and Hodbod (Reference Vivas and Hodbod2024) focus on exploring how regenerative grazing affects ranchers’ perceived social well-being, and Smith et al. (Reference Smith, Gordon, Gosnell and Hodbod2025) analyze how ranchers monitor their grassland and how informal monitoring methods can be more feasible, efficient, and helpful. Instead, our work aims to study ranches’ health and ranchers’ well-being from a financial perspective, taking ranchers’ subjective perceptions and objective financial records into consideration. Finally, our work includes the ranchers’ demographics to analyze their impact on FWB.
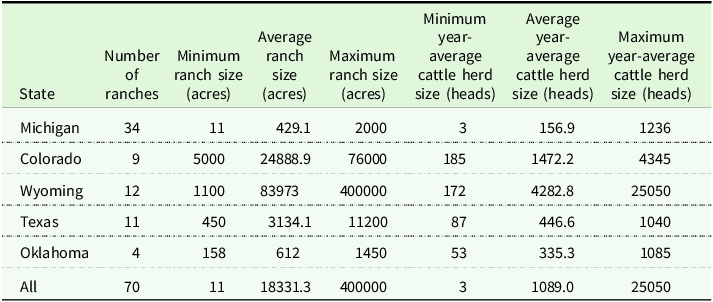
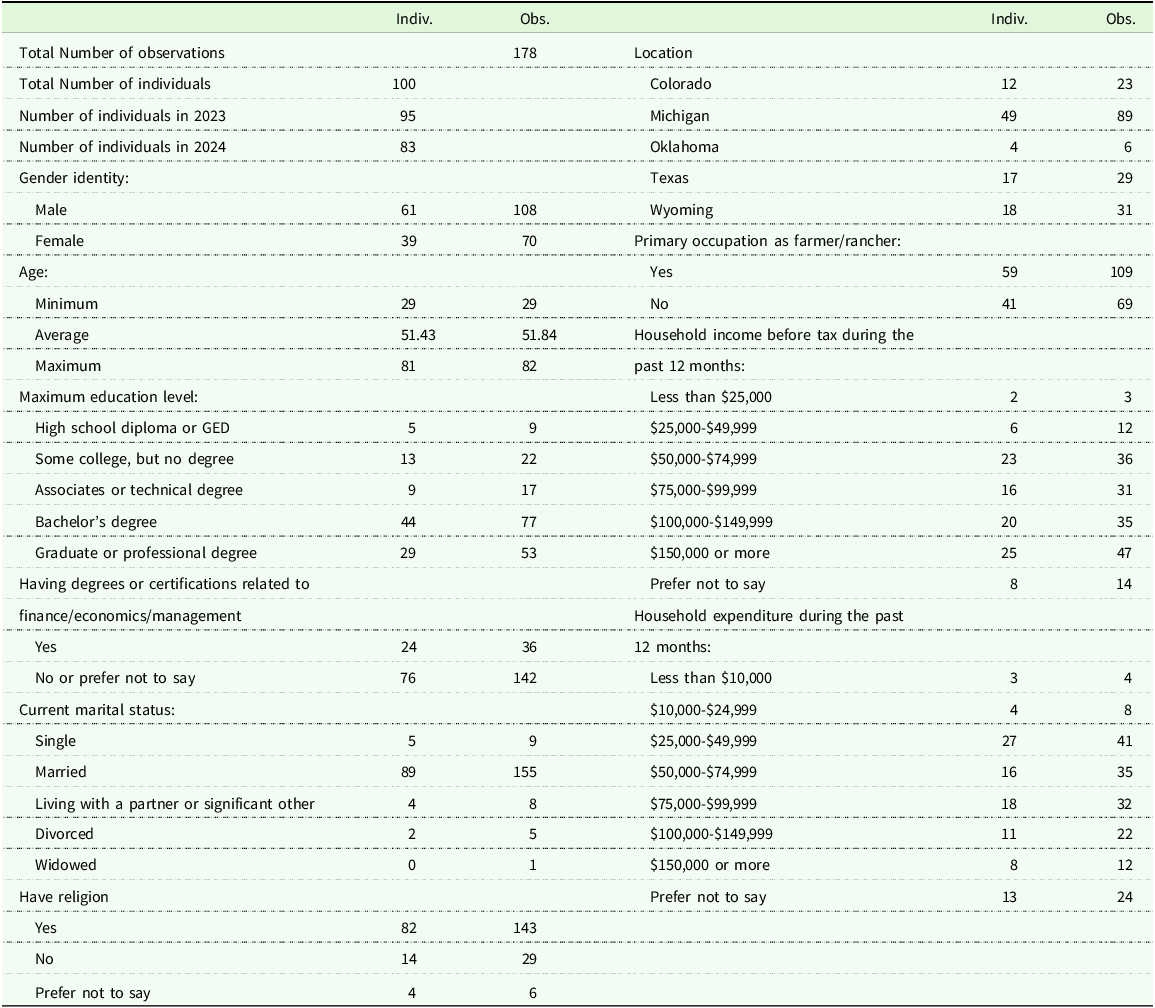
We provide the summary statistics for the 70 ranches in Table 3. These 70 ranches have ranch sizes from 11 acres to 400,000 acres, with an average of 18,331 acres. Their year-average cattle herd size ranged from 3 head to 25,050 head, with an average of 1,089 head. Generally, ranches in Wyoming have the largest land size and herd size, while those in Michigan have the smallest. We provide the descriptive statistics for the 100 individualsFootnote 8 and the 178 observations in Table 4. Overall, most respondents are male, and their ages range from 29 to 81, with an average of about 51.
Summary statistics for ranches

Table 3. Long description
A table comparing ranch statistics across different states. The table has 7 rows and 8 columns. The columns are State, Number of ranches, Minimum ranch size (acres), Average ranch size (acres), Maximum ranch size (acres), Minimum year-average cattle herd size (heads), Average year-average cattle herd size (heads), and Maximum year-average cattle herd size (heads). The states listed are Michigan, Colorado, Wyoming, Texas, Oklahoma, and All. Row 1: State, Michigan; Number of ranches, 34; Minimum ranch size (acres), 11; Average ranch size (acres), 429.1; Maximum ranch size (acres), 2000; Minimum year-average cattle herd size (heads), 3; Average year-average cattle herd size (heads), 156.9; Maximum year-average cattle herd size (heads), 1236. Row 2: State, Colorado; Number of ranches, 9; Minimum ranch size (acres), 5000; Average ranch size (acres), 24888.9; Maximum ranch size (acres), 76000; Minimum year-average cattle herd size (heads), 185; Average year-average cattle herd size (heads), 1472.2; Maximum year-average cattle herd size (heads), 4345. Row 3: State, Wyoming; Number of ranches, 12; Minimum ranch size (acres), 1100; Average ranch size (acres), 83973; Maximum ranch size (acres), 400000; Minimum year-average cattle herd size (heads), 172; Average year-average cattle herd size (heads), 4282.8; Maximum year-average cattle herd size (heads), 25050. Row 4: State, Texas; Number of ranches, 11; Minimum ranch size (acres), 450; Average ranch size (acres), 3134.1; Maximum ranch size (acres), 11200; Minimum year-average cattle herd size (heads), 87; Average year-average cattle herd size (heads), 446.6; Maximum year-average cattle herd size (heads), 1040. Row 5: State, Oklahoma; Number of ranches, 4; Minimum ranch size (acres), 158; Average ranch size (acres), 612; Maximum ranch size (acres), 1450; Minimum year-average cattle herd size (heads), 53; Average year-average cattle herd size (heads), 335.3; Maximum year-average cattle herd size (heads), 1085. Row 6: State, All; Number of ranches, 70; Minimum ranch size (acres), 11; Average ranch size (acres), 18331.3; Maximum ranch size (acres), 400000; Minimum year-average cattle herd size (heads), 3; Average year-average cattle herd size (heads), 1089.0; Maximum year-average cattle herd size (heads), 25050.
Descriptive statistics for individuals and observations

Table 4. Long description
The table presents descriptive statistics for 100 individuals and 178 observations. It includes data on location, number of individuals and observations, gender, age, household income, education level, primary occupation, current marital status, and religion. The table is organized into several categories with corresponding values. For example, the location category lists states like Colorado, Michigan, Oklahoma, Texas, and Wyoming with their respective number of individuals and observations. The gender category shows counts for male and female individuals. Age is categorized into different ranges with corresponding counts. Household income is listed with various ranges and counts. Education level includes categories like high school, some college, associate’s degree, bachelor’s degree, and graduate or professional degree with respective counts. Primary occupation as farmer/rancher is indicated with yes or no and counts. Current marital status includes categories like single, married, living with a partner, divorced, and widowed with respective counts. Religion is categorized into yes, no, and prefer not to say with respective counts.
Note: From 2023 to 2024, we collected a total of 178 valid questionnaires from 100 unique respondents. Of these, 78 individuals completed the survey in both 2023 and 2024, while 22 individuals completed it only once (either in 2023 or 2024). Accordingly, we report descriptive statistics for both the 100 individuals and the 178 total observations. When presenting the demographics of the 100 individuals, we exclude the 2024 responses of the 78 repeat respondents to avoid double-counting. Because demographic characteristics such as gender and religion are typically time-invariant, the individual-level descriptive statistics (N = 100) provide more accurate demographics. The reported descriptive statistics of the 178 total observations are presented to provide supplementary information for the following panel data regressions.
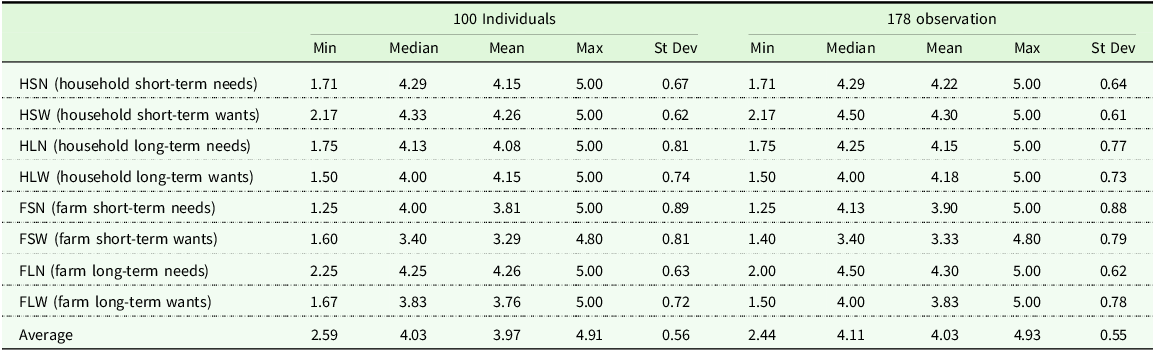
Summary statistics for the 8 subjective FWB dimensions for both the 100 individuals and the total 178 observations are shown in Table 5.Footnote 9 For the 178 observations, the subjective FWB score averages 4.03 and ranges from 2.44 to 4.93. Notice that in our framework, the theoretical range of FWB score is from 1 to 5, where score 1 means the worst FWB feeling and 5 means the best. Thus, this 4.03 average FWB score shows these ranchers “somewhat agree” that they are in good financial situations. When we focus on these 8 dimensions, we can observe that they feel best in the HSWs and farm long-term needs dimensions, with an average of 4.30, and they feel worst in the farm short-term wants dimension, with an average of 3.33. Interestingly, their average household subjective FWB score, which is 4.21,Footnote 10 is larger than the average farm subjective FWB score, which is only 3.84.Footnote 11 We believe one crucial reason leading to higher household FWB perceptions is their off-farm income, and this situation is more frequently observed in smaller ranches. Ranchers with smaller ranches usually have more spare time and are more likely to have an off-farm job to support the household (for some small ranchers, they even report their major occupation as non-farm), thus their household financial situation could be better than that of the farm. Another interesting point we find is that belief about the farm’s future financial situation is better than their perceptions of the current farm’s financial situation. The average farm short-term perception score is 3.62,Footnote 12 and the average farm long-term score is 4.07.Footnote 13 Despite their native positive expectations about the future, we believe one reason could be that the drought in 2022 resulted in more financial stress in the short run.Footnote 14
Summary statistics of subjective FWB scores

Table 5. Long description
The table presents summary statistics for 8 subjective FWB dimensions across 100 individuals and 178 observations. It includes minimum, median, mean, maximum, and standard deviation values for each dimension. The dimensions are household short-term needs, household short-term wants, household long-term needs, household long-term wants, farm short-term needs, farm short-term wants, farm long-term needs, and farm long-term wants. The table shows that the average FWB score for 178 observations is 4.03, ranging from 2.44 to 4.93. The highest average scores are observed in household short-term wants and farm long-term needs, both at 4.30, while the lowest average score is in farm short-term wants at 3.33. The average household subjective FWB score is 4.21, higher than the average farm subjective FWB score of 3.84. The table also indicates that the average farm short-term perception score is 3.62, while the average farm long-term score is 4.07.
To further explore the potential determinants of their subjective FWB, we estimate the following regression model to test the relationship between respondents’ characteristics and their subjective FWB:
 \begin{align}y_{it}= & \alpha +\beta _{1}{Herdsize}_{\it it}+\beta _{2}{Landsize}_{\it it}+\beta _{3}Age_{\it it}+\beta _{4}{Gender}_{\it it}+\beta _{5}Econ\_ {degree}_{\it it} \\ &+\beta _{6}{Occupation}_{\it it}+\beta _{7}{Marriage}_{\it it}+\beta _{8}{Education}_{\it it}+\beta _{9}{Religion}_{\it it}+{\bf \beta}_{10}{\bf State}_{\it it} \\ &+{\bf \beta}_{11}{\bf Income}_{\it it}+{\bf \beta}_{12}{\bf Expenditure}_{\it it}+\varepsilon _{\it it}\end{align}
where y it is the subjective FWB scores of the respondent i at time t, and we use the household subjective FWB scores, farm subjective FWB scores, and overall subjective FWB scores to run the regression separately for each. Herdsize it and Landsize it are the ranch’s year-average cattle number in 100 heads and land size in 100 acres. Age it is the respondent’s age, and Gender it is a dummy variable that indicates the self-reported gender identity. Econ_degree it is a dummy variable indicating if the respondent has degrees or certifications related to finance/economics/management. Occupation it is a dummy variable indicating if they consider their primary occupation as a farmer/rancher. Marriage it is a dummy variable indicating their marital status, Marriage it = 1 for those married or living with a partner or significant other, Marriage it = 0 for those single, widowed or divorced. Education it is a continuous variable that indicates their education level in years.Footnote 15 Then State it , Income it , and Expenditure it are vectors each contains several variables indicating the respondent’s characteristics of the state they are located, household income,Footnote 16 and expenditure.Footnote 17 The details of these characteristics can be found in Tables 4 and 5.
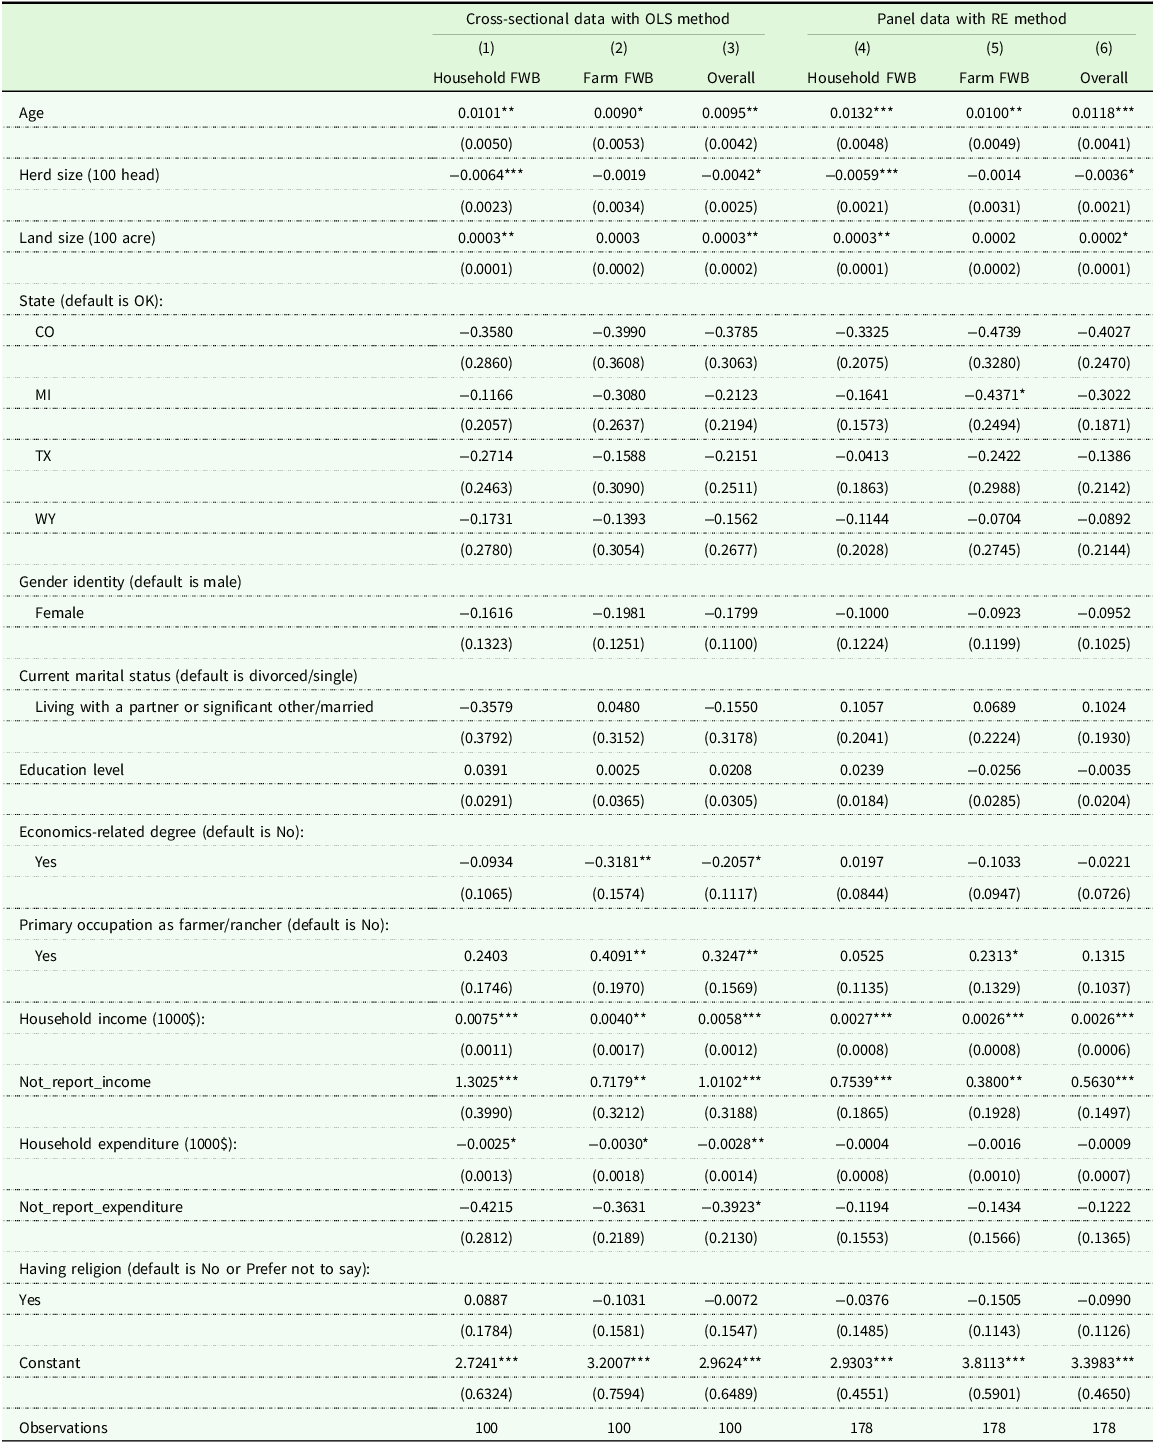
As noted above, some ranchers completed the survey in 2023 and then participated in follow-up surveys in 2024, providing updated financial information and FWB measures. Thus, our analytical dataset is a two-year unbalanced panel comprising 178 observations. For robustness, we first remove duplicate responses from the same ranchers (retaining only their 2023 responses) and treat the resulting dataset as cross-sectional with 100 observations, thereby avoiding potential bias arising from repeated responses. We use OLS regression to examine the effects of farmers’ characteristics on household FWB, farm FWB, and overall FWB. Because some respondents are from the same ranches, these observations may not be independent. Therefore, we report clustered standard errors at the ranch level, allowing for intragroup correlation and relaxing the usual assumption of independence across observations. The corresponding results are reported in Columns (1) – (3) of Table 6. The estimates suggest that ranchers’ age, herd size, land size, economics-related degree, primary occupation, income, and expenditure have statistically significant effects on their FWB.
Although these ranchers’ demographic characteristics changed little between 2023 and 2024, their subjective perceptions usually varied over the two years. Therefore, removing repeated responses would eliminate potentially meaningful dynamics and reduce the effective sample size. Accordingly, we also conduct the analysis using the full 178-observation panel dataset. Although fixed-effects (FE) and first-difference (FD) estimations are more commonly used in panel data analysis than the random-effects (RE) estimation – since they allow individual effects to be correlated with the explanatory variables – FE or FD estimations yield imprecise estimates when key variables exhibit little within-unit variation over time (Wooldridge Reference Wooldridge2010). In our case, because respondents’ demographic characteristics change very little over time, the RE estimation is more suitable than FE or FD. Thus, we report the regression results using the RE estimation in Columns (4) – (6) of Table 6. Still, to address potential serial correlation arising from repeated observations of the same individuals, as well as the presence of multiple individuals from the same ranch, we again report estimates clustered at the ranch level to account for both within-individual and within-ranch correlations. These estimates provide statistically significant evidence that characteristics such as age, herd size, land size, location, and household income affect ranchers’ perceptions of FWB. The results are highly consistent with those obtained from the cross-sectional dataset.
Specifically, based on the cross-sectional regression results, we observe that if the respondent is 1 year older, the household, farm, and overall FWB scores increase by about 0.01 (about a 0.28% increase), which means older people feel better about their financial situation. If the land size they manage increases by 1000 acres, their household and overall subjective FWB scores will increase by 0.003 (about a 0.074% increase). Another interesting counterintuitive finding is the negative relationship between herd size and household FWB. One reason could be that the ranch households with fewer cattle usually have more off-farm income to support the household finances. Furthermore, we find that if a respondent has a degree related to finance/economics/management, they report significantly worse about their farm and overall FWB, but we don’t observe similar differences for their household FWB. A positive relationship between household annual income and the subjective FWB is observed, which accords with our intuition. As for the household annual expenditure, a negative relationship is observed, which means the more expenditure pressure they have, the worse they feel. We also observe that the ranchers located in Michigan have relatively lower farm subjective FWB.
We further provide two sets of robustness checks with alternative specifications in Table A.4 and Table A.5. First, considering that the subjective FWB scores range from 1 to 5, a Tobit method with left-and right-censoring limits may be more appropriate. Columns (1) – (3) of Table A.4 report the corresponding results. The Tobit estimates are highly consistent with our baseline results, likely because the FWB scores rarely approach the boundaries of the scale.
Second, to complement our primary random effects (RE) approach, Columns (4) through (6) of Table A.4 report regression results from a pooled OLS method – the foundational baseline for panel data. The estimates remain highly consistent with our baseline findings, confirming the robustness of our results.
Third, although clustering estimates at the ranch level can partially address both within-individual and within-ranch correlations, this approach may not be able to provide full adjustment for within-individual dependence. Thus, we further report the results clustered at the individual level with pooled OLS and RE approaches in Table A.5. The estimates remain highly consistent with our baseline findings.
Although we don’t observe statistically significant evidence that gender, marital status, education level, or religion have impacts on people’s FWB perceptions from our regression, we can’t conclude that these factors are irrelevant. We believe our 2-year short panel and relatively small sample size of 178 observations limit further statistical findings. For example, this 2-year panel doesn’t allow us to use approaches like FE to control for unobserved factors, so endogeneity related to omitted variables could potentially undermine our results. Moreover, since our sample is only from cattle producers in 5 states in the U.S., we know less about farmers in other areas with different enterprises. Further studies are needed to explore the impacts of these potential determinants on a broader scale.
Application: combining objective and subjective FWB of U.S. Cattle producers
Unlike the long-neglected subjective FWB measures, objective financial measures are commonly used by economists or extension educators to value farms’ financial situations. The Farm Financial Standards Council (FFSC)Footnote 18 suggests that, to build a cogent farm financial report, four financial statements are required: the balance sheet, income statement, statement of cash flow, and statement of owner equity (FFSC, 2022). FFSC further proposed 13 financial ratios within five categories to measure farms’ financial situation. These five categories are liquidity, solvency, profitability, repayment and replacement capacity, and financial efficiency (FFSC, 2022). Many extension arms of universities accept these protocols and construct several Farm Financial ScorecardsFootnote 19 based on the measures and ratios FFSC recommends. Although the appearance of these scorecards varies, they usually have the same five categories and 13 ratiosFootnote 20 that FFSC recommended. For example, extension services of the University of Minnesota, the University of Vermont, Michigan State University, Ohio State University, and the University of Wisconsin-Madison are currently using or have used the Farm Financial Scorecard to do farm financial analyses. Since these ratios are well-developed and widely used, we also include these ratios in our framework to measure farm objective FWB; details of these 13 ratios can be found in Table 2.Footnote 21
For the household objective measures, we follow the suggested financial ratios used by Baek and DeVaney (Reference Baek and DeVaney2004). Specifically, they used liquidity ratio, debt-to-assets ratio, and investment ratio to measure household objective financial wellness. These ratios are also widely used in some other studies (Kim and Lyons Reference Kim and Lyons2008; Lyons and Yilmazer Reference Lyons and Yilmazer2005). The details of these ratios are shown in Table 2.
To parallel the scores that we proposed for subjective measures, we also value these objective measures with scores 1 to 5. These rules for assigning scores to the ranges of ratios are given in Column 3 of Table 2. Notice that these rules are based on previous studiesFootnote 22 but are modified according to the financial data we collected, so these range-to-score rules may not work for all farms in future studies. The economic background could vary over farms with different locations, enterprises, time periods, operating methods, etc., and these differences could change the evaluation criterion for financial health. Thus, we suggest that researchers adjust the range-to-score rules for objective ratios based on their empirical studies.
After transferring the financial ratios to the 1 to 5 scores, we average the scores within every dimension.Footnote 23 For example, there are Current Ratio and Working Capital as percentages of Gross Revenues within the FL dimension, so we first give scores to these two ratios separately based on the range-to-score rules, and then average them to calculate the general score for the FL dimension. This procedure yields one score for each objective dimension, which we combine with subjective scores to build the FWB measurement figure shown in our framework (see Panel (a) of Figure 1).
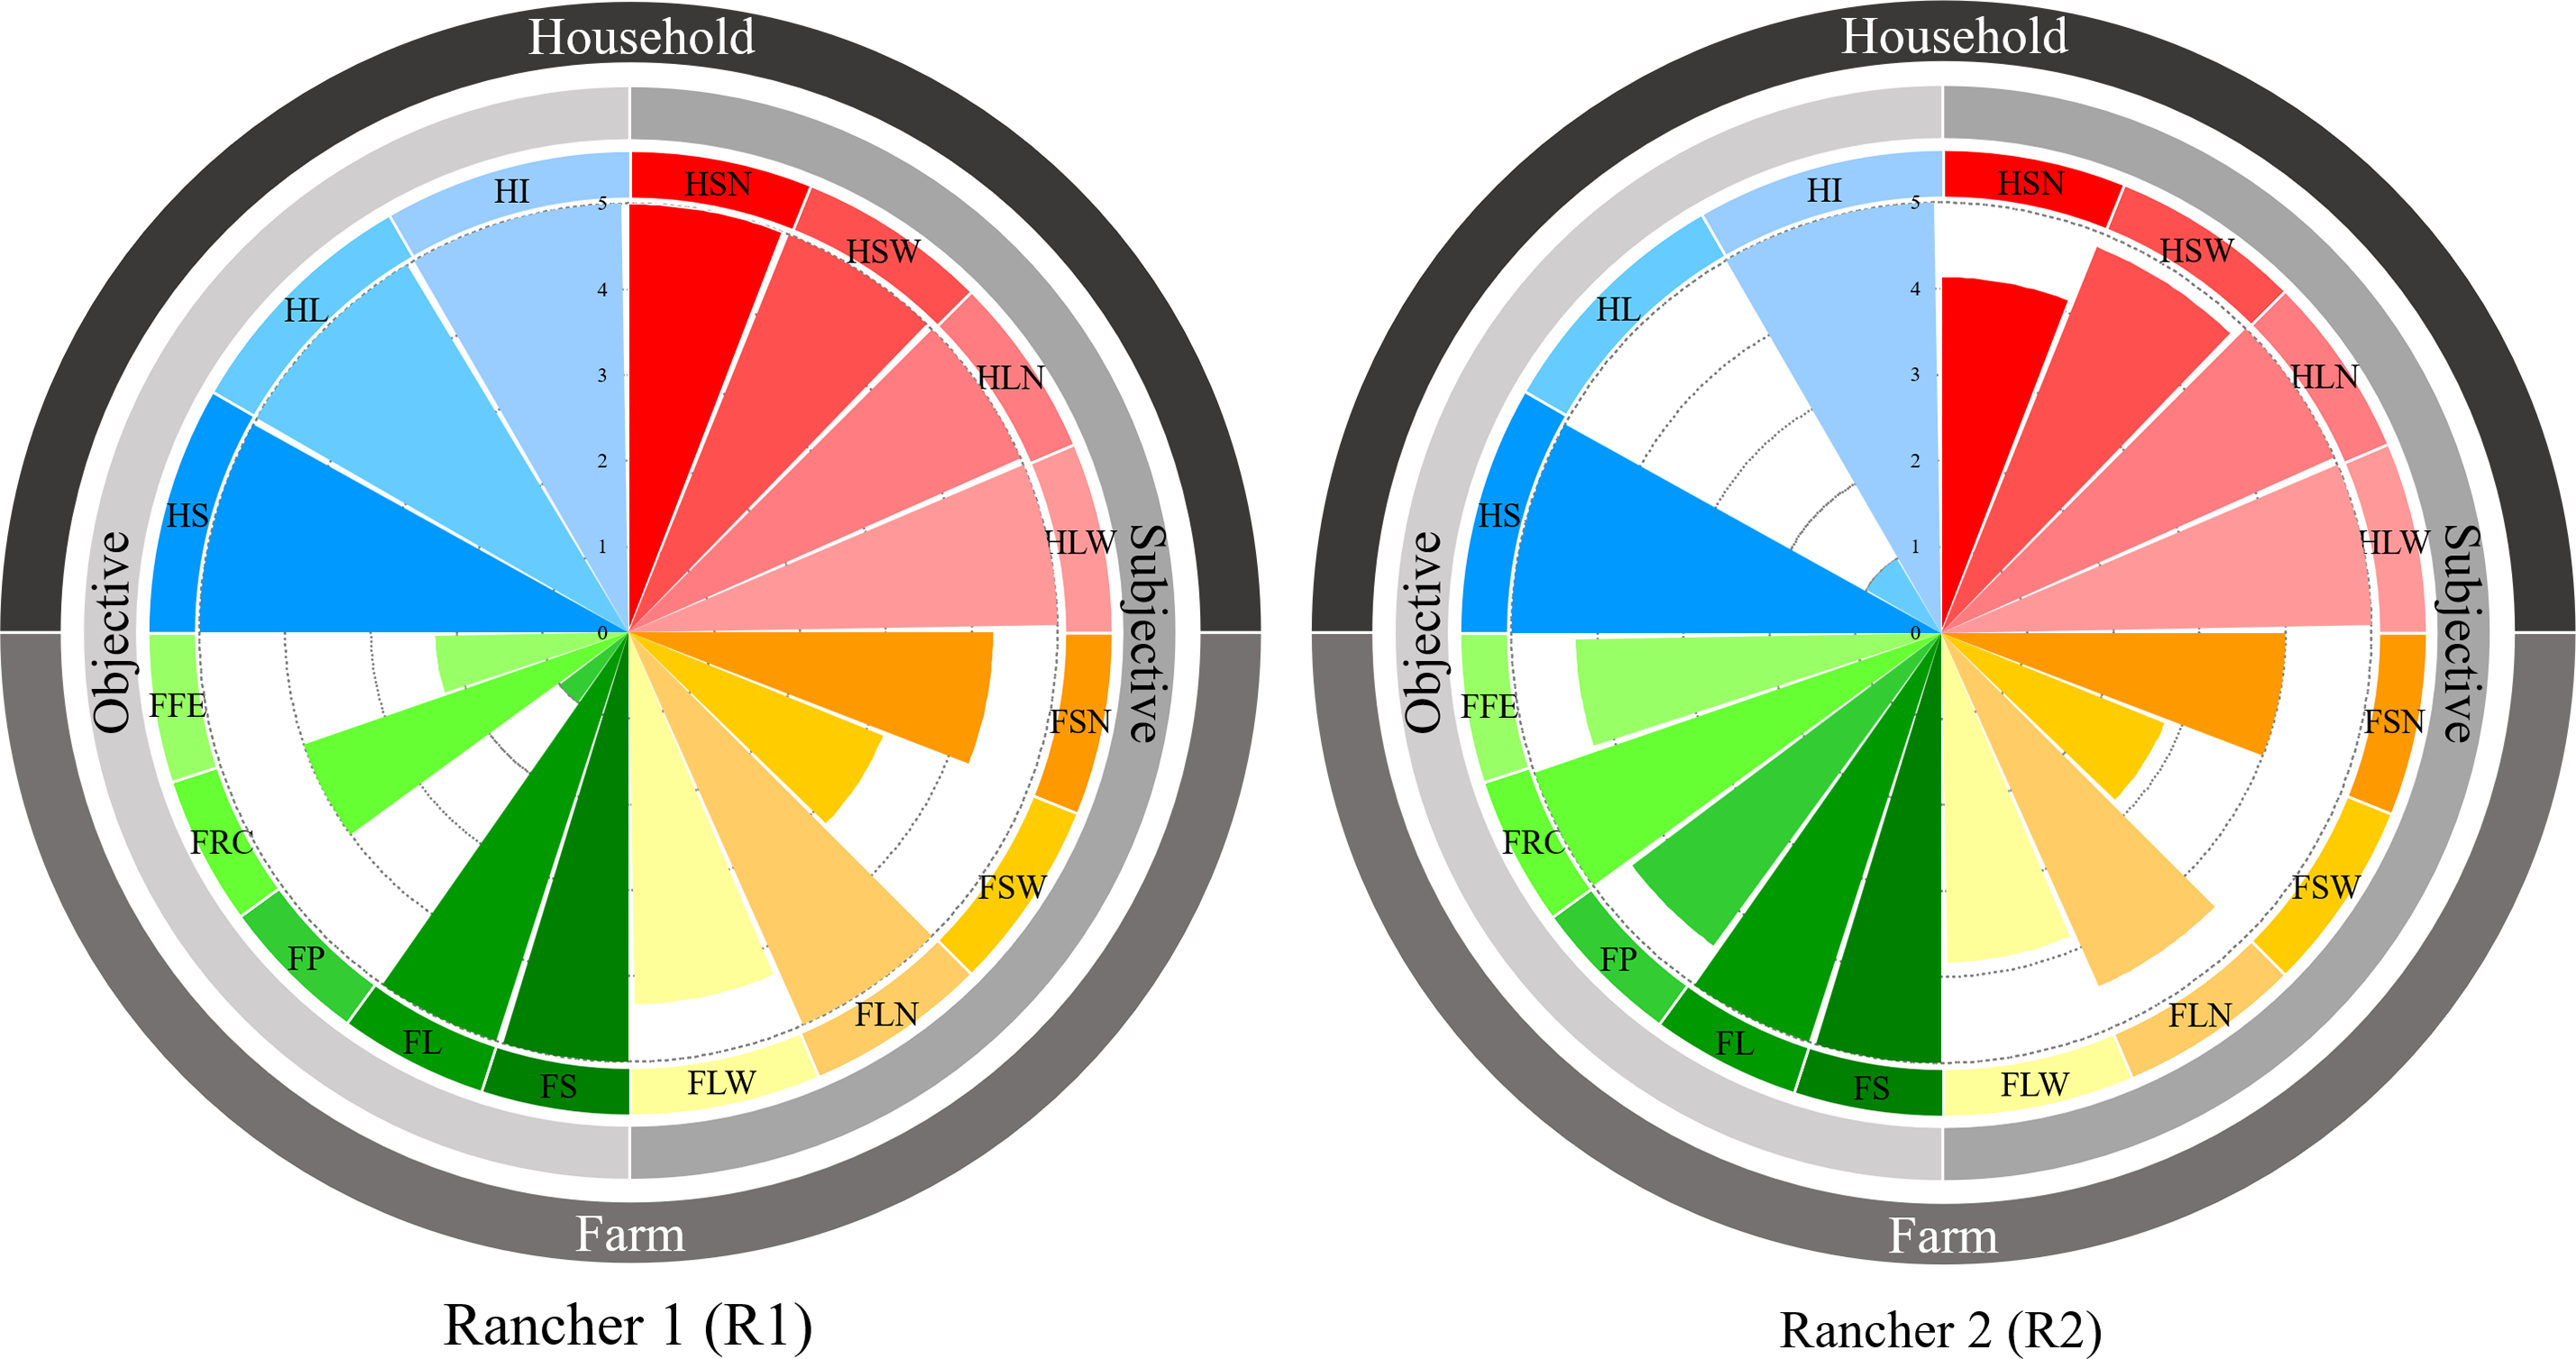
Through the FWB measurement figures, one can analyze farmers’ FWB in a comparable and visualized way without missing much vital information. To illustrate, we provide two ranchers in the U.S. as examples (see Figure 2). From June to August 2023, we visited and interviewed 53 ranches to collect ranchers’ 2022 financial records and help build their financial reports. These ranches correspond to the same group that filled out the subjective FWB surveys.Footnote 24
Examples of FWB measurements.

Figure 2 shows the FWB measurements of the two ranchers. The first rancher (hereinafter, R1) is located in Texas, managing 1,500 acres of land. It is primarily a cow-calf enterprise, and the average number of breeding cows kept in 2022 is about 190. The second rancher (hereinafter, R2) is located in Wyoming, operating 6,000 acres of land, and is also mainly a cow-calf enterprise. The 2022 average number of breeding cows they kept is about 500.
We can see the advantage of our framework by jointly analyzing these two ranchers. In the household-objective category, both R1 and R2 perform well in the HI and HS dimensions, but R2 is worse off in the HL dimension. This difference visually reveals that R2 has more liquidity pressure. This liquidity pressure is also reflected in their household-subjective category – R2 feels worse (than R1) in the HSNs and HSWs dimensions. In the farm-objective category, R2 performs equal to or better than R1 in all the dimensions. However, in the farm-subjective category, R2 feels worse in every dimension than R1. After looking into their detailed financial information, we believe two potential reasons lead to this difference. First, R2 only owns 15% of the ranch, and is not the primary decision maker and manager. On the contrary, R1 owns 25% and is the primary decision maker and manager. Thus, R1 can benefit more from the ranch and may have more accurate perceptions of the ranch’s finances. Second, R1 has about triple the household total assets and non-farm income compared to R2, but R1 has a smaller ranch. This means that R1 can provide more potential financial support to the ranch when needed, which may contribute to R1 feeling more positive about the ranch’s finances.
These two ranchers provide compelling evidence supporting the necessity of dividing households from farms, as well as distinguishing subjective aspects from objective aspects of FWB. Since each of these four categories (i.e., household-subjective, household-objective, farm-subjective, and farm-objective) can vary independently, one could have a biased assessment of FWB without distinguishing these four aspects.
For instance, if extension services rely solely on farm-objective measures, they would categorize R2 as a highly successful producer requiring minimal intervention, while identifying R1 as in need of support. However, our framework reveals a converse reality: R2, compared to R1, is at a higher risk for financial stress and potential exit from the industry. Despite operating a profitable farm, R2 suffers from worse HL issues and low subjective satisfaction, exacerbated by the fact that they own only a small portion of the ranch and thus benefit less from its success.
By recognizing this divergence, extension agents can improve from broad-based support to precision targeting. They could offer R2 specialized cash-flow management and succession counseling, while providing production advice to R1. Furthermore, policymakers can use these insights to design working capital assistance or liquidity-focused credit instruments specifically for producers like R2, who manage viable operations but face household-level fragility.
Finally, identifying this “subjective–objective gap” allows for a more efficient allocation of resources toward mental health and community support systems. For producers like R2 – who operate successful farms yet feel financially insecure – the most effective interventions may not be technical farming advice, but rather stress management programs and peer-to-peer networks designed to strengthen psychological and social resilience.
Conclusions and implications
This article contributes to the literature on farmers’ FWB, with a specific focus on developing a conceptual framework to measure FWB by distinguishing subjective and objective aspects, as well as separating household finance from farm finance. We review previous literature related to the basic theory of FWB and studies about farmers’ FWB. We identified gaps since previous studies usually ignore the subjective measures, along with ambiguities between household and farm finances. Thus, we construct a conceptual framework to help understand the determinants and measurements of farmers’ FWB. We categorize the determinants into micro, meso, and macro levels, as well as their impact on the household or farm aspects. For the measurements of FWB, we develop a visualization evaluation figure that measures the FWB through 16 dimensions within four categories, i.e., household-subjective category, household-objective category, farm-subjective category, and farm-objective category. Each dimension in the objective categories has one or several financial ratios to measure. Each dimension in the subjective categories has several perception questions to measure.
We then apply our framework to 100 ranchers in the U.S. Through the joint analysis of their subjective FWB and characteristics, we find individuals’ age, herd size, land size, location, economics-related degree, primary occupation as farmer, household income, and expenditure have statistically significant impacts on their FWB perceptions, but we fail to find significant impacts from gender, marital status, education level, or religion. In addition to the empirical analysis of their subjective aspects, we chose two ranchers’ objective scores to build our FWB measurement figures. This application provides instructions for using our framework and shows its advantages.
Our research has shown the close relationships among farmers’ perceptions, financial goals, and financial performances. Our work highlights the critical interactions and, more importantly, the functional distinctions between household and farm financial systems. Policy implications are many. Policymakers can transition from a universal, “one-size-fits-all” support toward precision-targeted strategies. By adopting this multidimensional lens, policymakers can deliver sophisticated bundles of government payments, financial aid, production subsidies, advanced techniques, community support programs, and credit services tailored to the different types of farmers. This ensures that resources are allocated efficiently and meet farmers’ expectations – for instance, providing liquidity or monetary support to farming-occupation farmers who feel stressed in either household or farm finances, while providing sustainable and environmentally friendly techniques to off-farm-occupation or retirement farms, as they usually maintain farming for pleasure instead of monetary gain. Extension agents can further leverage this framework to categorize producers by their specific needs, like succession planning, financial literacy, management education, mental health support, and different types of techniques.
Moreover, the framework serves as a powerful diagnostic tool for the farmers themselves; the subjective FWB survey encourages self-analysis, as evidenced by our respondents who noted that the inquiry prompted them to re-evaluate their financial standing, reorganize their management structures, and proactively plan for their financial futures. Ultimately, identifying the “subjective–objective” and “household-farm” gaps allows for a more holistic approach to agricultural resilience, supporting not only the business’s viability but also the producer’s quality of life and long-term industry sustainability.
Analysis Results

Table 6. Long description
A table with six columns and multiple rows comparing the effects of farmer characteristics on household FWB, farm FWB, and overall FWB using OLS and RE methods. The columns are labeled as Cross-sectional data with OLS method and Panel data with RE method, with sub-columns for Household FWB, Farm FWB, and Overall FWB. The rows include variables such as Age, Herd size, Land size, State, Gender identity, Current marital status, and Education level. Each row provides coefficients and standard errors for the respective variables. Notable trends include significant effects of age, herd size, and land size on FWB across different models.
Note: Standard errors are in parentheses, and the standard errors are clustered at the ranch level &p < 0.1, &&p < 0.05, &&&p < 0.01.
Supplementary material
The supplementary material for this article can be found at http://doi.org/10.1017/age.2026.10044.
Acknowledgments
We thank Jennifer Hodbod, Florencia Colella, Jonathan Vivas, Jose María Martínez, Dale Manning, Kable Thurlow, Jennifer Ifft, Adam J. Kantrovich, Nathan B. Smith, John Ritten, Corey Clark, Jonathan LaPorte, Stanley Moore, Roger Betz, Frank Wardynski, Vince Greiner, Kable Thurlow, Kayla Braggs, Morgan MathisonSlee, Matt Raven, and Micaela Branecky for providing valuable comments in constructing the survey, helping with distributing the survey, and project coordination.
Funding statement
This research is supported by (1) the USDA NIFA (award 2020-38640-31522 - H008917110 through NCSARE # LNC20-437), (2) the Foundation for Food and Agriculture Research (DSnew-0000000028), The Noble Research Institute, Greenacres Foundation, The Jones Family Foundation, and Butcherbox, and (3) MSU AgBioResearch. The content of this publication is solely the responsibility of the authors and does not necessarily represent the official views of our funders.
Competing interests
The authors declare none.
Declaration
The research was approved by the MSU Institutional Review Board. The data used in this research were collected through surveys and interviews. The raw data are not publicly available due to respondent confidentiality. During the preparation of this work, the authors did not use any generative artificial intelligence (AI) or AI-assisted technologies.


 Open access

