Milk is one of the most produced and valuable agricultural commodities worldwide. Among dairy animals, dairy cattle are by far the largest share of global milk production. The dairy cattle industry has made significant progress in milk production per cow over recent decades, largely due to advances in genetics, health, nutrition and management practices (Abdelhamed and Kamel, Reference Abd-El and Kamel2021). Therefore, it is crucial to identify factors that optimize the efficiency and productivity of dairy herds while prioritizing animal welfare, health and minimizing environmental impacts (Atzori et al., Reference Atzori, Valsecchi, Manca, Masoero, Cannas and Gallo2021). Herd profitability can be enhanced through higher herd size and the adoption of innovative technologies. Effective management systems that use new technologies are often linked to improved production outcomes. Production levels are closely associated with various management factors (Oleggini et al., Reference Oleggini, Ely and Smith2001; Lugão et al., Reference Lugão, Volsi, Costa, Almeida and Telles2018). In addition, cow fertility plays a vital role in both productivity and profitability within dairy farms (Krpalkova et al., Reference Krpalkova, Cabrera, Kvapilik and Burdych2016). Milk prices significantly affect dairy farm profitability. For instance, in India, a 1% increase in milk prices corresponds to over an 8% increase in profits from milk sales, whereas a 1% increase in labour costs can reduce profits by 1.8% (Popescu, Reference Popescu2014). Overall, the profitability of a dairy farm is primarily determined by milk income and feed costs (Hultgren et al., Reference Hultgren, Svensson and Pehrsson2011). Approximately 95% of the variation in cost and revenue variances over a cow's lifetime stem from these two factors (Strandberg, Reference Strandberg1992). Therefore, higher profitability can be achieved by either boosting milk production or reducing feed costs or both (Hultgren et al., Reference Hultgren, Svensson and Pehrsson2011). Milk income accounts for about 78% of total farm returns and is influenced by factors such as milk yield, milk composition (fat, protein, lactose) and milk quality metrics (somatic cell count, total bacterial count and milk temperature) (Sadeghi Sefidmazgi et al., Reference Sadeghi Sefidmazgi, ZareBidaki, Shirvani and Boroujeni2017; Bal-Prylypko et al., Reference Bal-Prylypko, Berezina, Stepasyuk, Cherednichenko and Lialyk2024). Conversely, feed costs contribute to 60–70% of total milk production expenses (Buza et al., Reference Buza, Holden, White and Ishler2014a; Hatew et al., Reference Hatew, Jones and Mekuriaw2023). The complexity and dynamism of the dairy cattle industry – driven by continuous fluctuations in feed and milk prices, variations in management systems and ever-changing economic and environmental conditions – make it challenging to accurately determine cost structures and profit margins (Milić et al., Reference Milić, Novaković, Tekić, Matkovski, Đokić and Zekic2023). As such, economic performance and productive efficiency are often evaluated using benchmark indicators related to the marginal profit of inputs per unit of output (Connor, Reference Connor2015). Moreover, this industry requires precise monitoring and evaluation to guarantee and hold the sustainable profitability of the entire system. Researchers have proposed several milk-related economic indicators for synthetic evaluation of an individual cow or a dairy farm's performance. The main economic indicators related to milk efficiency are the income over feed cost (IOFC), the milk-to-feed price ratio (MFPR), the income equal to feed cost (IEFC) and the money-corrected milk (MCM). Since milk income and feed cost are the main source of variability in dairy farm profitability, the IOFC is the key index for evaluation of profit margins, as it takes into account the volatility of both milk and feed prices. The IOFC is the measure of what remains of the milk income after subtracting the feed cost of the lactating cows per cow per day (Buza et al., Reference Buza, Holden, White and Ishler2014a). The MFPR is the value of 1 unit of milk compared with the cost of 1 unit feed (Wolf, Reference Wolf2010). The amount of milk required to cover a cow's feed cost is represented by the IEFC index, which is calculated as the daily feed cost per lactating cow divided by the standard milk price per kilogram. This index is expressed as kilograms of milk per day per cow (Atzori et al., Reference Atzori, Valsecchi, Manca, Masoero, Cannas and Gallo2021). The MCM is another metric index to evaluate the cow's productivity based on the actual value of her milk less costs and their affective factors are milk fat, milk protein, adding in any quality premiums and subtracting out the cost of hauling, advertising and any other costs. MCM is measured in kilogram of milk per cow per day (Bethard, Reference Bethard2012).
Estimating farm profitability requires extensive data – including fuel, labour, veterinary services, culling and calf sales – which are often unavailable, particularly in developing countries such as Iran. Technical-economic indices (IOFC, MFPR, IEFC, MCM) offer a practical tool for assessing herd productivity and supporting short-term decision-making. Despite their potential usefulness, these indicators have not yet been evaluated in Iranian dairy farms, even though such assessments could offer valuable insights into financial sustainability under Iran's economic fluctuations and high inflation. The aim of present study was to investigate technical-economic indicators as profitability indices, with a specific focus on how quality bonuses applied on milk prices affect the productivity and profitability of Iranian Holstein dairy cows.
Materials and methods
Study area
The study was conducted in Isfahan province, with an area of approximately 107,045 km2 and situated in the central region of Iran. The province is located between latitudes 30°42′ N and 34°27′ N, and longitudes 49°38′ E to 55°32′ E. The average annual rainfall in Isfahan is around 130 mm, with an average temperature of 16°C (Jafari and Bakhshandehmehr, Reference Jafari and Bakhshandehmehr2016). Isfahan is geographically diverse and exhibits a variety of climates: the eastern and northeastern areas experience hot and dry conditions, while the northern and central regions are classified as semi-arid. Conversely, the western and southwestern parts enjoy a more moderate climate. Therefore, it can be claimed that Isfahan province is an example and indicator of Iran's climatic diversity. In addition, this province is an important dairy production hub in the country, accounting for approximately 25% of Iran's total milk production.
Data description
This study utilized two datasets. The first dataset comprises 2,890,994 test day records from 190,900 cows across 93 Holstein dairy herds, collected by the Vahdat Industrial Agriculturists & Dairymen Cooperative in Isfahan. The data spans the agricultural years from 2016 to 2022 and includes daily production metrics such as milk yield, milk fat and protein percentages, and somatic cell scores. The second dataset contains economic information from five selected dairy herds, detailing monthly milk prices, bonuses and feed costs.
Feed rations
Based on the daily milk yield levels of dairy cows – categorized as low, medium and high – three distinct feed rations were developed. Each ration was analysed individually using CNCPS software to estimate energy and protein content based on dry matter intake (DMI). The chemical composition of these diets is summarized in Table 1.
Chemical composition of different diets fed to dairy cows based on cows’ production level

Table 1 Long description
The table compares milk output and diet composition for dairy cows grouped as low, medium, or high production. Average milk yield rises from 24.1 kg per cow per day in the low group to 35.5 in the medium group and 48.7 in the high group, with ranges of 5 to 29.9, 30 to 40, and 40.1 to 70. Dry matter intake increases with production from 19 to 23.1 to 26.4 kg per day. Diet energy density also increases, with net energy of lactation from 1.41 to 1.52 to 1.57 Mcal per kg dry matter and metabolizable energy from 2.19 to 2.36 to 2.44. Protein measures rise with production: crude protein is 12.9, 15.1, and 15.6 percent of dry matter, and metabolizable protein is 1817, 2464, and 2880 g per day. Fibre declines as production increases, with neutral detergent fibre dropping from 40.9 to 33.3 to 30.9 percent of intake, while non-fibre carbohydrates increase from 37 to 41 percent and then remain at 41 percent. Rumen undegradable and degradable protein proportions are nearly constant at about 41 to 42 percent and 58 to 59 percent, total fat rises from 2.8 to 3 to 4 percent of dry matter, and calcium and phosphorus are similar across groups with a slight decrease in phosphorus at high production. Values describe formulated diet composition by production group and do not by themselves establish cause and effect.
Notes: aAF, as feed; bNEL, net energy of lactation; cME, metabolizable energy; dCP, crude protein; eMP, metabolizable protein; fRUP, rumen undegradable protein; gRDP, rumen degradable protein; hNDF, neutral detergent fibre; iNFC, non-fibre carbohydrates.
Adjustment for inflation
To account for the high level of inflation when comparing estimated financial indicators (such as feed cost, milk income, IOFC and MFPR) over the study period, a discounted metric (DM) was calculated using an annual discount rate (r) as follows:
 \begin{equation*}D{M_i} = {M_i} \times {(1 + r)^{t - i}}\end{equation*}
where Mi represents the calculated metrics in year i and t denotes the base year, which was set as 2022. An average annual discount rate of 19% (ranging from 18% to 20%), which represents the true interest cost in Iran during the period 2016–2022, was applied in the calculations (CBI, 2022). The currency used in Iran is the Rial (IRR); however, all costs and prices were converted and expressed in US dollars (USD) using an exchange rate of 1 USD = 285,000 IRR for the base year 2022.
Energy and protein prices
In this study, the feed cost components analysed included the costs associated with net energy of lactation (NEL) and crude protein (CP). To determine these costs, least squares equations were employed to calculate the costs per MCal of NEL (CNEL) and per gram of CP (CCP) as:
 \begin{equation*}{\boldsymbol{X'X\beta = X'y}} \to {\boldsymbol{\beta = (X'X}}{{\boldsymbol{)}}^{{\boldsymbol{ - 1}}}}{\boldsymbol{X'y = }}\left( {\begin{array}{*{20}{c}}
{{{\boldsymbol{C}}_{{\boldsymbol{NEL}}}}} \\
{{{\boldsymbol{C}}_{{\boldsymbol{CP}}}}}
\end{array}} \right)\end{equation*}
In this context, X′ represents the transpose of X, which is an incidence matrix comprising N rows (each corresponding to a feedstuff used in the ration) and two columns (NEL and CP per kilogram of dry matter for each feed). The vector β is the unknown unit costs for NEL and CP, while y is a vector of the corresponding feed prices expressed per kilogram of dry matter (Sadeghi-Sefidmazgi et al., Reference Sadeghi-Sefidmazgi, Moradi-Shahrbabak, Nejati-Javaremi, Miraei-Ashtiani and Amer2012).
Milk price
In Iran, the official milk price is determined using the percentage differential pricing (PDP) method. In this system, milk with a fat content of 3.2% and a protein content of 3% is set as the standard for base-point pricing. Deviations of 0.1% in milk fat or protein content result in corresponding rewards or penalties (Sadeghi Sefidmazgi et al., Reference Sadeghi Sefidmazgi, ZareBidaki, Shirvani and Boroujeni2017). Many local raw-milk consumers in Iran purchase milk primarily based on volume, often disregarding quality bonuses. As a result, this research used two pricing systems to calculate economic indices: the first was based on weight or volume payments (base milk price) and the second was based on adjusting the milk price based on fat and protein contents, calculated as (milk price + quality bonus) for PDP.
Daily cow-level energy and protein requirements
For each cow (i), the NEL and CP requirements were calculated as follows:
 \begin{align*}
& NEL_{I\left(\frac{{Mcal}} {Day}\right)} \\
& = \{ (0.079 \times B{W^{0.75}}) + [M{Y_i}(0.352 + 0.0966667 \times Fa{t_i})] \}
\end{align*}
(NRC 2001)
 \begin{align*}
C{P_i}_{\left( {\frac{g}{{day}}} \right)} &= [104.78 + 0.73 \times BW - 0.00015432 \times B{W^2}] \\
&+ [M{Y_i}(4,586 + 1,036 \times Fa{t_i})]
\end{align*}
(McGilliard et al., Reference McGilliard, Swisher and James1983)
where NELi and CPi are the daily cow-level net energy of lactation and crude protein respectively. BW is the estimated body weight calculated using the Korver algorithm as a function of parity and days in milk (Korver et al., Reference Korver, Van Arendonk and Koops1985), and MYi and Fati represent milk yield and fat percentage per cow per day.
Calculation of technical and economic indicators
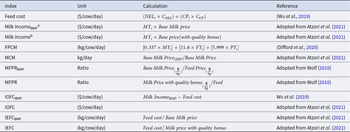
To calculate feed costs, NEL and CP concentrations were utilized instead of feed ingredient costs (Wu et al., Reference Wu, Liang, Shaver and Cabrera2019). Accordingly, milk price, milk income and other milk-related economic indicators, including MFPR, IOFC and IEFC, were calculated using two different methods (base milk price or PDP). The calculation method of these technical and economic indicators is illustrated in Table 2.
Index abbreviations, full names and methods of calculation, and corresponding references

Table 2 Long description
The table lists dairy production and profitability indexes, giving each index name, its unit, how it is calculated in words, and the study used as the reference. Feed cost is reported in dollars per cow per day and is calculated from dietary energy and protein amounts multiplied by their respective prices. Milk income is provided in two versions, both in dollars per cow per day: one using a base milk price and one using a base price that includes a quality bonus. Fat protein-corrected milk is reported in kilograms per cow per day and adjusts milk yield using fat and protein yields. Money-corrected milk is expressed as kilograms per day and reflects an adjustment based on the ratio of a quality-adjusted milk price to the base milk price. Milk-to-feed price ratio is shown as a ratio in two versions, using either the base milk price or the quality-bonus milk price relative to feed price. Income over feed cost is listed in dollars per cow per day, with one version explicitly defined as milk income minus feed cost; the other version is referenced but its calculation is not provided in the table. Income equal feed cost is listed in kilograms per cow per day and represents the milk output needed for milk revenue to match feed cost, calculated using either the base milk price or the quality-bonus milk price.
Notes: aBMP, base milk price; bmilk price + quality bonus; FPMC, fat protein-corrected milk; MCM, money-corrected milk; MFPR, milk-to-feed-price-ratio; IOFC, income over feed cost; IEFC, income equal feed cost.
Statistical analysis
All statistical analyses were performed using SAS 9.4. To evaluate the effects of parity and production level on the studied variables, a standardized 150-day milk yield was used for all cows. A two-way ANOVA was conducted using the GLM procedure in SAS with parity (1, 2, 3 or 4) and production level (high, medium or low) as the fixed factors. Model assumptions, including the homogeneity of variance and normality, were tested prior to performing ANOVA using Levene's test and the Shapiro–Wilk test, respectively. No significant violations were detected. The model was specified as follows:
 \begin{equation*}{Y_{ijkj}} = \mu + {\alpha _i} + {\beta _j} + {(\alpha \beta )_{ij}} + {y_k} + {e_{ijkj}}\end{equation*}
where  ${Y_{ijkj}}$ represents the observed value of the dependent variable, μ is the overall mean,
 ${\alpha _i}$ is the effect of the ith parity,
 ${\beta _j}$ is effect of the jth production level,
 ${(\alpha \beta )_{ij}}$ is the interaction effect between parity and production level,
 ${y_k}$ is the effect of the kth year and
 ${e_{ijkj}}$ is the residual error term. The significance level was set at P < 0.05, with Tukey's HSD test used for pairwise comparisons.
Subsequently, the correlation analysis between the investigated indices was performed using the correlation procedure in SAS.
Results and discussion
General information
The statistical description of the data is presented in Table 3. The average daily milk production, fat and protein percentage in 93 investigated herds was 40.1 ± 10.5 kg, 3.32 ± 0.84% and 2.97 ± 0.29%, respectively. The result of current study showed that the lowest costs for energy ($0.04 ± 0.01/Mcal) and protein ($0.17 ± 0.04/kg) were in 2020 and the highest costs for energy ($0.10 ± 0.01/Mcal) and protein ($0.56 ± 0.01/kg) were in 2017 (Table 3). Price fluctuations due to inflation caused by US sanctions against Iran in 2018 do not follow a specific pattern. Changes in the bans and restrictions imposed on Iran on the import or export of goods, government policies towards fuel and general instability in both the micro- and macroeconomic sectors contribute to higher levels and fluctuations in feed prices. Since the country is somewhat dependent on imported energy and protein sources such as soybean meal and corn, the government has implemented subsidies to support farmers. Due to the sanctions imposed on Iran in 2018, along with rising inflation and a devaluation of the national currency, the government was forced to provide additional subsidies to mitigate the impact of these sanctions. This subsidy program continued until 2020, leading to a decrease in energy and protein prices that year. The two main factors of sanctions and imprudence of managers, which have inevitably led to an increase in the inflation rate and a decrease in the value of the national currency, can be considered as the main factors behind food price fluctuations in Iran.
Descriptive statistic of production traits and calculated costs for energy and protein

Table 3 Long description
The table summarizes herd production traits and input prices overall and by year from 2016 through 2022, reporting mean with standard deviation and the minimum to maximum range. Milk yield is stable across years at about 40 kg/day, with a wide range from 10 to 70 kg/day. Fat percentage stays near 3.3 percent and protein percentage rises from about 2.86 percent in 2016 to about 3.11 percent in 2022. Somatic cell score is around 2.2 in most years, with a lower mean in 2021 and 2022 compared with 2016 to 2019. Days in milk averages in the mid 150s and trends slightly lower by 2022, while parity averages about 2.4 throughout. Energy price is highest in 2016 and 2017 at about 0.10 dollars per Mcal, then falls to about 0.04 in 2020 and returns to about 0.05 in 2021 and 2022. Protein price is highest in 2016 and 2017 at about 0.53 to 0.56 dollars per kg, then drops to about 0.17 in 2020 and remains near 0.19 to 0.20 in 2021 and 2022. Ranges are broad for several measures, so year-to-year mean differences may not reflect all variability within each year.
Notes:
a DIM, days in milk; bFP, fat percentage; cPP, protein percentage; dSCS, somatic cell score.
Economic indicators
The statistical analysis of economic indicators in this study revealed that the application of the premium has a small and positive effect on the mean milk price per kilogram, with an approximate impact of 2% (Table 4). Although the rate of change in indicators such as milk income, MFPR, IOFC and IEFC, which are directly influenced by milk price fluctuations, is low (about 1%), the imposition of the premium has a small positive effect on all of them. For example, the average IOFC has increased by $0.12 per cow per day, leading to greater profitability for farmers. In addition, the premium has caused a decrease of 0.2 kg per cow per day in the mean IEFC, reflecting a lower amount of milk needed to cover feed costs. These results suggest that considering a premium is beneficial and encourages farmers to improve the quality of their milk production. The mean of milk income and feed cost were $9.37 (±3.63) and $3.97 (±1.70) per cow per day, respectively. For the herds with available detailed financial information, feed cost accounted for approximately 63% of total production costs, whereas milk income accounted for about 87% of total farm revenue. These results are consistent with previous studies (Buza et al., Reference Buza, Holden, White and Ishler2014a; Hassanvand-Javanmard et al., Reference Hassanvand-Javanmard, Sadeghi-Sefidmazgi, Hassanvand, Dadpasand, Alikhani and Amer2017; Hatew et al., Reference Hatew, Jones and Mekuriaw2023; Liu et al., Reference Liu, Peng, Zhang and Dong2023). These findings indicate that both feed cost and milk income are the dominant components in the economic structure in Iranian Holstein dairy herds, thereby justifying the focus of this study on feed- and milk-related profitability indicators. The mean of IOFC was $5.40 (±2.41), ranging from $−1.12 to $18.06, consistent with the range of measures obtained by Buza et al. (Reference Buza, Holden, White and Ishler2014a) on Pennsylvania dairy farms, with earning between $0.33 and $16.60 per day (Buza et al., Reference Buza, Holden, White and Ishler2014a). Bach et al. (Reference Bach, Terré and Vidal2020) found that IOFC averages varied between $7.32 and $8.44 depending on production level (Bach et al., Reference Bach, Terré and Vidal2020).
Summary statistics of economic indicators of Holstein cow farms in Iran

Table 4 Long description
The table summarizes average levels and variability for milk price, feed price, feed cost, milk income, and profitability indicators for Holstein dairy farms in Iran, reporting mean, standard deviation, minimum, maximum, and coefficient of variation. Average milk price is about 0.229 dollars per kilogram, compared with a base-price value of 0.225, while average feed price is 0.16 dollars per kilogram of dry matter intake. Feed cost averages 3.97 dollars per cow per day, and milk income averages 9.37 dollars per cow per day, implying typical income over feed cost around 5.40 dollars per cow per day. Money-corrected milk averages 40.7 kilograms, ranging from 6.6 to 90.0. The milk-to-feed price ratio averages 1.57 under the premium system versus 1.54 under the base calculation, with a wider range under the premium system. Income over feed cost spans negative values up to about 18 dollars per cow per day, indicating some farms do not cover feed costs at times. The reported change rates associated with the premium are small: about plus 2 percent for milk price, plus 1 percent for milk income and related ratios, and about minus 1 percent for income equal feed cost. Comparisons between base and premium calculations should be interpreted cautiously because they reflect different pricing assumptions rather than independent measurements.
Notes:
* The rate of changes in indicators as a result of the milk price premium being imposed. MCM, money-corrected milk; MFPRBMP, milk-to-feed price ratio (calculated with base milk price); MFPR, milk-to-feed price ratio (calculated with PDP system); IOFCBMP, income over feed cost (calculated with base milk price); IOFC, income over feed cost (calculated with PDP system); IEFCBMP, income equal feed cost (calculated with base milk price); IEFC, income equal feed cost (calculated with PDP system).
IEFC ranged from 3.3 to 40.6 kg/cow/day, with a mean of 16.8 kg per cow per day. Based on the ratio of this index to milk yield, dairy herds require approximately 42% of their milk production to cover feed costs. The MFPR compares the price per kilogram of milk to the price per kilogram of feed. Consequently, the high values of this index are desirable, and the low values are undesirable. The average MFPR for the years studied was 1.57, ranging from 0.64 to 4.12.
In the present study, the MCM was found to be 1.5% higher than the overall milk yield, with values of 40.7 kg compared to 40.1 kg. In contrast, Atzori et al. (Reference Atzori, Valsecchi, Manca, Masoero, Cannas and Gallo2021) reported a difference of approximately 7% in Italy with yields of 32.4 kg versus 30.3 kg. This difference can be primarily attributed to variations in quality factors, such as milk fat and protein percentages between two countries. In Iran, the average of milk fat and protein percentages is 3.32% and 2.97%, respectively, while in Italy, these values were higher, at 3.98% for milk fat and 3.44% for milk protein (Atzori et al., Reference Atzori, Valsecchi, Manca, Masoero, Cannas and Gallo2021). The base milk price in this study was set based on 3.2% milk fat and 3% milk protein, while in the Italian study was set based on 3.5% milk fat and 3.2% milk protein. In Iran, there is minimal deviation from the benchmark quality factors used for rewards and penalties Specially protein percentage (+0.12% for fat% and −0.02% for protein%). In contrast, the referenced study reported values of +0.48% for fat and +0.24% for protein. Comparing dairy communities based solely on MCM is not sufficient, as this measure does not take into account feed costs. A more informative comparison can be made using the IOFC, which highlights the difference between milk income and feed expenses. To evaluate the relationship between milk price and feed cost in both societies, the MFPR index should also be considered. Despite both studies having similar MFPR values (1.57 in Iran and 1.41 in Italy), the IOFC was $5.40 in our study with an average milk yield of 40.1 kg, compared to $6.79 in the referenced study with an average milk yield of 30.3 kg. These findings suggest that under similar conditions, milk quality is more critical than milk quantity. Therefore, Iranian dairy farmers should shift their focus from prioritizing milk quantity to improve the quality of their milk production.
The MFPR Benchmark (MFPRBMP) exhibited the lowest coefficient of variation (CV) at 22%, while IOFC Benchmark (IOFCBMP) showed the highest CV at 46%. The MFPR is influenced by fluctuations in milk and feed prices, which tend to be closely coordinated over longer periods (monthly or annually). Conversely, IOFC performance is not only affected by the price fluctuations but also by the feed intake and the daily milk production per cow (short term).
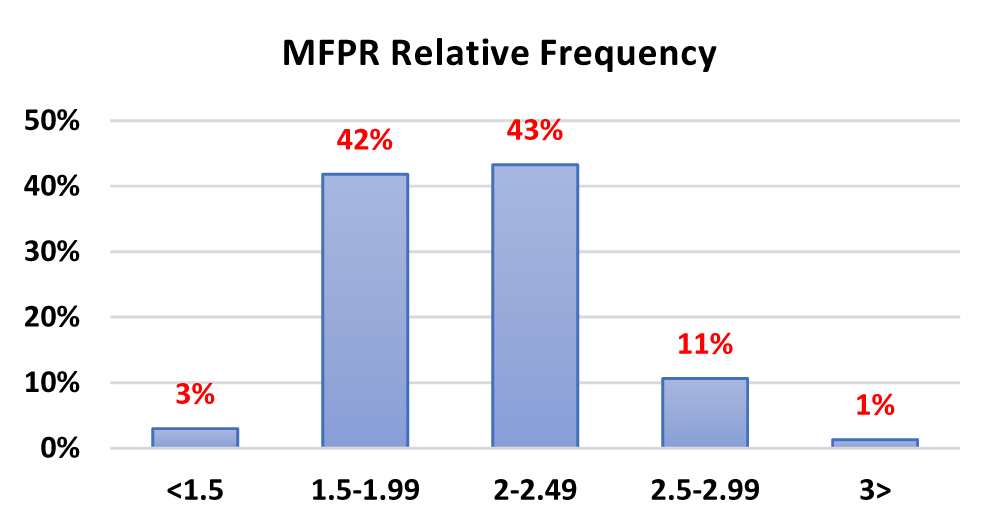
The frequency distribution of MFPR was illustrated in Fig. 1. Generally, MF values above 3.0 are associated with higher profitability, encouraging higher milk yield. Conversely, values below 3.0 indicate a loss-making system and serve as a contractionary signal for the dairy market (Wolf, Reference Wolf2010). The most common range for MFPR was between 2 and 2.49, followed by the group between 1.5 and 1.99. Only 1% of observations exceeded the value of 3. As a result, the increase in milk production is considered to be unprofitable in 99% of cases. Therefore, there is significant potential for increasing profits by modifying this ratio, particularly by achieving more milk per dollar consumed or reducing feed costs.
Milk-to-feed price ratio frequency (MFPR) from 2016 to 2022.

Figure 1 Long description
MFPR Relative Frequency. The horizontal axis shows MFPR ranges: less than 1.5, 1.5 dash 1.99, 2 dash 2.49, 2.5 dash 2.99, 3 greater than. The vertical axis shows percent, ranging from 0 percent to 50 percent, with tick marks at 0 percent, 10 percent, 20 percent, 30 percent, 40 percent and 50 percent. Bar values shown above the bars: less than 1.5 equals 3 percent; 1.5 dash 1.99 equals 42 percent; 2 dash 2.49 equals 43 percent; 2.5 dash 2.99 equals 11 percent; 3 greater than equals 1 percent.
The most prevalent category of MFPR was between 2 and 2.49, followed by those between 1.5 and 1.99; only 1% of observations exceeded a ratio of 3. Consequently, increasing milk production is deemed unprofitable in 99% of cases; thus, there is significant potential for profit enhancement through correcting this ratio, specifically by achieving more milk per dollar spent or reducing feed costs.
Fig. 2 illustrates the trends of key economic indicators from 2016 to 2022. Notably, there was significant variation between the IOFCs and the prices of milk and feed, although IOFC exhibited a closer alignment with fluctuations in milk prices (see Fig. 2A). During this period, milk prices peaked at $0.33/kg in the second half of 2016 and dropped to $0.16/kg in the first half of 2020. Similarly, feed prices reached their highest level at $0.25/kg DMI in the same timeframe, while they fell to $0.08/kg DMI in early 2020. In contrast, IOFC was highest in 2017 at $7.28/cow/day and lowest in 2019 at $3.38/cow/day. From a long-term perspective, the IOFC shows a strong correlation with both feed costs and milk income, as supported by Atzori et al. (Reference Atzori, Valsecchi, Manca, Masoero, Cannas and Gallo2021). However, it does not demonstrate a robust correlation with IOFC, as detailed in Table 5. The long-term correlation between IOFC and IEFC is relatively low (0.22), yet the 6-month moving averages indicate a moderate inverse relationship between these indices (see Fig. 2B).
Behaviour of key economic indicators over the 2016–2022 period.

Figure 2 Long description
The image contains four line graphs labeled A, B, C and D, illustrating economic indicators from 2016 to 2022. Graph A shows IOFC, milk price and feed price. The x-axis is labeled 'DATE' with intervals from 2016-1 to 2022-2. The left y-axis represents milk and feed price in dollars per kilogram, ranging from 0.00 to 0.35. The right y-axis represents IOFC in dollars per cow per day, ranging from 0.00 to 8.00. Milk price and feed price generally decrease from 2016 to 2020, with milk price peaking at approximately 0.33 dollars per kilogram in late 2016 and feed price peaking at 0.25 dollars per kilogram in the same period. IOFC fluctuates, peaking at around 7.28 dollars per cow per day in 2017. Graph B shows IOFC and IEFC. The x-axis is labeled 'DATE' with the same intervals. The left y-axis represents IOFC in dollars per cow per day, ranging from 0.00 to 8.00. The right y-axis represents IEFC in dollars, ranging from 0.0 to 25.0. IOFC shows a downward trend, reaching its lowest point in 2019 at approximately 3.38 dollars per cow per day. IEFC fluctuates moderately. Graph C shows IEFC and MFPR. The x-axis is labeled 'DATE' with the same intervals. The left y-axis represents IEFC in dollars, ranging from 0.0 to 25.0. The right y-axis represents MFPR, ranging from 0.00 to 2.50. IEFC remains relatively stable, while MFPR shows slight fluctuations. Graph D shows IOFC and MFPR. The x-axis is labeled 'DATE' with the same intervals. The left y-axis represents IOFC in dollars per cow per day, ranging from 0.00 to 8.00. The right y-axis represents MFPR, ranging from 0.00 to 2.50. IOFC shows a decline, while MFPR remains relatively stable. Overall, the graphs illustrate the relationship between IOFC and other economic indicators, highlighting trends and fluctuations over the specified period.
Pearson correlations between economic variables and indicators

Table 5 Long description
The table reports Pearson correlation coefficients between milk price, feed price, IOFC, IEFC, MCM, MFPR, feed cost, and milk income, with a p-value listed for each pair. Feed price is strongly positively related to feed cost (0.93) and also strongly related to milk price (0.83). Milk income has very strong positive relationships with IOFC (0.92) and feed cost (0.83), and is also positively related to milk price (0.70) and feed price (0.69). IOFC is strongly positively related to MCM (0.75) and moderately related to feed cost (0.55). IEFC shows a strong negative relationship with MFPR (−0.81) and a moderate positive relationship with feed cost (0.69). MFPR is also moderately negative with feed price (−0.62) and feed cost (−0.59), while several other relationships are weak, such as milk price with MCM (0.01) and IOFC with MFPR (0.05). All listed p-values are below 0.0001, indicating statistical significance, but correlations do not establish cause and effect.
Notes: r, correlation; p, p-value.
The IEFC is significantly affected by fluctuations in MFPR, with a strong negative correlation of −0.81 observed between these two measures (Fig. 2C). In the first half of 2018, both MFPR (1.13 kg) and IEFC (22.6 kg) reached their lowest levels, while optimal performance was recorded in the second half of 2021, with MFPR at 2.25 kg and IEFC at 11.4 kg. Consequently, an increase in MFPR enables the purchase of more feed per kilogram of milk produced. This relationship indicates that as milk income rises relative to feed costs, less milk is needed to cover those costs. Additionally, a systematic irregularity exists between the two primary indices of IOFC and MFPR (Fig. 2D), supported by a negligible correlation of 0.05, which confirms this irregularity (Table 5). Despite this, both indicators have shown improvement since 2019, exhibiting a similar relative trend. Research indicates that during periods of high volatility in feed and milk prices, MFPRs serve as poor profitability indicators. Instead, it is suggested that IOFC provides a more reliable measure of profitability in such volatile conditions (Wolf, Reference Wolf2010; Mat et al., Reference Mat, Arikan, Çevrimli, Akin and Tekindal2021).
As illustrated in Table 5, different correlated patterns emerge among the studied indicators. The highest positive correlations with feed price are seen in feed cost (0.93) and milk price (0.83), both statistically significant (P < 0.0001). There is also a notable correlation of 0.71 between milk price and milk income. In contrast, IEFC and MCM show no correlation with milk price. Although MFPR represents the ratio of milk price to feed price, its correlation with milk price (−0.11) and feed price (−0.62) indicates that it is more influenced by fluctuations in feed prices rather than milk prices.
Based on the results, IOFC demonstrated strong positive correlations of 0.92 with milk income, 0.75 with MCM, 0.55 with feed cost and 0.22 with IEFC. This indicates that IOFC is more significantly influenced by fluctuations in milk income than by feed costs. For effective margin risk management, it is essential to understand the behaviour of the IOFC margin, as it now encompasses more than just milk price fluctuations (Bozic et al., Reference Bozic, Newton, Thraen and Gould2012).
Effects of lactation and production level on indicators
Numerous studies have identified several factors that influence economic and feed efficiency, including (1) physiological status (age, stage of lactation, health, level of production, rumen fermentation and rumen microbiome, (2) genetics (genetic makeup of the cows), (3) nutrition (nutrient balance, ration composition and the presence of minerals and microelements) and (4) external factors (industrial and managerial policies, feed costs, milk prices and marketing strategies (Buza et al., Reference Buza, Holden, White and Ishler2014b; Krpalkova et al., Reference Krpalkova, Syrůček, Kvapilík and Burdych2017; Bach et al., Reference Bach, Terré and Vidal2020; Milić et al., Reference Milić, Novaković, Tekić, Matkovski, Đokić and Zekic2023).
Multiple comparisons of means followed by ANOVA revealed that both lactation stage and cow production level significantly (P < 0.01) affect all studied variables and indicators (Table 6). The results indicate that all indicators are aligned with milk production volume. Specifically, the highest IOFC was observed in third parity cows ($5.80/cow/day), while primiparous cows had the lowest IOFC ($4.95/cow/day). All other indicators (milk income, feed cost, IEFC and MCM) follow this trend; however, MFPR did not show a significant impact from parity status.
Effect of lactation and production level on studied variables and indicators

Table 6 Long description
The table reports milk output, milk components, feed cost, milk income, and profitability indicators by lactation number (1, 2, 3, and 4 or more) and by production level (low, medium, high). Across production levels, milk yield rises from about 24.1 kg per cow per day in low to about 48.6 in high, and fat and protein percentages drop from about 3.62 and 3.12 in low to about 3.19 and 2.89 in high. Feed cost increases with production level (about 2.90 to 4.50 dollars per cow per day), but milk income increases more (about 5.54 to 11.20 dollars per cow per day using the base milk price, and about 5.79 to 11.25 using the PDP system). Income over feed cost also increases with production level, from about 2.65 to 6.70 dollars per cow per day using the base milk price and from about 2.89 to 6.75 using the PDP system. The milk-to-feed price ratio decreases with production level, from about 1.70 to 1.48 using the base milk price and from about 1.80 to 1.50 using the PDP system. By lactation, milk yield and related output measures generally peak at lactation 3 (about 42.9 kg per cow per day) and are lower in lactation 1, while fat and protein percentages decline slightly as lactation number increases. Most comparisons show statistically meaningful differences, except the base-price milk-to-feed price ratio across lactations, which does not differ meaningfully.
Notes: a–dDifferent letters within a row in each group indicate statistically significant differences (P < 0.05). MCM, money-corrected milk; MFPRBMP, milk-to-feed price ratio (calculated with base milk price); MFPR, milk-to-feed price ratio (calculated with PDP system); IOFCBMP, income over feed cost (calculated with base milk price); IOFC, income over feed cost (calculated with PDP system); IEFCBMP, income equal feed cost (calculated with base milk price); IEFC, income equal feed cost (calculated with PDP system).
The average MCM increased by 5.8 kg from the first to the third lactation, coinciding with an average increase in milk production of 6.1 kg. Dairy cows in their third lactation yielded the highest average milk output, and during this period, the water content in the milk is also elevated. Consequently, the slope of MCM decreases at this stage. Additionally, the average increase in IOFCBMP from the first to the third lactation is $0.90, while IOFC with a bonus shows an increase of $0.85. When production levels rise from low to high, average production increases by approximately 102% (Table 6). In comparison, milk income rises by 94%, and IOFC increases by 134%. This disparity can be attributed to a moderate average feed cost increase of 55%, which contributes to enhanced farm profitability. As a result of implementing quality bonuses, dairy cows in their second lactation with medium production levels emerge as the most profitable within the herd, based on the interaction between parity and production level (Fig. 3). Increasing rewards and penalties related to milk quality can serve as an effective strategy to motivate farmers to prioritize improvements in milk quality over sheer volume.
Impact of premium application on key metrics across various lactation and levels of production.

Figure 3 Long description
Two grouped bar graphs. A) IOFC. Y axis label: Marginal IOFC left parenthesis dollar right parenthesis. Y axis range: minus 0.05 to 0.35. X axis categories: Lactation1, Lactation2, Lactation3, Lactation4 plus. Legend: Low, Medium, High. Lactation1 values: Low 0.26, Medium 0.17, High 0.08. Lactation2 values: Low 0.29, Medium 0.26, High 0.08. Lactation3 values: Low 0.23, Medium 0.22, High 0.04. Lactation4 plus values: Low 0.15, Medium 0.13, High minus 0.03. B) IEFC. Y axis label: Marginal IEFC left parenthesis kilogram right parenthesis. Y axis range: minus 0.80 to 0.20. X axis categories: Lactation1, Lactation2, Lactation3, Lactation4 plus. Legend: Low, Medium, High. Lactation1 values: Low minus 0.50, Medium minus 0.29, High minus 0.11. Lactation2 values: Low minus 0.60, Medium minus 0.45, High minus 0.09. Lactation3 values: Low minus 0.50, Medium minus 0.38, High minus 0.02. Lactation4 plus values: Low minus 0.31, Medium minus 0.21, High 0.10.
Conclusion
To understand farm profitability, indicators that integrate feed and milk prices are essential. Under fluctuating market conditions, feed- and milk-related indices, such as IOFC, MFPR, IEFC and MCM, provide valuable insights into dairy herd efficiency and financial sustainability. Among these, IOFC is the most practical and informative measure, effectively capturing the interaction between farm income and feed costs, thereby offering meaningful guidance for farm management. By utilizing these profitability indices, farmers and policymakers can assess herd performance more comprehensively than by simply evaluating milk production volume, highlighting their importance in optimizing feed efficiency and milk quality. Focusing on improving quality and efficiency rather than maximizing yield enables dairy operations to strengthen financial stability over the long term. Moreover, maintaining and expanding quality-based payment systems could enhance economic resilience and promote sustainable profitability within the Iranian dairy industry, particularly as a developing country facing ongoing economic challenges.
Funding statement
This research did not receive any specific funding.
Competing interests
The authors declare that there are no conflicts of interest.
Data availability statement
Derived data supporting the findings of this study are available from the corresponding author upon request.