



1. Introduction
In The Cognitive-Emotional Brain (Pessoa Reference Pessoa2013), I describe how emotion and cognition interact and are integrated in the brain. I believe that brain research has been ill-served by the dichotomization of large concepts like cognition and emotion. Further, strict a priori definitions of these concepts fuel dichotomization. We need a vocabulary that views concepts as complementary pairs that mutually define each other and, critically, do not exclude each other. As in the book, I will not define here terms such as emotion, motivation, and cognition; they will be used descriptively to refer to paradigms, task conditions, or “processes” that are closer to the traditional intended meanings of these terms. The book is aimed at students and investigators interested in the brain basis of emotion, especially those interested in understanding how perception and cognition reflect and embed affective/motivational significance. The book integrates findings from nonhuman animal research and human imaging research, the latter being the area my research focuses on.
The structure of this précis is as follows. Section 2 briefly reviews issues covered in chapters 2–4 of the book, which propose how to conceptualize amygdala function in broader terms than typically adopted in the field, and argue against the notion of the “automaticity of emotion.” Sections 3–6 focus on chapters 5–7 of the book, which describe how cognitive-emotional/motivational interactions and integration take place in the brain. Section 7 addresses the general issue of structure-function mapping in the brain. There, I argue for a “network” view of brain function but also describe several problems with this view that are underappreciated in the literature. Potential tools to characterize complex structure-function mappings are described. Finally, in Section 8, I draw some conclusions of the network perspective to the understanding of emotion and the brain.
2. Amygdala and the automaticity of emotion
2.1. Amygdala
Chapter 2 discusses the ever-important amygdala and its role in brain function. Based on rodent and human data, I describe how the amygdala's functions go beyond emotion as traditionally conceived, reflecting a trend toward viewing this structure not simply in terms of “fear.”
A key function of the amygdala is to shape selective information processing. Selection of information for further analysis is, of course, a central problem that needs to be solved for effective behavior (Grossberg & Levine Reference Grossberg and Levine1987). The amygdala is a core structure in a system involved in “What is it?” processing and thus contributes to highlighting what is of significance to the organism (Pribram & McGuinness Reference Pribram and McGuinness1975). However, the functions of the amygdala also involve “What's to be done?” A key reason for this is that the amygdala participates in the representation of value (including positive value) and in decision making. For example, amygdala lesions impair behavior on the Iowa Gambling Task in humans and alter delay-based decision making in rats (e.g., they become more impulsive). The amygdala thus takes part in an impressive array of processes that far exceed some of its proposed functions, such as vigilance, arousal, salience detection, novelty detection, and relevance detection. “Information gathering” (Whalen Reference Whalen1998) better captures several of its functions but comes short, too. In the end, it is better simply to refrain from overly summarizing its functional repertoire so as to better appreciate the wide scope of the amygdala's contributions to brain mechanisms and behavior.
2.2. Subcortical “low road” pathway and emotional processing
A purported division of labor between cortical and subcortical regions has been present from the time of the earliest circuit models of emotion (e.g., Papez Reference Papez1937). Many versions of this type of dual processing model exist, including some variants that have captured the popular imagination, such as the “triune brain” (MacLean Reference MacLean and Schmitt1970; Reference MacLean1990).
In the case of vision, it has been suggested that a subcortical pathway from the retina to superior colliculus to pulvinar to amygdala that entirely bypasses cortex enables the processing of emotion-laden visual stimuli to be fast, automatic, and nonconscious. In chapter 3, I argue against this notion on several general grounds: (1) Affective visual information is not handled qualitatively faster than other visual information; (2) processing of affective visual stimuli involves both low- and high-spatial frequency information; and (3) the amygdala is not required for rapid, nonconscious detection of affective information. For these and many other reasons, Ralph Adolphs and I proposed the “multiple waves” model as an alternative to the low-road pathway scheme (Pessoa & Adolphs Reference Pessoa and Adolphs2010). The model shifts the debate away from whether there is a unique subcortical pathway to whether a processing architecture exists that is capable of rapidly transmitting information via multiple pathways. The resulting multiple waves model emphasizes the role of the pulvinar in coordinating and regulating the flow of multimodal information, which is accomplished via a series of thalamo-cortical loops. In this role, the pulvinar moves from being a passive relay station of the “standard hypothesis” to being an active element of information processing.
2.3. What kind of unawareness matters?
The research literature is replete with paradigms such as backward masking and the attentional blink that challenge the visual system so that awareness can be studied. At times, much is made about neuroimaging responses observed in the amygdala for very brief stimuli (e.g., 15–30 ms). In such cases, subjects may report not seeing them (“subjective unawareness”). In the book, I argue that this type of “subliminal” unawareness is not the most relevant one to understand the impact of affective content on behavior and on clinical conditions such as anxiety. A more important sense is associated with the idea of unintentional processing, which may prove to be more important to the understanding of human behavior. Whether the unintentional unconscious is sophisticated and flexible, as argued by social psychologists (see Bargh & Morsella Reference Bargh and Morsella2008), is a matter of debate. But there can be no doubt that it is qualitatively different from the type of subliminal unconscious sometimes emphasized in the emotion literature (for evidence that the “subliminal unconscious” may be quite “dumb,” see Loftus & Klinger Reference Loftus and Klinger1992 – if at all present; Pessoa Reference Pessoa2005).
2.4. Why is the amygdala important?
In the broader neuroscience literature, the amygdala is viewed as a central node in emotional processing in part because of the “low-level” properties ascribed to the subcortical pathway. Defects in the amygdala system are said to underlie phobias, mood disorders, and post-traumatic stress syndrome, and variability in its functioning to reflect individual differences at the genotypic and personality level.
Although in chapter 3 I challenge many of the properties typically ascribed to the subcortical pathway, the amygdala is indeed important for behavior and mental health. First, together with the hypothalamus and medial PFC, the amygdala has extensive projections to downstream regions in the brainstem that are capable of mobilizing the body; indeed, its central nucleus is at times described as a “controller of the brainstem.” The autonomic and neuroendocrine connections of these brain regions are part of sympathetic and parasympathetic networks that coordinate bodily responses in the face of challenges to the organism. Second, the amygdala, hypothalamus, medial PFC, and related regions, being among the most extensively connected parts of the brain, are optimally positioned to influence information processing. As hubs through which evaluative signals are communicated, they are thought to have widespread effects on mental function and to play a significant role in affective and cognitive impairments observed in mood disorders. Metaphorically speaking, as one of these hubs, the amygdala is strategically positioned to “ignite” both body and brain.
2.5. Processing of emotion-laden information and automaticity
Shiffrin and Schneider (Reference Shiffrin and Schneider1977, pp. 155–156) defined an “automatic process … as a sequence of nodes that nearly always becomes active in response to a particular input configuration.” Because automatic and controlled processes appear to be qualitatively opposed, it is natural to dichotomize mental phenomena into these two classes. But such a dichotomy has simply not held up in the face of data. Reports of automaticity have invariably been countered by reports of capacity limitation; behavioral effects assumed to operate automatically are influenced in ways that belie that assumption.
The argument that I make in chapter 3 is that a better framework is one where performance is always considered capacity limited and described as a performance-resource function (Norman & Bobrow Reference Norman and Bobrow1975). Some behaviors will exhibit shallower performance-resource relationships, where performance only rises slowly based on the mental effort exerted – these behaviors are hence “controlled.” Other behaviors exhibit steeper relationships, and ceiling performance is reached even when conditions are degraded (e.g., under short exposure) – these behaviors are hence “efficient.” Although the performance-resource function may seem to be an abstract construct when little is known about the task at hand, it forces researchers to consider a spectrum of scenarios when studying how a behavior depends on multiple factors that influence performance.
Why is a continuous framework better than a dichotomous one? For one thing, it fits the empirical data better: Researchers have repeatedly found capacity limitations for “automatic” phenomena (e.g., Pashler Reference Pashler1998). For another, the dichotomous framework is plagued by serious conceptual issues (Moors & De Houwer Reference Moors and De Houwer2006). Another reason a continuous framework is better is that we still have an incipient understanding of competition – and, hence, of whether interference will result when multiple items are involved. The notion of competition, as accepted by most researchers, goes roughly as follows. Because processing capacity is limited, competition is proposed to “select” the most relevant information at any given time (Desimone & Duncan Reference Desimone and Duncan1995; Grossberg Reference Grossberg1980); when resources are not fully consumed, spare capacity is used to process task-irrelevant items (Lavie Reference Lavie1995). The problem is that we do not always know whether interference will occur in any given situation. Generally, multiple factors determine how information competes in visual cortex and beyond, including task difficulty, set size, spatial arrangement, cuing, and the like. Finally, a continuous framework demystifies the processing of certain complex features. For example, processes such as reading and the perception of elaborate emotional images are at times depicted as “automatic” in a sense that is almost magical (for a cogent in-depth discussion, see Pourtois et al. 2012). Indeed, the underlying mechanisms of abilities such as proficient reading and the perception of emotional scenes are remarkably fast. That we do not understand why they are so fast, however, simply means that we are still quite some way from a better mechanistic description of these processes.
2.6. Dual process models
The discussion of automatic versus controlled processes is also pertinent to dual process models. Common to these models is the strong assumption of the existence of two qualitatively different mental systems, for example, “intuition” and “reasoning” (see Keren and Schul Reference Keren and Schul2009). A popular trend is to call the two components “system 1” and “system 2,” where the first is automatic/heuristic/reflexive and the second is controlled/analytic/reflective (Evans Reference Evans2008). But as others have expressed in the past, the idea of a dual system model is both slippery and conceptually unclear (see Keren & Schul Reference Keren and Schul2009). For one, nearly all dual process models have as a central component the automatic versus controlled dichotomy, which as discussed above is not a viable distinction. In fact, as with the question of automatic versus controlled processing of emotion-laden stimuli, the question of whether there are two systems in dual process models is not an entirely empirical one. This is because no single critical experiment can provide a final, definitive answer. In the end, however irresistible dichotomies are to the human mind (Kelso & Engstrøm Reference Kelso and Engstrøm2006; Newell Reference Newell and Chase1973), dichotomizing implies oversimplifying (Keren & Schul Reference Keren and Schul2009; Kruglanski et al. Reference Kruglanski, Erbs, Pierro, Mannetti and Chun2006). A continuous framework is better, albeit more complex (Kruglanski et al. Reference Kruglanski, Erbs, Pierro, Mannetti and Chun2006).
3. Diverse forms of cognitive-emotional interactions are not limited to mutual suppression
Nauta (Reference Nauta1971, p. 182) suggested that the PFC could be considered “the major – though not the only – neocortical representative of the limbic system.” Yet, most proposals in the literature portray the PFC's core function as cognitive, or compartmentalize it into cognitive and affective regions (see Bush et al. Reference Bush, Luu and Posner2000). In particular, the lateral PFC is still viewed as a quintessential cognitive region, especially the portion that is loosely referred to as the “dorsal-lateral PFC.” This section reviews human studies that have investigated cognitive and emotional processing in the human PFC (see also Dolcos et al. Reference Dolcos, Iordan and Dolcos2011) to explore how emotion and cognition, domains traditionally thought of as mutually antagonistic, interact there. The section does not discuss the part of the PFC called the orbitofrontal cortex, whose contributions to emotion are well accepted (Zald & Rauch Reference Zald and Rauch2007). In the ensuing discussion, it is useful to consider the regions outlined in Figure 1.
Frontal cortex anatomy. “Prefrontal cortex” refers to cortex “in front of motor areas,” typically anterior to Brodmann area 6. (A) Lateral surface of cortex, showing dorsal and ventral sectors. (B) Medial surface of cortex, outlined in black, showing approximate locations of dorsal (d) and ventral (v) sectors. In the paper, dorsal parts of medial prefrontal cortex also include parts posterior to the “d” arrow (such as presupplemantary and supplementary motor areas). S, subgenual anterior cingulate cortex.

3.1. The “Classical” view: Emotion-cognition push-pull
In an important paper, Drevets and Raichle (Reference Drevets and Raichle1998) noted that regional blood flow during attentionally demanding cognitive tasks decreased in regions such as the amygdala, orbitofrontal cortex, and ventral-medial PFC, whereas blood flow increased in these regions during specific emotion-related tasks. Conversely, blood flow during experimentally induced and pathological emotional states (Mayberg et al. Reference Mayberg, Liotti, Brannan, McGinnis, Mahurin, Jerabek, Silva, Tekell, Martin, Lancaster and Fox1999) decreased in regions such as the dorsal-medial and dorsal-lateral PFC, whereas blood flow increased in these regions during cognitive tasks. These reciprocal patterns of activation suggested to Drevets & Raichle (Reference Drevets and Raichle1998) that emotion and cognition engage in competitive interactions.
This insight led to a wealth of studies pursuing the notion of a dorsal-cognition versus ventral-emotion axis of organization in the human brain. For example, Dolcos and colleagues investigated emotional distraction during working memory tasks (see also Anticevic & colleagues Reference Anticevic, Repovs and Barch2010). Subjects were shown sample stimuli that had to be remembered during a subsequent delay period during which they saw distracting stimuli, including neutral and emotional pictures. The findings of one of their studies (Dolcos & McCarthy Reference Dolcos and McCarthy2006) are illustrated in Figure 2. During the delay period, responses in dorsal-lateral PFC (Fig. 2B) were highest for the “scrambled” (digitally scrambled versions of pictures), intermediate for neutral, and lowest for emotional distractors – a pattern of responses also observed in parietal cortex. Behavioral performance mirrored this and was worst for emotional distractors. Viewing emotional distractors during the delay period appeared to interfere with neural activity normally observed in these sites – activity that supports working memory performance (e.g., Pessoa et al. Reference Pessoa, Gutierrez, Bandettini and Ungerleider2002). Responses in the ventral-lateral PFC (Fig. 2C) followed the opposite pattern, namely, the strongest responses were observed during the viewing of emotional distractors, suggesting that ventral-lateral PFC contributed to inhibiting the distracting effects of stimuli presented during the delay period. Overall, several studies are consistent with the dorsal-cognition versus ventral-emotion segregation (both along the lateral surface of the brain and its medial sector), including those probing emotional distraction, emotional conflict, and emotion regulation (Ch. 5).
Emotional distraction during a working memory task. Subjects were shown scrambled, negative, or neutral distractor images during the delay period of the task. (A) Schematic representation of differential responses in brain. Regions where responses were stronger to scrambled than to emotional images are shown in light gray; regions where they were stronger to emotional than to scrambled images, in dark gray. (B) Time course data for dorsal-lateral prefrontal cortex. (C) Time course data for ventral-lateral prefrontal cortex. Horizontal bars in panels B and C correspond to onset and duration of sample stimuli, distractors, and probes, respectively. Time series plots kindly provided by Florin Dolcos, adapted with permission from Dolcos and McCarthy (Reference Singer, Critchley and Preuschoff2006).

The organization of the medial PFC, a complex brain region involved in diverse functions (Vogt Reference Vogt2008), has strongly fueled the dorsal versus ventral view of emotion and cognition organization in the brain, particularly following another influential paper (Bush et al. Reference Bush, Luu and Posner2000; see also Devinsky et al. Reference Devinsky, Morrell and Vogt1995). In the next section, I argue against the dorsal versus ventral framework in the medial PFC in particular, and in the subsequent section against the dorsal versus ventral view in the PFC more generally.
3.2. Beyond the dorsal versus ventral-medial dichotomy in the prefrontal cortex
Results from several individual studies challenge the dichotomy. For example, Mobbs and colleagues (Reference Mobbs, Yu, Rowe, Eich, FeldmanHall and Dalgleish2010) examined how brain responses vary as a function of perceived threat proximity. In an unusual experimental manipulation, each participant inside the MRI scanner placed a foot into a custom-built box containing multiple compartments, while watching a video of a live tarantula placed into one of the compartments at varying distances from the foot (actually prerecorded). Increases in responses as a function of proximity were observed in several brain regions; notably in the dorsal-medial PFC.
The “attentional network” involves fronto-parietal regions, including the dorsal-medial PFC (Corbetta & Shulman Reference Corbetta and Shulman2002; Kastner & Ungerleider Reference Kastner and Ungerleider2000). To assess brain regions that are sensitive to high levels of threat, I reviewed activation sites reported in aversive conditioning studies (Pessoa Reference Pessoa2009). Surprisingly, activation was repeatedly reported not only in the amygdala but also in frontal sites overlapping with those in the attentional network, including the dorsal-medial PFC – consistent with findings from formal meta-analyses (Etkin & Wager Reference Etkin and Wager2007; Mechias et al. Reference Mechias, Etkin and Kalisch2010). To understand the organization of the medial PFC and its role in emotion, Etkin and colleagues (Reference Etkin, Egner and Kalisch2011) reviewed both the human and nonhuman animal literatures. They surmise that sites in both dorsal- and ventral-medial PFC make prominent contributions to emotional processing. Finally, an extensive formal meta-analysis of human neuroimaging studies (Shackman et al. Reference Shackman, Salomons, Slagter, Fox, Winter and Davidson2011) further demonstrates the considerable overlap of sites in the medial PFC engaged during negative affect and cognitive control (Fig. 3).
Cognition and emotion in medial frontal cortex. Foci of activation across studies of negative affect and cognitive control. Extensive overlap between emotion and cognition was observed in dorsal-medial prefrontal cortex. Figure kindly provided by Alex Shackman and adapted with permission from Shackman et al. (Reference Shackman, Salomons, Slagter, Fox, Winter and Davidson2011).

In summary, although it is still influential, the segregation model of medial PFC organization is no longer viable, as different research groups now argue (e.g., Etkin et al. Reference Etkin, Egner and Kalisch2011; Pessoa Reference Pessoa2009; Shackman et al. Reference Shackman, Salomons, Slagter, Fox, Winter and Davidson2011). Large portions of the PFC are engaged during emotional processing, including both dorsal and ventral portions of the medial PFC. Indeed, when large numbers of studies are considered jointly, the weight of their findings strongly favors an organization of the medial PFC that is not segregated into affective and cognitive compartments but instead is shared by cognitive and affective domains in a way that allows the medial PFC to support the adaptive control of complex behaviors (Pessoa Reference Pessoa2008; Shackman et al. Reference Shackman, Salomons, Slagter, Fox, Winter and Davidson2011).
3.3. Beyond push-pull: When emotion and cognition work together
Now, I will turn to the broader issue of the frequently held view of emotion-cognition organized as push-pull, or antagonistic, systems. Consider once more the study by Dolcos and McCarthy (Reference Dolcos and McCarthy2006) that showed that emotional distractors produced decreased responses in parts of the dorsal-lateral PFC that are important for cognitive tasks. This type of response, which favors the antagonistic organization, is far from universal, however. For example, also during conditions of emotional distraction, Erk et al. (Reference Erk, Kleczar and Walter2007) observed increased responses to emotional stimuli in the dorsal-lateral PFC. They also observed increased responses when they increased the load of a separate nonemotional working memory task. In other words, both the emotional and cognitive manipulations produced enhanced responses in the dorsal-lateral PFC. Conversely, emotional manipulations do not always generate decreased responses in frontal-parietal areas that are recruited by effortful, cognitive tasks. For example, in one of our studies, when subjects viewed a “threat cue” that signaled a potential upcoming shock, deactivation was observed in emotion-related regions (Choi et al. Reference Choi, Padmala and Pessoa2012).
In all, cognitive-emotional interactions take diverse forms that go beyond a straightforward antagonistic relationship (Ch. 5). Instead, I suggest that lateral PFC, in particular, is a convergence site for cognitive and emotional signals where they are integrated.
3.3.1. The basic “direction” of brain responses and their interpretation
As discussed above, a key question during cognitive-emotional interactions is whether emotional information decreases or enhances a region's responses during cognitive tasks – to decide if the relationship is push-pull. Unfortunately, the direction (increases vs. decreases) of brain responses does not uniquely determine their functional significance. Consider again the working memory study by Dolcos and McCarthy (Reference Dolcos and McCarthy2006), which showed decreased responses in dorsal-lateral PFC during emotional distraction. More important, this condition was linked with impaired task performance, matching the pattern of an antagonistic cognitive-emotional interaction. But how should we interpret these findings? Because it is unknown whether increased responses reflect greater capacity to utilize the region, neural inefficiency, or increased effort, the interpretation of the results is equivocal. The difficulty here is not about problems of interpreting functional MRI responses given their indirect relationship with neuronal activity. The same issues would arise with cell recordings, because disentangling, say, neural efficiency, increased effort, and so on, is again far from simple.
A potential strategy is to interpret response changes in terms of behavior and brain responses during neutral tasks. During working memory, we know that dorsal frontal and parietal regions are important from both monkey and human work. In these regions, response magnitude even tracks performance on a trial-by-trial basis (Pessoa et al. Reference Pessoa, Gutierrez, Bandettini and Ungerleider2002). Thus, when emotional distractors lead to decreased responses in dorsal-lateral PFC and impaired task performance (Anticevic et al. Reference Anticevic, Repovs and Barch2010; Dolcos & McCarthy Reference Dolcos and McCarthy2006), it is possible to more strongly interpret the findings in terms of underlying antagonistic interactions. Although in this case the original interpretation holds, the example underscores the need to ground the responses during emotional manipulations by building on closer ties between a brain region's responses and associated behavior during nonemotional tasks.
3.3.2. Anxiety, executive function, and prefrontal cortex responses
A closely related issue arises in the context of studies of brain responses in anxious individuals: Are cognitive control areas in the PFC, including the dorsal-lateral PFC, under- or overactivated in these individuals? This question is relevant given the belief that anxiety is particularly associated with reduced processing efficiency. Thus, to maintain comparable levels of task performance, anxious individuals must exert greater cognitive effort (Eysenck et al. Reference Eysenck, Derakshan, Santos and Calvo2007), which is linked to increased responses in brain regions involved with cognitive control.
But some studies have reported that anxiety is associated with underactivation in cognitive control circuits (Bishop Reference Bishop2007; Reference Bishop2009; Bishop et al. Reference Bishop, Duncan, Brett and Lawrence2004; see also Basten et al. Reference Basten, Stelzel and Fiebach2011; for additional discussion, see Eysenck & Derakshan Reference Eysenck and Derakshan2011). Examining under- or overutilization of a brain area, however, does not lead to an unequivocal interpretation of cognitive processing in anxious subjects, as argued by Fales and colleagues (Reference Fales, Barch, Burgess, Schaefer, Mennin, Gray and Braver2008). This is because either reduced or enhanced neural recruitment may reflect differences in a host of factors, including efficiency, motivation, effort, or the capacity to activate regions when needed. The difficulties surrounding the issue of under- versus overactivation are mirrored by those encountered in the human developmental literature, where changes in the responses of a brain region with age are hard to interpret (Somerville & Casey Reference Somerville and Casey2010).
The upshot of section 3 is as follows: The effects of emotion on cognition, and vice versa, are best viewed not as a simple push-pull mechanism, but as interactions that result in processes and signals that are neither purely cognitive nor emotional. Instead, their “cognitive” or “emotional” nature is blurred in a way that highlights the integration of these domains in the brain (Pessoa Reference Pessoa2008).
4. Motivation: Interactions between motivation and cognition
According to traditional psychological models, motivation relies on a global, rather blunt energization factor to influence the vigor and frequency of behavioral output, though without specific effects (e.g., Duffy Reference Duffy1962; Hull Reference Hull1943). Current progress in understanding the mechanisms of reward and motivation challenges this view, which has renewed interest in motivational effects on perception and cognition. Chapter 6 contains discussion of the selective ways motivation affects task performance, some of which I briefly review here.
Jan Engelmann and I investigated the impact of changes in incentive value on behavior during a difficult spatial localization task (Engelmann & Pessoa Reference Engelmann and Pessoa2007). Participants performed the task under conditions in which they could earn extra monetary rewards, avoid losing money, or, during a baseline condition, neither gain nor lose. In theory, motivation could lead to indiscriminate responding increasing the number of both correct detections and false alarms. Instead, detection performance improved as a function of absolute incentive value (gains and losses produced similar results) independent of unspecific influences, such as general activation (e.g., purely faster response times) or response bias (e.g., more conservative responses). We observed increases in visual sensitivity (d-prime) in both endogenous and exogenous attention tasks (see also Engelman et al. Reference Engelmann, Damaraju, Padmala and Pessoa2009).
In an event-related potential (ERP) study, Hickey and colleagues (Reference Hickey, Chelazzi and Theeuwes2010) sought to dissociate “strategic” (such as paying more attention) and “incidental” (such as undesired) effects of reward. To that end, they probed how reward in one trial affected visual processing in the next. Following a high-reward trial, the P1 ERP response component, which occurs approximately 100 ms after stimulus onset, was found to be stronger contralateral to targets of the same (task-irrelevant) color rewarded on the previous trial, revealing facilitated responses based on previous-trial reward. So-called N2pc responses were found to be stronger as well, indicating that target processing was enhanced. Notably, P1 and N2pc effects were observed on trials following high reward when a salient distractor was shown in the reward-paired color, showing that reward has an impact that can be independent of its role in establishing goal-driven attention (e.g., when a subject deliberately increases attention in anticipation of reward). In a related monkey cell-recording study, Peck and colleagues (Reference Peck, Jangraw, Suzuki, Efem and Gottlieb2009) showed that cues signaling reward biased attention in a value-specific fashion, even though they were “maladaptive” (they interfered with the required behavior). They proposed that posterior parietal cortex in the monkey contains a visuospatial map – a salience map – that takes into account reward expectations when guiding attention.
Does motivation influence the selection of information? To answer this question, Srikanth Padmala and I investigated the effects of reward during a response-conflict task (Fig. 4) (Padmala & Pessoa Reference Padmala and Pessoa2011). Based on previous studies, we anticipated that motivation would enhance engagement of fronto-parietal attentional regions and, consequently, that these regions would be better positioned to exert goal-directed control influencing visual processing (Fig. 5). Behaviorally, we observed response interference: Performance was slower on incongruent trials than on neutral ones. But reward reduced response interference. Given that reward also decreased response facilitation (i.e., the beneficial effect of a congruent task-irrelevant item), the results supported the inference that motivation enhanced attentional filtering, thereby reducing the influence of the task-irrelevant word item. Our brain imaging results revealed that, during the cue phase when subjects were told whether a reward was possible, responses in fronto-parietal regions were stronger with reward – consistent with increased attention. Notably, larger cue-related responses were associated with larger decreases in interference-related responses in the dorsal-medial PFC during the subsequent task phase. This suggested that upregulation of control during the cue phase led to decreased interference during the task phase.
Response-conflict paradigm. In the reward condition shown here, a cue stimulus (“$20”) signaled that subjects would be rewarded for fast and correct performance; in the control condition (not shown here), a cue stimulus (“$00”) signaled that there would be no reward. During the target phase, a stimulus picture of a house or building was presented together with a task-irrelevant word (an incongruent condition is illustrated here). After the target stimulus, subjects were informed about the reward and about the total number of points accrued. Reproduced with permission from Padmala and Pessoa (Reference Padmala and Pessoa2011).

Hypothesized network interactions. (A) Predicted mediation by target/distractor processing in visual cortex of the relationship between attentional control implemented in fronto-parietal cortex during the cue phase and conflict-related activity in medial prefrontal cortex during the subsequent target phase (see white arrow). (B) Predicted effect of motivational context on functional interactions between fronto-parietal cortex and subcortical regions involved in reward processing. Reproduced with permission from Padmala and Pessoa (Reference Padmala and Pessoa2011).

We also observed responses to the cue in several subcortical sites that are engaged during reward-related processing, including the caudate and putamen in the dorsal striatum, nucleus accumbens in the ventral striatum, and midbrain. We reasoned that, if motivationally salient cues engage fronto-parietal regions more robustly during the cue phase, these regions should exhibit increased “coupling” with some of the above regions, which are sensitive to the motivational significance of the cues (Fig. 6A). Indeed, in the reward condition, we observed increased trial-by-trial functional connectivity between the intraparietal sulcus in parietal cortex and the putamen, caudate, and nucleus accumbens (Fig. 6B; see also Harsay et al. Reference Harsay, Cohen, Oosterhof, Forstmann, Mars and Ridderinkhof2011). More interesting, the strength of the differential coupling (reward minus nonreward) between cortical and subcortical areas was linearly related to individual differences in reward sensitivity, showing that the functional interaction between these regions was stronger for subjects who scored higher in this dimension. See also Krebs et al. (Reference Krebs, Boehler and Woldorff2010; Reference Krebs, Boehler, Roberts, Song and Woldorff2011).
Functional connectivity during reward trials. (A) Regions exhibiting stronger functional connectivity with the right intraparietal sulcus (IPS) during the cue phase for reward trials. (B) Scatter plot showing the trial-by-trial relationship between right IPS and right nucleus accumbens (NAcc) signals during reward (black dots and line) and no-reward (gray dots and line) trials. Data are illustrated for a sample subject. (A-B) Reproduced with permission from Padmala and Pessoa Reference Padmala and Pessoa2011. (C) The polar plot shows increases in functional connectivity of the right caudate with nearly all regions belonging to the “other” community. Line lengths represent the relative strength of the functional connectivity between regions. Key: _L, left; _R, right; Caud, caudate; FEF, frontal eye field; IPL, inferior parietal lobe; aIns, anterior insula; IPS, intraparietal sulcus; PCG, precentral gyrus; MFG, middle frontal gyrus; MPFC, medial prefrontal cortex; SMA, supplementary motor area. (C) Reproduced with permission from Kinnison et al. (Reference Kinnison, Padmala, Choi and Pessoa2012).

Interactions between motivation and working memory have been the target of several neuroimaging studies (e.g., Beck et al. Reference Beck, Locke, Savine, Jimura and Braver2010; Gilbert & Fiez Reference Gilbert and Fiez2004; Jimura et al. Reference Jimura, Locke and Braver2010; Pochon et al. Reference Pochon, Levy, Fossati, Lehericy, Poline, Pillon, Le Bihan and Dubois2002; Taylor et al. Reference Taylor, Welsh, Wager, Phan, Fitzgerald and Gehring2004). In the study by Jimura and colleagues (Reference Jimura, Locke and Braver2010), reward did not simply increase activation; it also shifted the timing of working memory responses (an effect that correlated with individual differences in reward sensitivity). They suggested that, in the reward condition, subjects may have adopted a more proactive control strategy to aid performance instead of a just-in-time reactive strategy – and thus increase their chance of reward (Braver Reference Braver2012; Braver et al. Reference Braver, Gray, Burgess, Conway, Jarrold, Kane, Miyake and Towse2007). Interactions between motivation and working memory have been studied in monkey cell-physiology studies, too. Not only do cells in the lateral PFC hold information of an object's shape and location, but they are also modulated by reward expectancy (Watanabe Reference Watanabe1990; Reference Watanabe1996; see also Leon & Shadlen Reference Leon and Shadlen1999). In fact, studies demonstrate that cognition and motivation signals are integrated. For example, during the delay period of a delayed–eye saccade task, some lateral prefrontal cells increased their firing if the monkey was initially cued to make a saccade to the preferred versus the opposite direction; these cells also exhibited increased firing during rewarded versus unrewarded trials (Kobayashi et al. Reference Kobayashi, Lauwereyns, Koizumi, Sakagami and Hikosaka2002). Importantly, during rewarded trials of saccades to the preferred direction, there was an increase of the amount of transmitted information with respect to target position, as quantified by information theory; reward information increased the discriminability of target positions, leading to enhanced performance (see also Kobayashi et al. Reference Kobayashi, Kawagoe, Takikawa, Koizumi, Sakagami and Hikosaka2007).
4.1. Energizing force versus selective effects
Traditional accounts describing motivation as a global activation independent of particular control demands have been echoed by a functional MRI study in which Kouneiher and colleagues (Reference Kouneiher, Charron and Koechlin2009) argue that motivation and cognitive control can be regarded as two separate and additive – instead of interactive – factors. Although there is little question that motivation can have generalized, activating contributions to behavior (see Robbins & Everitt Reference Robbins and Everitt2007; Salamone et al. Reference Salamone, Correa, Farrar, Nunes and Pardo2009), current findings (Ch. 6) underscore the ability of motivation to shape behavior selectively, whether by reducing response conflict or task-switch costs, via selective effects on working memory, or by improving long-term memory (for the latter, see the work of Adcock and colleagues; e.g., Adcock et al. Reference Adcock, Thangavel, Whitfield-Gabrieli, Knutson and Gabrieli2006). Another body of research demonstrating selective effects of motivation has investigated attentional effort, as described by Sarter and colleagues (e.g., Sarter et al. Reference Sarter, Gehring and Kozak2006).
5. Dual competition model
Here, I describe a framework in which both emotional and motivational signals are integrated with perception and cognition so as to effectively incorporate value into the unfolding of behavior (Pessoa Reference Pessoa2009; Pessoa & Engelmann Reference Pessoa and Engelmann2010). To reflect the central idea that both emotion and motivation influence competition at both the perceptual and the executive levels, the framework is termed the dual competition model (thus “dual” spans both “emotion and motivation” and “perceptual and executive”). Following general remarks in the next paragraph, I will describe how the framework applies to emotion (sect. 5.1, focusing on emotion-laden negative stimuli) and then motivation (sect. 5.2, focusing on task manipulations involving reward).
Competition for neural resources exists in the sensory cortex (Grossberg Reference Grossberg1980). To understand the flow of information processing more generally, we need to go beyond perceptual competition and explicitly incorporate the role of executive control. Behavioral research indicates that executive control is not unitary and that different functions have their own limited processing capacities, or resources. Neuropsychological research also supports the dissociation of cognitive operations, consistent with the “fractionation” of the central executive (Norman & Shallice Reference Norman, Shallice, Davidson, Schwartz and Shapiro1986; Stuss & Knight Reference Stuss and Knight2002). Yet ample evidence also suggests at least some unity of executive functions – certain mechanisms are shared across functions (Duncan et al. Reference Duncan, Emslie, Williams, Johnson and Freer1996; Miyake et al. Reference Miyake, Friedman, Emerson, Witzki, Howerter and Wager2000). Capacity sharing has implications for information processing because it implies executive competition: Subcomponents of executive control are mutually interacting, such that multiple functions cannot be independently executed simultaneously. This competition can be cast in terms of resources. Accordingly, even though some executive processes rely on partly independent mechanisms, they share a common pool of resources. Therefore, when a given function is needed, resources devoted to one operation will not be available for other operations, and behavioral interference will ensue.
5.1. Emotion
5.1.1. Perceptual competition
How does affective significance influence visual processing? Researchers have described a projection system emanating from the amygdala that reaches nearly all levels of the ventral visual system. Although this system is often highlighted as the sole modulatory mechanism for visual processing, I propose that at least five other mechanisms need to be investigated as well. These mechanisms, which include both cortical and subcortical structures, involve network interactions that sculpt how visual signals evolve in response to the behavioral and affective significance of sensory stimuli.
One mechanism through which emotion may affect perception involves other valuation regions, most notably orbitofrontal cortex (Barrett & Bar Reference Barrett and Bar2009) and possibly the insula. The orbitofrontal cortex is important for the evaluation of sensory stimuli (Zald & Rauch Reference Zald and Rauch2007) and is reciprocally interconnected with visual cortex, especially the more anterior portions of the ventral stream (Barbas Reference Barbas1995; Cavada et al. Reference Cavada, Company, Tejedor, Cruz-Rizzolo and Reinoso-Suarez2000; Rempel-Clower & Barbas Reference Rempel-Clower and Barbas2000; Saleem et al. Reference Saleem, Kondo and Price2008). This region is thus capable of influencing responses in visual cortex based on affective value. A second mechanism involves the basal forebrain, whose terminals influence visual processing through the release of acetylcholine. For example, cholinergic mechanisms affect the competition between attended and unattended stimuli (Furey et al. Reference Furey, Pietrini and Haxby2000; Reference Furey, Pietrini, Haxby and Drevets2008). Several regions that participate in the evaluation of incoming inputs project to the basal forebrain, which is then able to modify information processing in visual cortex. Third, regions in lateral frontal cortex and parietal cortex are suggested to modulate visual processing according to an item's affective significance. In particular, both the frontal eye field and parietal cortex contain priority maps (Fecteau & Munoz Reference Fecteau and Munoz2006; Serences & Yantis Reference Serences and Yantis2006). To embed affective significance into priority maps, fronto-parietal regions work closely with regions such as the hypothalamus, amygdala, orbitofrontal cortex, and anterior insula, to prioritize processing based on the emotional value of a sensory stimulus (note that anatomical connectivity will not be direct in some cases; see Ch. 9). A fourth mechanism involves the pulvinar complex of the thalamus, whose importance for affective processing is a result not of its putative role as part of a subcortical pathway, but instead of its connectivity with other cortical regions (Pessoa & Adolphs Reference Pessoa and Adolphs2010). I have proposed that the pulvinar amplifies responses to stimuli of potential value to the organism during challenging sensory conditions (Padmala et al. Reference Padmala, Lim and Pessoa2010). A fifth potential mechanism was recently reported by Zikopoulos and Barbas (Reference Zikopoulos and Barbas2012), who described a pathway from the amygdala to the reticular nucleus of the thalamus and suggested that the connection is important for the capture of attention by emotion-laden stimuli. I anticipate that additional mechanisms beyond those described here will need to be considered, too.
5.2. Executive competition
Because emotion can either enhance or impair cognitive performance, to see how emotional content impacts executive control, we must consider at least two factors: the strength or arousal of the stimulus (or manipulation) and task relevance (see also Mather & Sutherland Reference Mather and Sutherland2011). When arousal is “low” and affective significance is task irrelevant, some interference with the main task may be observed and the behavioral effect will be typically small. When, however, arousal is “high” and the stimulus/manipulation is task irrelevant, resources are more fully diverted toward the processing of the emotional item and, because the mobilization of resources is more pronounced, the effects on behavior are greater (Lang et al. Reference Lang, Davis and Ohman2000; Panksepp Reference Panksepp1998). For example, in our investigation of cognitive-emotional interactions, Choi, Padmala, and I (Reference Choi, Padmala and Pessoa2012) observed that response conflict increased on trials with the possibility of shock, suggesting that the impact of emotion on behavior comes in part from the more vigorous recruitment of attentional/effortful control required to prioritize the processing of high-arousal items. Naturally, attentional/effortful control involves executive control resources and, because situations associated with high levels of arousal are expected to recruit some of these resources (see also Bishop Reference Bishop2007; Eysenck et al. Reference Eysenck, Derakshan, Santos and Calvo2007; Mathews & Mackinstosh Reference Mathews and Mackinstosh1998), interference with executive functions will ensue (Fig. 7A). The impact of emotion on performance thus occurs because of limited processing capacity and competition for common-pool resources.
Executive control, competition, and processing resources. (A-C) Processes are proposed to share resources called “common-pool resources” (smaller ellipses in gray), such that the engagement of one will detract from the processing of the other. Common-pool resources are necessary for general functions of attentional/effortful control. (A) High-arousal emotional stimuli recruit common-pool resources that allow their processing to be prioritized, thus detracting from other mechanisms sharing those resources. (B) These stimuli also trigger executive functions, such as updating, shifting, and inhibition, to handle the challenges to the organism, as indicated by the arrows emanating from attentional/effortful control. (C) Competition for resources during cognitive and emotional manipulations can, at times, produce push-pull–like interactions. Reproduced with permission from Pessoa (Reference Pessoa2009).

What about the situation when the emotional stimulus is task relevant? Here, two outcomes are possible. If the affective intensity is “low,” task performance might improve because control will be mobilized in the service of handling the task at hand, and the executive functions needed for task completion will more effectively compete for resources. In all, task performance will be enhanced. If, however, the affective intensity is sufficiently high, task performance might be compromised. Thus, in a study of response inhibition, my colleagues and I asked participants to perform a simple discrimination task but to withhold responding when they saw a stop signal (Pessoa et al. Reference Pessoa, Padmala, Kenzer and Bauer2012). We found that, when we used both fearful and happy faces as low-arousal stop signals, response inhibition was enhanced relative to neutral faces, but when we employed high-arousal emotional stimuli (previously paired with mild shock) as stop signals, response inhibition was impaired relative to neutral stimuli. Thus, inhibition performance was degraded even though emotional content was task relevant. We conjectured that processing the emotional stimulus consumed resources needed for inhibition.
5.3. Processing resources
Although the concept of resources invoked in accounts of the limits of information processing has been criticized in the past (e.g., Logan Reference Logan1988; Navon Reference Navon1984; Neisser Reference Neisser1976) and has not been mechanistically specified, further insight into it can be gained by examining brain regions sensitive to changes in task load, including the attentional network. Accordingly, researchers have probed attentional bottlenecks observed during tasks such as the attentional blink and the phenomenon known as the “psychological refractory period.” Based on these paradigms, Marois and colleagues have proposed the existence of a “unified” attentional bottleneck that involves several regions of the fronto-parietal attentional network (Tombu et al. Reference Tombu, Asplund, Dux, Godwin, Martin and Marois2011). If robust emotional manipulations indeed consume processing resources, then they should engage sites implicated as “bottleneck areas.” As described in section3, a compilation of activation peaks in aversive conditioning functional MRI studies revealed sites throughout the lateral and medial PFC, in addition to the anterior insula (Pessoa Reference Pessoa2009). Thus, attentional bottleneck regions are consistently recruited during emotion processing. If this recruitment prevents them from being adequately engaged when neutral task-related processing is required, we should expect to see behavioral impairments (see also Bishop et al. Reference Bishop, Duncan, Brett and Lawrence2004).
5.4. Triggering additional functions
A distinct impact of emotion is the result of its influence on specific resources. Dealing with an emotional stimulus requires the types of behavioral adjustments that characterize executive functions. For example, to refresh the contents of working memory, to switch the current task set, and to cancel previously planned actions might require updating, shifting, and inhibition, respectively. Such adjustments recruit specific resources required for emotional processing (Fig. 7B) and, if these resources are temporarily unavailable for the task at hand, behavioral performance will be compromised – the more so, the stronger the emotional manipulation (see below). An example may help to illustrate. Suppose a subject is performing a cognitive task and a change in background color signals that she or he will receive a shock sometime in the next 30 seconds. The subject might update the contents of working memory to include the “shock possible” information, shift between the execution of the cognitive task and “monitoring for shock” every few seconds, and, if another cue indicated that the shock would be delivered in the next second, inhibit a response to the cognitive task to prepare for the shock. In other words, dealing with the emotional situation necessitates the same types of executive functions that are considered to be the hallmark of cognition.
5.5. Cognitive-emotional interactions versus push-pull
The dual competition framework suggests that brain regions important for executive control are actively engaged by emotion. In contrast, push-pull studies have demonstrated reduced signals in some of these regions when emotional stimuli are shown. Hence, the two frameworks appear to make opposite predictions. The findings of Anticevic and colleagues (Reference Anticevic, Repovs and Barch2010) provide a potential clue as to when we might expect antagonistic interactions. Whereas, relative to neutral, negative distractors decreased responses in the dorsal-lateral PFC during the delay period of the working memory task, task-related distractors (stimuli similar to items to be remembered) actually increased responses, in much the way increases in working memory demand would. What explains this difference?
Dealing with the negative stimuli during the delay period produced a momentary “neglect” of the memory maintenance (Anticevic et al. Reference Anticevic, Repovs and Barch2010). In contrast, because neutral task-related distractors were so similar to the to-be-remembered items, participants may in effect have also held them in memory so as to avoid matching the final probe stimulus to a distractor. Consequently, the distractors may actually have increased working memory load. I therefore suggest that cognitive-emotional push-pull interactions are related to a type of competition that directs processing away from the concurrently executed main task, thereby producing decreased activation (in relative terms) in some of the key frontal and parietal regions underlying the task at hand (Fig. 7C). Which is to say, deactivations are the result of competitive interactions between resources required for executive functions. As such, they should be understood not in terms of a mutually suppressive relationship between emotion and cognition, but in terms of executive competition.
5.6. Neural interactions
Cognitive-emotional interactions rely on the communication between “task networks” (e.g., the attentional network during attention tasks) and “valuation networks,” which involve both subcortical regions, such as hypothalamus and amygdala, and cortical ones, such as orbitofrontal cortex, anterior insula, and medial PFC. These interactions are suggested to take place via multiple forms of communication (Fig. 8).
Modes of interaction between cognitive and emotion/motivation networks. (1) Interactions rely on hub regions, such as those in the dorsal-medial prefrontal cortex, which are part of both attentional and motivational networks (hub region in the slice and gray node in the cortical valuation network). (2) In addition, specific regions may link the two networks, either directly or via the thalamus. (3) Finally, motivational signals are further embedded within cognitive mechanisms through the action of diffuse neuromodulatory systems. Key: ant., anterior; NAcc, nucleus accumbens; OFC, orbitofrontal cortex; PCC, posterior cingulate cortex; PFC, prefrontal cortex; SN, substantia nigra; VTA, ventral tegmental area. Reproduced with permission from Pessoa and Engelmann (Reference Pessoa and Engelmann2010).

First, direct pathways connect task and valuation networks. One example is the pathway between orbitofrontal and lateral PFC (Barbas & Pandya Reference Barbas and Pandya1989). Other examples are the pathways between the extensively interconnected lateral surface of the PFC (including dorsal-lateral PFC) and all cingulate regions (Morecraft & Tanji Reference Morecraft, Tanji and Vogt2009). A second type of communication relies on “hub” regions at the intersection of task and valuation networks – hubs are highly connected and central regions that play a key role in information communication between different parts of a network.
What are some of the hub regions? Dorsal-medial PFC plays a prominent role as “common node” of executive and emotional networks because of its participation in integrating inputs from diverse sources, notably cognitive and affective ones (e.g., Devinsky et al. Reference Devinsky, Morrell and Vogt1995; Fig. 8). This region is involved in multiple executive functions, such as conflict detection, error likelihood processing, and error monitoring (Alexander & Brown Reference Alexander and Brown2011). As reviewed in section3, the dorsal-medial PFC is also reliably engaged during conditions involving negative affect (see Fig. 3), as are all sectors of the anterior-medial PFC.
A second hub region, the anterior insula, is important for interoception (Craig Reference Craig2002; Reference Craig2009). Moreover, threat, uncertainty, and risk are all factors that engage the anterior insula (Singer et al. Reference Singer, Critchley and Preuschoff2009), which is also reliably recruited by cognitive processes (Craig Reference Craig2009; Van Snellenberg & Wager Reference Van Snellenberg, Wager, Christensen, Goldberg and Bougakov2010). Indeed, in a recent analysis of the functional diversity of brain regions (see sect. 7.4 and Fig. 14), the anterior insula emerged as one of the most diverse in the brain (Anderson et al. Reference Anderson, Kinnison and Pessoa2013; see also Uddin et al. Reference Uddin, Kinnison, Pessoa and Anderson2013). In all, the dorsal-medial PFC and anterior insula provide substrates for ample cognitive-emotional integration that, in broad terms, include both bodily “input” and “output” signals (roughly, via anterior insula and dorsal-medial PFC, respectively). Of course, these regions do not work in isolation. During cognitive-emotional interactions, they interact with the lateral PFC and parietal cortex, for example (Fig. 8).
A third type of communication depends on the diffuse action of neuromodulatory systems, including the action of dopamine and norepinephrine. Widespread modulatory connections originating from these systems reach large portions of the cortical surface and multiple subcortical areas, from which they are able to rapidly influence brain responses during emotional situations (Arnsten Reference Arnsten2009; Panksepp Reference Panksepp1998).
6. Motivation
The framework of the dual competition model described thus far for the case of negative emotion also describes how motivation influences perceptual and executive competition. This applies to situations in which individuals work for a potential reward, as well as paradigms in which an item acquires motivational significance by being paired with reward.
6.1. Perceptual competition
How does motivational significance influence sensory processing? Several of the circuits described in the context of emotion operate in the case of motivation, too. Notably, the interactions between valuation networks and fronto-parietal regions important for attentional control are engaged by both emotion and motivation. An illustration of the latter was described in the response-conflict study reviewed previously (see Fig. 4 and Fig. 5). One of the differences between emotion and motivation is that at times the interactions will involve different valuation regions, say, the amygdala in the case of emotion and the accumbens in the case of motivation. Yet, the general form of the interaction is similar. Which is to say, items of affective/motivational significance will redirect the flow of signals such that their processing is favored. I further propose that mechanisms involving the basal forebrain and the pulvinar operate for both emotion and motivation. More generally, despite the considerable differences between basal forebrain, pulvinar, and fronto-parietal mechanisms, each shapes, say, visual perception by altering competition in visual cortex. Thus, the idea is that their respective pathways may be engaged both during emotional and motivational conditions. Once they are engaged, the downstream effects on visual processing (and elsewhere) may be the same for both types of manipulation. A corollary of this notion is that priority maps (Awh et al. Reference Awh, Belopolsky and Theeuwes2012; Baluch & Itti Reference Baluch and Itti2011; Fecteau & Munoz Reference Fecteau and Munoz2006; Serences & Yantis Reference Serences and Yantis2006; Wolfe Reference Wolfe1994) – containing representations of spatial locations that are behaviorally important – incorporate signals as a result of an item's affective and motivational significance.
6.2. Executive competition
Motivation influences executive competition, too, and section 4 described examples during response-conflict, task switching, and working memory. Two effects of motivation on executive function are proposed here. First, motivation sharpens executive functions by enhancing them or by making them more efficient (Fig. 9). An illustration of this effect was the working memory study by Kobayashi and colleagues (Reference Kobayashi, Lauwereyns, Koizumi, Sakagami and Hikosaka2002) in which reward increased the amount of transmitted information regarding the item being maintained in memory. Second, motivation reallocates resources available to executive functions, increasing the likelihood of reward attainment by improving performance (Fig. 9). For example, in the study by Jimura and colleagues (Reference Jimura, Locke and Braver2010) brain responses appeared to reflect a shift toward a proactive control strategy that was beneficial to performance. Motivation can thus be viewed, at times, as reallocating resources to prioritize implementation of the rewarded task component at the expense of unrewarded components (Fig. 7C) (which at times can lead to deleterious performance effects; Padmala & Pessoa Reference Padmala and Pessoa2010).
Executive control and reward. Motivation is proposed to have two key effects on executive function: first, it fine-tunes executive functions that are important for the task at hand (represented by the change of shape of the updating function; see solid arrow); and, second, it redistributes the allocation of common-pool resources (gray ellipse; see dashed arrow), and thus modulates how executive processes compete with each other. Reproduced with permission from Pessoa (Reference Pessoa2009).

6.3. Neural interactions
The same general architecture for cognitive-emotional interactions is proposed to underlie cognitive-motivational interactions (Fig. 8). In particular, the interactions between valuation networks and fronto-parietal regions important for attention and executive control are suggested to be common to both emotion and motivation. Subcortical reward/valuation regions include the caudate (particularly more ventral portions), nucleus accumbens, midbrain, and the amygdala; and cortical regions include orbitofrontal cortex, anterior insula, medial PFC, and posterior cingulate cortex.
Hub regions also play a central function during interactions between cognition and motivation. For example, Mesulam and colleagues suggested that posterior cingulate cortex is important for the integration of motivational and spatial attention information (Mohanty et al. Reference Mohanty, Gitelman, Small and Mesulam2008; Small et al. Reference Small, Gitelman, Simmons, Bloise, Parrish and Mesulam2005; see also Platt & Huettel Reference Platt and Huettel2008). Another key hub region is medial the PFC (including the dorsal PFC), already discussed in the context of emotion. Indeed, multiple sources of evidence demonstrate that the medial PFC is a critical component of the motivational system (see Summerfield & Koechlin Reference Summerfield and Koechlin2009; Vogt Reference Vogt2008; Walton et al. Reference Walton, Rudebeck, Bannerman and Rushworth2007). Shackman and colleagues (Reference Shackman, Salomons, Slagter, Fox, Winter and Davidson2011) proposed that the dorsal-medial PFC implements domain-general processes of adaptive control, based on the region's extensive contributions to cognitive control, negative affect, and nociception. I suggest that the proposal should be extended to incorporate motivation as well, which is to say, that dorsal-medial prefrontal context implements motivated adaptive control – where “motivated” is understood to include emotional processing. The anterior insula has been repeatedly implicated during the processing of negative events (Paulus & Stein Reference Paulus and Stein2006; Simmons et al. Reference Simmons, Strigo, Matthews, Paulus and Stein2006). But a growing number of studies implicate it during appetitive conditions (Liu et al. Reference Liu, Hairston, Schrier and Fan2011a; Mizuhiki et al. Reference Mizuhiki, Richmond and Shidara2012; Naqvi & Bechara Reference Naqvi and Bechara2009; Padmala & Pessoa Reference Padmala and Pessoa2011; Samanez-Larkin et al. Reference Samanez-Larkin, Gibbs, Khanna, Nielsen, Carstensen and Knutson2007). Here, I propose that the anterior insula is a chief hub region for cognition-motivation interactions.
As in the case of emotion, a third mode of communication involves the widespread action of neuromodulatory signals, including those of dopamine and acetylcholine. It is possible that dopaminergic and cholinergic neuromodulation provide a key mechanism by which motivation sharpens executive control (and hence behavioral performance), for example, by improving the signal-to-noise ratio of relevant neurons (e.g., Goldman-Rakic et al. Reference Goldman-Rakic, Leranth, Williams, Mons and Geffard1989). Motivation thus enhances processing efficiency in target cortical and subcortical regions.
6.4. “Resources”: Linking human and animal literatures
The dual competition model employs the admittedly vague concept of “resources.” One way in which a more mechanistic account can be formulated is to build on the extensive literature of motivation in nonhuman animals. Redgrave and colleagues (Redgrave & Gurney Reference Redgrave and Gurney2006; Redgrave et al. Reference Redgrave, Prescott and Gurney1999) have proposed that dopamine-related circuits in the striatum facilitate the reallocation of limited processing capacity toward unexpected events of behavioral significance, including rewarding ones. Thus, instead of simply providing a “reward signal,” striatal activation drives the redistribution of available resources to salient events whose processing is then prioritized (see also Horvitz Reference Horvitz2000; Zink et al. Reference Zink, Pagnoni, Martin-Skurski, Chappelow and Berns2004). Furthermore, Sarter et al. (Reference Sarter, Gehring and Kozak2006) propose that increased prefrontal cholinergic activity contributes to the recruitment of goal-driven mechanisms (see also Sarter et al. Reference Sarter, Hasselmo, Bruno and Givens2005), which depend on fronto-parietal regions, act to enhance sensory processing and to attenuate interference effects.
6.5. Mechanisms of motivational effects: Conceptual issues
Disentangling the contributions of cognition and motivation to neural signals is far from easy, especially when experiments involve goal-directed task manipulations. For example, in human studies, subjects may be instructed that a potential reward will result following a cue stimulus if their performance is both fast and accurate. In such cases, increased brain signals may reflect enhanced attention because subjects are more likely to engage attention when a reward is at stake. But whether the increased signals actually reflect greater attention is another matter, an issue Maunsell described forcefully in the context of monkey physiology studies of attention:
When the effects of spatial attention are examined, subjects are motivated to direct attention to one location or another only by expectations about which location is more likely to be associated with a reward.… Such reward manipulations reliably lead to shifts in attention … However, these experiments typically provide no basis for assigning changes preferentially to attention or to expectations about reward. In most cases, attention-related modulation could equally well be described in terms of expectation about rewards because the two are inextricably confounded. (Maunsell Reference Maunsell2004, pp. 262–63)
Maunsell's point raises the broader issue of the relationship between motivation and cognition. One possibility is that motivation has effects that take place independently of cognition (Fig. 10A). A second is that motivation modulates behavior by engaging the same functions that are used by cognition, in which case, the impact of motivation on behavior could be described as “mediated by cognition” (Fig. 10B). This mediation could be partial only, such that both direct (motivation-to-behavior) and indirect (motivation-via-cognition-to-behavior) effects take place. A third possibility is that cognition and motivation are more intertwined, such that they jointly guide behavior (Fig. 10C), in which case, although certain processes could be described as “cognitive” and others as “motivational,” the interactions between them are sufficiently strong that their separation is more semantic than real. See Chelazzi et al. (Reference Chelazzi, Perlato, Santandrea and Della Libera2013) for a related discussion.
Three models of the relationships between attention and motivation. (A) In the parallel model, attention and motivation have independent effects on behavior. (B) In the mediation model, the influence of motivation on behavior is mediated via attentional systems. (C) In the integration model, attentional and motivational systems interact so strongly they cannot be decomposed. Adapted with permission from Pessoa and Engelmann (Reference Pessoa and Engelmann2010).

The situation Maunsell describes thus could be portrayed in terms of the mediation model (B): Mechanistically, effects of attention are obtained via “attentional circuits.” Whereas this relationship would presumably indicate that such motivational effects are less interesting, l argue that how motivation recruits “cognitive” circuits is as important as which circuits it recruits. Indeed, I suggest that the major issue is conceptual, and that by using separate boxes for “attention” and “motivation,” the models of Figure 10 describe motivation in an impoverished way. As in the case of emotion and cognition (Pessoa Reference Pessoa2008), I propose that it is counterproductive to carve the brain into “attention” (or “cognition”) and “motivation.” Chapters 6 and 7 outline how motivational signals are embedded into cognition (and perception) through multiple mechanisms. In this manner, the “inextricably confounded” relationship described by Maunsell (Reference Maunsell2004) ceases to be a problem and can be seen as a property of brain organization (see also sect. 7.2).
7. Network perspective on brain function
The type of embedding of emotional and motivational signals into perception and cognition (e.g., Grossberg Reference Grossberg1982 necessitates a network perspective of brain organization. Thus, the network itself is the unit, not the brain region. Processes P that support behavior are not implemented by an individual area, but rather by the interaction of multiple areas, which are dynamically recruited into multiregion assemblies.
7.1. Overlapping networks
Commonly, networks are described in terms of unique, nonoverlapping sets of brain regions (Fig. 11A). But this assumes that brain areas compute a specific function, one that is perhaps elementary and needs other regions to be “actualized,” but nonetheless is well defined. I propose that networks contain overlapping regions, such that specific areas will belong to several intersecting networks (Mesulam Reference Mesulam1990). In this manner, the processes carried out by an area will depend on its network affiliation at a given time. What determines a region's affiliation? For this, the importance of the context within which a brain region is operating must be considered (McIntosh Reference McIntosh2000). For example, in Figure 11B, region An will be part of network N1 during a certain context Ck, but will be part of network N2 during another context Cl. The existence of context-dependent, overlapping networks also means that from the perspective of structure-function mappings summarized in Figure 11B, a given region will participate in multiple processes. In addition, the importance of context emphasizes the need to consider dynamic aspects of structure-function relationships. A network needs to be understood in terms of the interactions between multiple brain regions as they unfold temporally. In the extreme, two networks may involve the exact same regions interacting with each other in distinct ways across time.
Structure-function mapping and networks. (A) The “landscape of behavior” depicts the multidimensional space of behaviors. A1, A2, An, B1, and Bn=brain regions; N1 and N2=networks; Pi and Pj=processes. (B) Intersecting networks. The networks Ck and Cl (and the additional ones) intersect at node An. (C) Dynamic aspects. Because region An will have network affiliations that vary as a function of time, the processes carried out by the emerging networks will evolve across time and lead to dynamic “landscapes of behavior.” The four time points represented are such t1 is close to t2 but far from t3 and t4, which are close to each other. (D) Structure-function mappings in the case of networks. Two networks may instantiate similar processes, a case of many-to-one mapping. The reverse relationship is also suggested to apply to networks, namely, one-to-many mappings. Reproduced with permission from Pessoa (Reference Pessoa2013).

Though simple, the “multiple affiliation” point is sufficiently important to merit an example. Consider the case of the amygdala. Even a simplified view of its anatomical connectivity shows that, minimally, it belongs to three networks. The first is a “visual network,” as the amygdala receives fibers from anterior parts of temporal cortex. The amygdala, by its turn, influences visual processing via a set of projections that reach most of ventral occipito-temporal cortex. The second is the well-known “autonomic network,” as evidenced by connectivity with subcortical structures such as the hypothalamus and periaqueductal gray, among others. Via this network, the amygdala participates in the coordination of many complex autonomic mechanisms. The third is a “value network,” as evidenced by its connectivity with the orbitofrontal cortex and medial PFC. In total, the amygdala affiliates with different sets of regions (“networks”) in a highly flexible and context-dependent manner. Many other examples of this dynamic affiliation idea exist, including the fronto-parietal cortex, whose regions affiliate with others based on task demands (Cole et al. Reference Cole, Reynolds, Power, Repovs, Anticevic and Braver2013).
Two issues deserve further consideration here. First, when describing networks, the term process is preferable to function. One reason is that a process emerges from the interactions between regions – it is thus an emergent property (see Bressler & Menon Reference Bressler and Menon2010). Furthermore, a process is viewed as a useful external description of the operation of the network, and not necessarily as a fixed internal computation implemented by the network (Thompson Reference Thompson2007; Thompson & Varela Reference Thompson and Varela2001; Varela et al. 1992; cf. Lindquist & Barrett Reference Lindquist and Barrett2012).
A second – and critical – issue is whether utilizing networks solves the many-to-many mapping problem we face when considering regions as the unit of interest. In other words, does a description of structure-function relationships in terms of networks allow for a one-to-one mapping? For example, in the context of the salience network, Menon, Uddin, and colleagues note that “to determine whether this network indeed specifically performs this function will require testing and validation of a sequence of putative network mechanisms” (Bressler & Menon Reference Bressler and Menon2010, p. 285; see also Moussa et al. Reference Moussa, Vechlekar, Burdette, Steen, Hugenschmidt and Laurienti2011). The prospect of simpler structure-function relationships (hence less context dependent) is discussed by Buckner and colleagues when describing regions of high connectivity: “An alternative possibility is that the hubs reflect a stable property of cortical architecture that arises because of monosynaptic and polysynaptic connectivity. Within this alternative possibility, the same hubs would be expected to be present all of the time, independent of task state” (Buckner et al. Reference Buckner, Sepulcre, Talukdar, Krienen, Liu, Hedden, Andrews-Hanna, Sperling and Johnson2009 pp. 1867–68; emphasis mine).
Unfortunately, the attempt to map structure to function in a one-to-one manner in terms of networks will be fraught with some of the difficulties encountered when considering individual brain regions (Ch. 8). To be true, the problem is ameliorated, but the mapping is still highly complex. For example, two distinct networks may generate similar behavioral profiles (Fig. 9D; many-to-one); a given network will also participate in several behaviors (one-to-many). Broadly speaking, a network's operation will depend on several more global variables, namely an extended context that includes the state of several “neurotransmitter systems,” arousal, slow wave potentials, and so forth. In other words, a network that is solely defined as a “collection of regions” is insufficient to eliminate the one-to-many problem. What if we extend the concept of a network with these additional variables? For example, Cacioppo and Tassinary (Reference Cacioppo and Tassinary1990) suggest that psychological events can be mapped to physiological ones in a more regular manner by considering a spatiotemporal pattern of physiological events. The notion of a network is thus extended to incorporate other physiological events, for example, the state of a given neurotransmitter (as in the elegant work by Marder and colleagues; see Marder & Goaillard Reference Marder and Goaillard2006). How extensive does this state need to be? Clearly, the usefulness of this strategy in reducing the difficulties entailed by many-to-many mappings will depend on how broad the context must be (Thompson Reference Thompson2007).
7.2. An example: Cognitive-motivation interactions
Graph-theoretical analysis of functional neuroimaging data has focused almost exclusively on characterizing the large-scale properties of resting-state data (Bullmore & Sporns Reference Bullmore and Sporns2009; Wang et al. Reference Wang, Zuo and He2010). In a recent study, we sought instead to understand the network properties of a focused set of brain regions during task conditions engaging them (Kinnison et al. Reference Kinnison, Padmala, Choi and Pessoa2012). In particular, we analyzed the data of the response-conflict task discussed previously (Fig. 4 and Fig. 5; Padmala & Pessoa Reference Padmala and Pessoa2011). At the network level, global efficiency (a measure of integration) increased and decomposability (a measure of how easily a network can be divided in terms of smaller subnetworks or “communities”) decreased (Fig. 12). In other words, the network became less segregated with reward, revealing that one way in which a reward cue affects brain responses is by increasing functional connections across brain regions. From the vantage point of a single region, the changes in functional connectivity can be quite broad and can be characterized via a functional connectivity fingerprint (see Passingham et al. Reference Passingham, Stephan and Kotter2002). For example, the caudate (Fig. 6C) and the nucleus accumbens showed increases in functional connectivity to nearly all cortical regions that were driven by reward, reinforcing the notion of “embedding” described earlier. Finally, this example underscores the need to move beyond simple pairwise relationships between regions to a multivariate representation of the changes in functional connectivity that underlie network reorganization.
Network structure and reward. (A) Community detection was applied to the set of brain regions that responded more strongly to reward than to no-reward context at the cue phase. Two communities were detected. (B) Comparison of the pattern of connectivity between reward and no-reward contexts revealed increases during the former, mostly between the two communities, reflecting increased integration with reward. Adapted with permission from Anderson et al. (Reference Bilder, Sabb, Parker, Kalar, Chu, Fox, Freimer and Poldrack2013).

7.3. Issues when considering networks
If we are to use networks to understand structure-function mappings, then we must consider several issues. I briefly describe them here (see also Pessoa Reference Pessoa2014).
7.3.1. “Importance”: Structural and functional embedding
A network framework moves the unit of analysis away from brain regions and distributes it across them. This does not mean that regions provide equal contribution to specific behaviors, of course. That being the case, devising ways to characterize a region's importance is of great interest. This section builds on a recent discussion by Vlachos and colleagues (Reference Vlachos, Aertsen and Kumar2012), who considered this question in the context of neurons.
What determines the importance of a region to a given computation? One strategy is to consider its degree of structural embeddedness and functional embeddedness. The former refers to the way elements are physically embedded in their surrounding; the latter is the influence elements have on the activity of other elements, which depends on structural embeddedness, in addition to other synaptic and cellular properties, ongoing activity, neuromodulators, and so forth. Regions (that is, nodes) with high connectivity (that is, high degree) have the potential to be influential, particularly if they function like connector hubs (Guimera & Nunes Amaral Reference Guimera and Nunes Amaral2005). Counterintuitively, however, in some circumstances the most highly connected nodes of a network are not the most influential (Kitsak et al. Reference Kitsak, Gallos, Havlin, Liljeros, Muchnik, Stanley and Makse2010; see also Liu et al. Reference Liu, Slotine and Barabasi2011b). Instead, the most prominent nodes are those located within the core of the network. In other words, they belong to a topologically central subnetwork. Hence, one way to measure embeddedness is to determine nodes that exhibit the property of centrality (Newman Reference Newman2010). In general, however, no single measure will perfectly capture influence or importance because different measures will convey different aspects of network organization. Indeed, multiple measures of centrality have been proposed (Rubinov & Sporns Reference Rubinov and Sporns2010) and generate different results (Zuo et al. Reference Zuo, Ehmke, Mennes, Imperati, Castellanos, Sporns and Milham2012). Therefore, a combination of different metrics will provide a better measure of embeddedness and, better still, how a node affects network properties (Liu et al. Reference Liu, Slotine and Barabasi2011b; Modha & Singh Reference Modha and Singh2010; Vlachos et al. Reference Vlachos, Aertsen and Kumar2012); see also Power et al. (Reference Power, Schlaggar, Lessov-Schlaggar and Petersen2013).
A further issue relates to communicability in complex networks (Estrada & Hatano Reference Estrada and Hatano2008). Many important measures that characterize networks are based on the shortest paths connecting two nodes, including the determination of communities. Counterintuitively, as described by Estrada and Hatano (Reference Estrada and Hatano2008), “information” can in fact spread along paths that are not the shortest (see also Borgatti Reference Borgatti2005; Newman Reference Newman2005). This has implications for the understanding of brain networks because direct anatomical connectivity is frequently emphasized as the chief mode of communication between brain regions. The notion that communicability does not necessarily rely on shortest paths reminds us of the need to obtain network-level properties in describing the flow of signals in neural networks. It also highlights the need to characterize functional connectivity between regions, which does not uniquely depend on direct anatomical connections (see Adachi et al. Reference Adachi, Osada, Sporns, Watanabe, Matsui, Miyamoto and Miyashita2012).
7.3.2. The importance of weak connections
Here, I critique another component of the “standard” network view, which can be summarized as follows: Network states depend on strong structural connections; conversely, weak connections have a relatively minor impact on brain states.
Schneidman and colleagues (Reference Schneidman, Berry, Segev and Bialek2006) recorded simultaneously from 40 cells in the salamander retina. Although some pairs of cells had very strong correlations, most correlations were weak. Importantly, the findings demonstrated that weak pairwise correlations are capable of generating strongly correlated network states. The lesson learned here is that weak connections cannot be disregarded when the goal is to understand network states. Now consider that most studies of large-scale networks based on structural and functional data disregard weak connections. In fact, in resting-state functional connectivity studies, researchers typically assign connections with weak correlations (say<.3) a value of zero (no connection) (e.g., Meunier et al. Reference Meunier, Achard, Morcom and Bullmore2009). Although more studies are evidently needed to examine the implications of weaker connections to brain architecture, their importance is unlikely to be restricted to cells in the salamander retina. For example, Bassett and colleagues (Reference Bassett, Wymbs, Porter, Mucha, Carlson and Grafton2011) studied the dynamic reconfiguration of human brain networks during learning and uncovered several clusters of brain regions that remained integrated with one another by a complex pattern of weak functional interconnections.
7.4. Understanding a region's function via multidimensional profiles
If brain regions are engaged in many processes based on the networks they are affiliated with in particular contexts, they should be engaged by a range of tasks. Although this introduces outstanding problems, the availability of data repositories containing the results of thousands of neuroimaging studies provides novel opportunities for the investigation of human brain function (Yarkoni et al. Reference Yarkoni, Poldrack, Van Essen and Wager2010).
Like others (e.g., Robinson et al. Reference Robinson, Laird, Glahn, Blangero, Sanghera, Pessoa, Fox, Uecker, Friehs, Young, Griffin, Lovallo and Fox2012), my colleagues and I recently employed a data-driven approach to investigate the functional repertoire of brain regions based on a large set of human functional MRI studies (Anderson et al. Reference Anderson, Kinnison and Pessoa2013). We characterized the function of brain regions in a multidimensional manner via their functional fingerprint (Passingham et al. Reference Passingham, Stephan and Kotter2002), namely, the relative degree of engagement of the region across a range of task domains (Fig. 13, top); the approach was extended to networks, too (Fig. 13, bottom). Based on the fingerprints, we calculated a diversity index to summarize the degree of functional diversity; a brain region with high diversity would be one engaged by tasks in many domains, whereas a low-diversity region would be engaged by a few domains. We found that diversity varied considerably across the brain (Fig. 14).
Functional fingerprints of regions and networks. (Top) Polar plots illustrate the fingerprints of three brain regions. Each vertex corresponds to one of the domains investigated. Both the left anterior insula and the left intraparietal sulcus exhibited diverse functional profiles. The superior temporal gyrus in the vicinity of auditory cortex was less diverse, although the fingerprint revealed its involvement in emotional processing, in addition to audition. (Bottom) Polar plots illustrate the fingerprints of two brain networks, which were defined by Toro and colleagues (Reference Toro, Fox and Paus2008) based on a meta-analysis of task activation data. The frontal-parietal “attention” network was a task-positive network generated by “seeding” the left intraparietal sulcus. The cingulate-parietal “resting-state” network was a task-negative network generated by “seeding” ventral-anterior medial prefrontal cortex. Although both networks are quite diverse, the analysis revealed that they are fairly complementary to one another. Adapted with permission from Anderson et al. (Reference Bilder, Sabb, Parker, Kalar, Chu, Fox, Freimer and Poldrack2013).

Functional diversity map. Areas of higher functional diversity are shown in warm colors, and areas of lower diversity are shown in cool colors (color bar represents diversity Shannon entropy values). Locations without colors did not have sufficient findings for the estimation of diversity. Adapted with permission from Anderson et al. (Reference Bilder, Sabb, Parker, Kalar, Chu, Fox, Freimer and Poldrack2013).

Our findings suggest that brain regions are very diverse functionally, in line with the points raised by Poldrack (Reference Poldrack2006; Reference Poldrack2011). Beyond the descriptive aspects of the approach, it outlines a framework in which a region's function is viewed as inherently multidimensional: Avector defines the fingerprint of a region in the context of a specific domain structure. Although the domain that we explored used a task classification scheme from an existing database, it was not the only one possible. How should one define the domain structure? One hope is that cognitive ontologies can be defined that meaningfully carve the “mental” into stable categories (Bilder et al. Reference Bilder, Sabb, Parker, Kalar, Chu, Fox, Freimer and Poldrack2009; Price & Friston Reference Price and Friston2005). I contend, however, that no single ontology will be sufficient. Instead, it is better to conceive of several task domains that are useful and complementary in characterizing brain function and/or behavior. Thus, a region's functional fingerprint needs to be understood in terms of a family of (possibly related) domains. Finally, the framework can be extended to networks, provides a way to compare them as described next, and to advance our understanding of the properties of constituent nodes (see Anderson et al. Reference Anderson, Kinnison and Pessoa2013).
7.5. Comparing brain networks
In several instances, investigators have proposed closely related networks (for example, “dorsal attention” and “executive control”), raising the possibility that they could be closely related, or possibly the same except for a change in label. Thus, developing tools that help characterize and understand brain networks is of great relevance and could help reveal principles of organization.
With this in mind, we asked the following question (Anderson et al. Reference Anderson, Kinnison and Pessoa2013): What is the relationship of the functions of regions belonging to a given network? One approach is to evaluate how homogeneous fingerprints are in a network. In other words, are fingerprints from the regions of network X more similar to each other than to those of regions from network Y? In our investigation, we chose to not investigate a unique set of networks, but instead considered possibly related (or even closely related) networks defined by different research groups and approaches, including meta-analysis, resting-state, and task-based approaches. To contrast brain networks to each other in terms of the functional fingerprints of the component regions, we employed a multivariate test based on “statistical energy” (Aslan & Zech Reference Aslan and Zech2005). Interestingly, several network pairs were found to be only modestly distinct (e.g., dorsal and ventral attention networks). Moreover, some of the networks that have been distinguished from one another in the past were not strongly distinct (e.g., the fronto-parietal “adjust control” network and the cingulo-opercular “maintain task set” network described by Dosenbach and colleagues Reference Dosenbach, Fair, Cohen, Schlaggar and Petersen2008).
We also evaluated the assortativity of the regions within networks, where assortativity refers to the tendency of “like to connect with like” (e.g., Christakis & Fowler Reference Christakis and Fowler2007). Functional fingerprints within an assortative network would be relatively similar to each other and relatively dissimilar to fingerprints from other networks. Interestingly, we observed several levels of assortativity, suggesting that existing networks are composed of nodes whose functional repertoire varies in their homogeneity. In fact, one version of the task-negative network tended to be disassortative, namely, its regions tended to be more dissimilar to each other than to those of other networks, consistent with the notion that task-negative networks are relatively heterogeneous (Andrews-Hanna et al. Reference Andrews-Hanna, Reidler, Sepulcre, Poulin and Buckner2010).
8. Conclusions
As I reflect on the network perspective described in chapter 8, five significant implications come to mind. First, given the extensive interactions between brain territories, emphasis shifts from attempting to understand the brain a region at a time to characterizing how coalitions of regions support the mind-brain. And because brain regions are not the unit of interest, they should not be viewed as “cognitive” or “emotional.” This stands in sharp contrast to the traditional view, which sees regions whose function involves homeostatic processes or bodily representations as emotional, and those less aligned with such operations as cognitive.
Second, considered from the network perspective, the architectural features of the brain provide massive opportunity for cognitive-emotional integration, encompassing all brain territories. For example, extensive communication between the amygdala and visual cortex exists. Thus, visual processing takes place within a context that is defined by signals occurring in the amygdala and related brain regions (e.g., orbitofrontal cortex), including those linked to affective significance. In this sense, vision is never pure, but only affective vision. A similar point can be made for other sensory modalities. Cognitive-emotional interactions also abound in the PFC, which is commonly described with reference to abstract processes. More generally, given inter-region interactivity, and the fact that networks intermingle signals of diverse origin, although a characterization of brain function in terms of networks is still needed, the networks themselves are best thought of as neither “cognitive” nor “emotional.”
Third, regions traditionally viewed as central for affective processing appear to be extremely well connected (Ch. 9), which suggests that they have at times important “near-global” roles and that this may be a central feature of their class. But they are not the only regions with high connectivity: We encounter highly connected regions throughout the brain, including occipital, temporal, parietal, and frontal lobes, in addition to insula, cingulate, thalamus, and other regions at the base of the brain.
Fourth, the network perspective reminds us that emphasizing only interactions between brain regions that are connected by direct, robust structural connections is misleading. The strength of functional connectivity is equally important and at times (frequently?) will deviate from the strength of the structural connection. Architectural features guarantee the rapid integration of information even when strong structural connections are not present – and support functional interactions that will vary based on context. A case in point is illustrated by the “one-step” property of amygdala–PFC connectivity (i.e., amygdala signals reach nearly all prefrontal regions within a single connectivity step in the PFC), which allows the amygdala to engage in functional interactions with lateral PFC regions not heavily connected to it (see Averbeck & Seo Reference Averbeck and Seo2008).
And, fifth, the insights gained from adopting a network perspective suggest that the mind-brain is not decomposable in terms of emotion (or motivation) and cognition. In other words, the neural basis of emotion and cognition should be seen as governed less by properties that are intrinsic to specific sites and more by interactions among multiple brain regions. In this sense, emotion and cognition are functionally integrated systems, namely, they continuously impact each other's operations.
ACKNOWLEDGMENT
The author is grateful for support from the National Institute of Mental Health (MH071589).
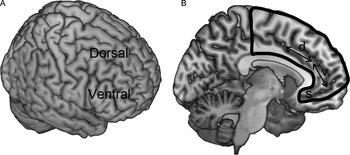
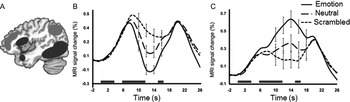
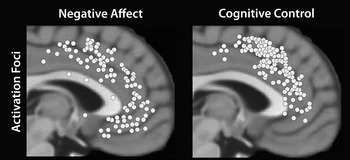
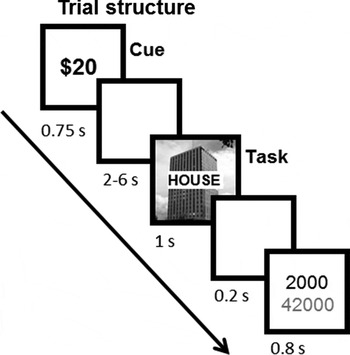
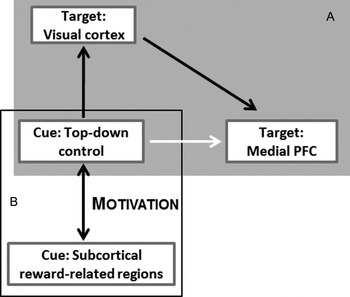
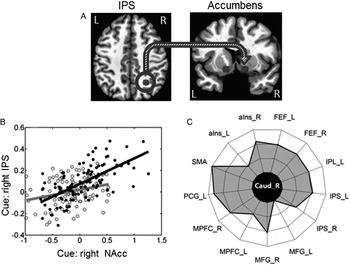
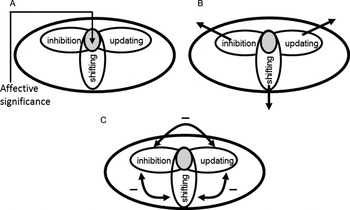
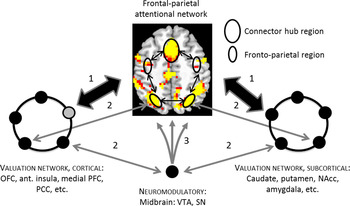
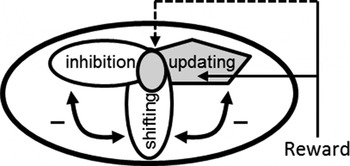

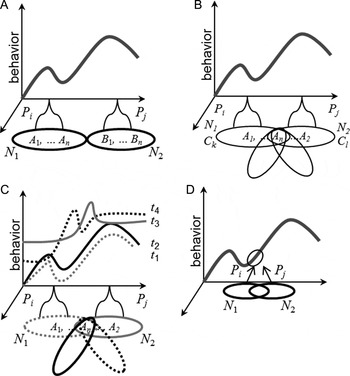
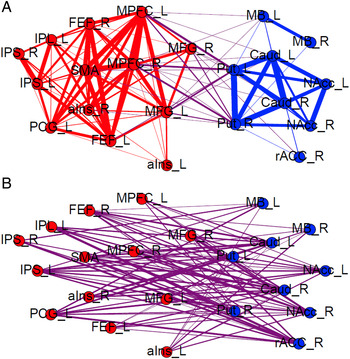
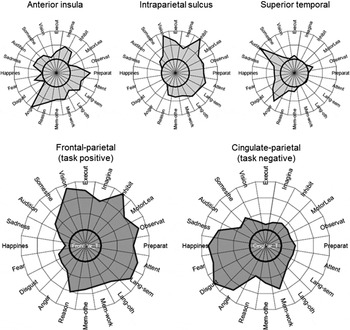
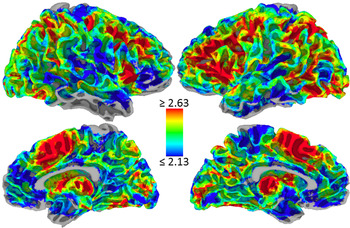



Target article
Précis on The Cognitive-Emotional Brain
Related commentaries (19)
Active inference and cognitive-emotional interactions in the brain
Behavioral evidence for a continuous approach to the perception of emotionally valenced stimuli
Cognition as the tip of the emotional iceberg: A neuro-evolutionary perspective
Enactive neuroscience, the direct perception hypothesis, and the socially extended mind
How arousal influences neural competition: What dual competition does not explain
Integration of cognition and emotion in physical and mental actions in musical and other behaviors
Models for cognition and emotion: Evolutionary and linguistic considerations
Neuropsychology still needs to model organismic processes “from within”
On emotion-cognition integration: The effect of happy and sad moods on language comprehension
On theory integration: Toward developing affective components within cognitive architectures
Precision about the automatic emotional brain
Preferences and motivations with and without inferences
Social theory and the cognitive-emotional brain
Strengthening emotion-cognition integration
Surprise as an ideal case for the interplay of cognition and emotion
The cognitive-emotional brain is an embodied and social brain
The cognitive-emotional brain: Opportunitvnies and challenges for understanding neuropsychiatric disorders
United we stand, divided we fall: Cognition, emotion, and the moral link between them
When emotion and cognition do (not) work together: Delusions as emotional and executive dysfunctions
Author response
The cognitive-emotional amalgam