


%20--%3e%3c!DOCTYPE%20svg%20PUBLIC%20'-//W3C//DTD%20SVG%201.0//EN'%20'http://www.w3.org/TR/2001/REC-SVG-20010904/DTD/svg10.dtd'%3e%3csvg%20version='1.0'%20id='Layer_1'%20xmlns='http://www.w3.org/2000/svg'%20xmlns:xlink='http://www.w3.org/1999/xlink'%20x='0px'%20y='0px'%20width='64px'%20height='64px'%20viewBox='5.5%20-3.5%2064%2064'%20enable-background='new%205.5%20-3.5%2064%2064'%20xml:space='preserve'%3e%3cg%3e%3ccircle%20fill='%23FFFFFF'%20fill-opacity='0'%20cx='37.785'%20cy='28.501'%20r='28.836'/%3e%3cpath%20fill='%23595959'%20d='M37.441-3.5c8.951,0,16.572,3.125,22.857,9.372c3.008,3.009,5.295,6.448,6.857,10.314%20c1.561,3.867,2.344,7.971,2.344,12.314c0,4.381-0.773,8.486-2.314,12.313c-1.543,3.828-3.82,7.21-6.828,10.143%20c-3.123,3.085-6.666,5.448-10.629,7.086c-3.961,1.638-8.057,2.457-12.285,2.457s-8.276-0.808-12.143-2.429%20c-3.866-1.618-7.333-3.961-10.4-7.027c-3.067-3.066-5.4-6.524-7-10.372S5.5,32.767,5.5,28.5c0-4.229,0.809-8.295,2.428-12.2%20c1.619-3.905,3.972-7.4,7.057-10.486C21.08-0.394,28.565-3.5,37.441-3.5z%20M37.557,2.272c-7.314,0-13.467,2.553-18.458,7.657%20c-2.515,2.553-4.448,5.419-5.8,8.6c-1.354,3.181-2.029,6.505-2.029,9.972c0,3.429,0.675,6.734,2.029,9.913%20c1.353,3.183,3.285,6.021,5.8,8.516c2.514,2.496,5.351,4.399,8.515,5.715c3.161,1.314,6.476,1.971,9.943,1.971%20c3.428,0,6.75-0.665,9.973-1.999c3.219-1.335,6.121-3.257,8.713-5.771c4.99-4.876,7.484-10.99,7.484-18.344%20c0-3.543-0.648-6.895-1.943-10.057c-1.293-3.162-3.18-5.98-5.654-8.458C50.984,4.844,44.795,2.272,37.557,2.272z%20M37.156,23.187%20l-4.287,2.229c-0.458-0.951-1.019-1.619-1.685-2c-0.667-0.38-1.286-0.571-1.858-0.571c-2.856,0-4.286,1.885-4.286,5.657%20c0,1.714,0.362,3.084,1.085,4.113c0.724,1.029,1.791,1.544,3.201,1.544c1.867,0,3.181-0.915,3.944-2.743l3.942,2%20c-0.838,1.563-2,2.791-3.486,3.686c-1.484,0.896-3.123,1.343-4.914,1.343c-2.857,0-5.163-0.875-6.915-2.629%20c-1.752-1.752-2.628-4.19-2.628-7.313c0-3.048,0.886-5.466,2.657-7.257c1.771-1.79,4.009-2.686,6.715-2.686%20C32.604,18.558,35.441,20.101,37.156,23.187z%20M55.613,23.187l-4.229,2.229c-0.457-0.951-1.02-1.619-1.686-2%20c-0.668-0.38-1.307-0.571-1.914-0.571c-2.857,0-4.287,1.885-4.287,5.657c0,1.714,0.363,3.084,1.086,4.113%20c0.723,1.029,1.789,1.544,3.201,1.544c1.865,0,3.18-0.915,3.941-2.743l4,2c-0.875,1.563-2.057,2.791-3.541,3.686%20c-1.486,0.896-3.105,1.343-4.857,1.343c-2.896,0-5.209-0.875-6.941-2.629c-1.736-1.752-2.602-4.19-2.602-7.313%20c0-3.048,0.885-5.466,2.658-7.257c1.77-1.79,4.008-2.686,6.713-2.686C51.117,18.558,53.938,20.101,55.613,23.187z'/%3e%3c/g%3e%3c/svg%3e)
%20--%3e%3c!DOCTYPE%20svg%20PUBLIC%20'-//W3C//DTD%20SVG%201.0//EN'%20'http://www.w3.org/TR/2001/REC-SVG-20010904/DTD/svg10.dtd'%3e%3csvg%20version='1.0'%20id='Layer_1'%20xmlns='http://www.w3.org/2000/svg'%20xmlns:xlink='http://www.w3.org/1999/xlink'%20x='0px'%20y='0px'%20width='64px'%20height='64px'%20viewBox='5.5%20-3.5%2064%2064'%20enable-background='new%205.5%20-3.5%2064%2064'%20xml:space='preserve'%3e%3cg%3e%3ccircle%20fill='%23FFFFFF'%20fill-opacity='0'%20cx='37.637'%20cy='28.806'%20r='28.276'/%3e%3cg%3e%3cpath%20fill='%23595959'%20d='M37.443-3.5c8.988,0,16.57,3.085,22.742,9.257C66.393,11.967,69.5,19.548,69.5,28.5c0,8.991-3.049,16.476-9.145,22.456%20C53.879,57.319,46.242,60.5,37.443,60.5c-8.649,0-16.153-3.144-22.514-9.43C8.644,44.784,5.5,37.262,5.5,28.5%20c0-8.761,3.144-16.342,9.429-22.742C21.101-0.415,28.604-3.5,37.443-3.5z%20M37.557,2.272c-7.276,0-13.428,2.553-18.457,7.657%20c-5.22,5.334-7.829,11.525-7.829,18.572c0,7.086,2.59,13.22,7.77,18.398c5.181,5.182,11.352,7.771,18.514,7.771%20c7.123,0,13.334-2.607,18.629-7.828c5.029-4.838,7.543-10.952,7.543-18.343c0-7.276-2.553-13.465-7.656-18.571%20C50.967,4.824,44.795,2.272,37.557,2.272z%20M46.129,20.557v13.085h-3.656v15.542h-9.944V33.643h-3.656V20.557%20c0-0.572,0.2-1.057,0.599-1.457c0.401-0.399,0.887-0.6,1.457-0.6h13.144c0.533,0,1.01,0.2,1.428,0.6%20C45.918,19.5,46.129,19.986,46.129,20.557z%20M33.042,12.329c0-3.008,1.485-4.514,4.458-4.514s4.457,1.504,4.457,4.514%20c0,2.971-1.486,4.457-4.457,4.457S33.042,15.3,33.042,12.329z'/%3e%3c/g%3e%3c/g%3e%3c/svg%3e)
I. Introduction
Among different information intermediaries, media platforms reach the broadest audience (Zingales (Reference Zingales2000)), positioning them to play a pivotal role in financial markets. Media coverage has been shown to influence stock returns (Fang and Peress (Reference Fang and Peress2009), Hillert, Jacobs, and Müller (Reference Hillert, Jacobs and Müller2014), Fedyk (Reference Fedyk2024)), corporate governance (Dyck, Volchkova, and Zingales (Reference Dyck, Volchkova and Zingales2008)), firm behavior (Baloria and Heese (Reference Baloria and Heese2018)), and financing decisions (Di Giuli and Laux (Reference Di Giuli and Laux2021)), and to serve as a whistle blower in cases of corporate misconduct (Miller (Reference Miller2006), Dyck, Morse, and Zingales (Reference Dyck, Morse and Zingales2010)). However, despite extensive research on the effects of media attention, relatively little is known about the determinants of media coverage itself. We aim to contribute to this literature.
In this article, we examine the media coverage of large corporations in the United States by investigating how the quality of a firm’s information environment relates to the attention it receives from the media. We test two competing hypotheses. Hypothesis 1 suggests that media coverage is demand driven: media respond to stakeholder demand by increasing coverage of firms with less transparent or weaker information environment. Hypothesis 2 is a supply-driven view, in which media outlets, constrained by the difficulty of gathering reliable content, reduce coverage of such firms.
To measure the quality of the information environment surrounding a firm, we rely on the literature concerning the informativeness of quarterly earnings conference calls, as well as recent advancements in computational linguistics. The Q&A sessions of these calls provide a particularly useful setting for our study. During these sessions, investors can extract value-relevant information by posing questions directly to senior management. In responding, management chooses whether to satisfy this demand for information or to leave the question effectively “nonanswered.” We quantify the degree of nonanswers in a call using the nonanswer score developed by Barth, Mansouri, and Woebbeking (Reference Barth, Mansouri and Woebbeking2022). This metric is trained on a data set of Q&A exchanges between equity analysts and management, and is computed using a bag-of-words model based on a glossary of 1,364 trigrams. These include phrases such as “[let me get] back to you,” “[I] do not know,” “[it’s] hard to predict,” “[let’s] wait and see,” “[it’s] too early to,” which are commonly used to avoid factually answering questions. Such responses can take the form of either direct refusals, as documented by Gow, Larcker, and Zakolyukina (Reference Gow, Larcker and Zakolyukina2021), or more subtle forms of nonanswers, that is, beating around the bush by blathering, as outlined in Barth, Mansouri, Woebbeking, and Zörgiebel (Reference Barth, Mansouri, Woebbeking and Zörgiebel2020).Footnote 1
We analyze a survivorship bias-free sample of S&P 500 firms from 2007 to 2019, using transcripts of their quarterly earnings calls to measure nonanswer scores in management responses. We also collect media coverage data from RavenPack (RP). RP includes millisecond-timestamped media coverage data from tens of thousands of news sources, including Dow Jones Newswires, The Wall Street Journal, The Financial Times, Bloomberg, Reuters, Seeking Alpha, as well as financial blogs such as Zero Hedge and The Motley Fool. Our analysis window begins the day after each earnings call and extends 60 days forward, capturing the period until the firm’s next scheduled call.Footnote 2
We measure media coverage using the following metrics: the number of unique news sources publishing content about the firm (
$ Sources $
 ) and the total number of media articles published about the firm (
$ Counts $
 ). These two measures capture distinct but related dimensions of media attention—while
$ Sources $
 reflects the breadth of coverage across outlets,
$ Counts $
 captures the depth or intensity of reporting activity. Including both measures allows us to disentangle whether changes in media coverage are driven by shifts in the number of outlets covering the firm or by changes in the volume of content produced by a given set of sources.
Our analysis begins by examining the relationship between nonanswers during earnings calls and the media coverage a firm receives in the subsequent quarter. We find a robust and negative correlation between nonanswers and subsequent media coverage—both in terms of the number of unique sources and the total number of articles—supporting the supply-driven media coverage hypothesis (Hypothesis 2). Specifically, while nonanswers may elevate investor demand for firm-specific information, media outlets appear to reduce their coverage, likely due to supply-side constraints in sourcing and producing substantive content.
To strengthen our argument, we differentiate between nonanswers to forward-looking questions and those to other types of questions. Because forward-looking information is particularly valuable to market participants, nonanswers in this context serve as a more direct signal of the media’s difficulty in obtaining relevant insights from firms. Our results show that nonanswers to forward-looking questions are more strongly associated with reduced media coverage than nonanswers to other question types. This finding further supports our hypothesis that supply-side constraints play a significant role in shaping a firm’s media coverage.
We further examine whether the supply-driven reduction in media coverage is more pronounced for content that is costlier to produce. RavenPack classifies media coverage into full articles, (hot-)newsflashes, and tabular material. We categorize these into high-cost (full articles) and lower cost (newsflashes and tabular formats) content based on the likely production effort required by media outlets (Bushee, Core, Guay, and Hamm (Reference Bushee, Core, Guay and Hamm2010)). Reanalyzing the data under this distinction, we find that the supply-driven coverage effect is present and robust for full articles. For nonfull articles, we do not observe a significant change in the number of sources; however, nonanswers are associated with a reduction in the total number of content pieces. These findings suggest that a poor information environment around a firm primarily hampers the media’s role in information production, but it also diminishes their capacity for information dissemination.
Business media operate along a spectrum of professionalism, and both professional and nonprofessional outlets play important roles in shaping investor perceptions (Chen, De, Hu, and Hwang (Reference Chen, De, Hu and Hwang2014), Drake, Thornock, and Twedt (Reference Drake, Thornock and Twedt2017)). We extend our analysis by examining how nonanswers in earnings calls relate to the extent of professional and nonprofessional media coverage. We find that both professional and nonprofessional media coverage are affected and the effect is more robust for the former. This suggests that the impact of a poor information environment is more pronounced for professional media, potentially due to their higher editorial standards and production costs.
The observed changes in media coverage may arise from reductions in either stale (recycled) news or genuinely novel content. Our analysis indicates that nonanswers are associated with declines in both types of media output. Consistent with earlier findings, these reductions are concentrated in full-length articles and are predominantly driven by professional media outlets.
Our empirical specifications are designed to account for a wide range of potential confounding factors. First, we account for firm characteristics commonly found to influence media attention in the literature, including firm size, profitability, and the book-to-market ratio. Second, we control for linguistic attributes of management responses that are known to convey value-relevant information to the stock market, such as tone, uncertainty, and complexity. Third, we incorporate earnings surprise as an additional control. Fourth, we address topic-specific variation in media attention by leveraging RavenPack’s tagged news topics. Finally, to account for both observable and unobservable heterogeneity, we include firm-year and quarter-year fixed effects. This approach allows us to identify the effect of nonanswers on media coverage within a firm-year observation.
We further validate our findings by analyzing shifts in media coverage portfolios at the media source level. Specifically, we examine whether earnings calls characterized by nonanswers lead media outlets to reallocate attention toward industry peers. To do this, we analyze firms within the same industry and compute the share of coverage each firm receives from the same media source around the time of the earnings calls. The results show a clear shift in coverage from firms providing fewer substantive responses to those offering more informative calls.
While the primary focus of this article is on the determinants of media coverage, we also conduct preliminary analyses to explore whether and how changes in media coverage following earnings calls are associated with stock returns and investor behavior.Footnote 3 Consistent with prior literature, we find that reduced media coverage is correlated with lower abnormal stock returns. Moreover, lower postcall media attention is associated with diminished investor interest and engagement, as proxied by Google search volume and EDGAR log file access data. We additionally find that retail investor holdings—as measured by the number of Robinhood users holding a stock—decline for firms experiencing reduced media coverage.
Finally, while the S&P 500 sample provides an ideal setting for our primary analysis (as discussed in Section III), we extend our study to a sample of smaller firms to examine whether the relationship between management disclosure and media coverage holds in different contexts. For smaller firms—where information environments are typically weaker—media coverage may act as a substitute for direct disclosure. In such cases, limited managerial communication may prompt media outlets to increase coverage to fill the informational gap for market participants. Using a sample of small firms from the S&P 1500, we find some (albeit weak) evidence consistent with this substitution hypothesis. Specifically, while our main findings largely hold for the relatively larger firms in this sample, the relationship between nonanswers and subsequent media coverage is either weak or positive for the smallest firms, depending on the media metric used. However, given the limited statistical significance of these estimates—and recognizing the distinct and heterogeneous information environments in which smaller firms operate—these findings should be interpreted with caution.
Our article contributes to the existing literature in several important ways. First, we extend the research on the determinants of media attention. Prior studies have identified various drivers of media coverage, including media-connected directors (Di Giuli and Laux (Reference Di Giuli and Laux2021)), advertising incentives (Reuter and Zitzewitz (Reference Reuter and Zitzewitz2006)), geographic proximity to media centers (Gurun and Butler (Reference Gurun and Butler2012)), and firm size and reputation (Miller (Reference Miller2006)). We contribute to this literature by documenting that firms with stronger information environments—measured by lower levels of managerial withholding during earnings calls—receive more extensive media coverage. This suggests that the availability and clarity of firm-provided information play a critical role in shaping media attention.
Second, we contribute to the accounting and finance literature that distinguishes between the media’s role in disseminating existing information and its role in generating new information through original journalism (Bushee et al. (Reference Bushee, Core, Guay and Hamm2010)). Our findings show that the supply-driven decline in media coverage applies primarily to the information-creation role.
Finally, we contribute to the growing recognition of nonprofessional business media in financial markets (Chen et al. (Reference Chen, De, Hu and Hwang2014), Drake et al. (Reference Drake, Thornock and Twedt2017)). We find that nonprofessional media outlets are less responsive to deteriorating information environments than their professional counterparts, suggesting they may play a more persistent role in maintaining coverage when firms withhold information.
The remainder of the article is organized as follows: Section II develops our testable hypotheses. Section III describes the data set and key variables used in the empirical analysis. Section IV presents the main empirical results, while Section V reports additional analyses and robustness checks. Section VI concludes.
II. Hypotheses Development
This section examines two primary hypotheses regarding media coverage: the demand-driven and supply-driven perspectives.Footnote 4
The demand-driven media coverage hypothesis (Hypothesis 1) posits that a firm’s media coverage is primarily influenced by the information needs of various stakeholders, including investors, analysts, and other market participants. These stakeholders rely heavily on earnings call discussions, which often provide critical insights into a firm’s financial performance and future outlook (Barker, Hendry, Roberts, and Sanderson (Reference Barker, Hendry, Roberts and Sanderson2012)). Supporting this view, Bushee et al. (Reference Bushee, Core, Guay and Hamm2010) find that abnormal press coverage is more pronounced for large, high-growth firms with substantial analyst following—consistent with the notion that media coverage is driven by consumer demand for firm-specific information.
When a firm’s management refuses to provide requested information during an earnings call, it leaves this demand for value-relevant information unmet. As a result, stakeholders may turn to alternative information intermediaries—most notably, equity analysts and business media—to fill the gap. These intermediaries use their own expertise and research capabilities to offer interpretations and analysis that help stakeholders better understand the firm’s outlook.
Investors, in particular, are sensitive to the absence of value-relevant information during earnings calls, as it directly affects their ability to make informed investment decisions (Huang, Lehavy, Zang, and Zheng (Reference Huang, Lehavy, Zang and Zheng2018)). Given that investor demand for information significantly shapes analysts’ decisions on what to cover (Brown, Call, Clement, and Sharp (Reference Brown, Call, Clement and Sharp2015)), one would expect greater media coverage for firms where management withholds information. Equity analysts, as key intermediaries, often step in to address these information gaps, and their outputs can trigger broader media interest.
In short, when management withholds information, stakeholders increasingly turn to alternative sources—such as business media—to fill the informational void. In response, media outlets are incentivized to expand their coverage of these firms, as heightened demand for information tends to attract a broader audience and drive higher engagement and revenue. This hypothesis indicates that media coverage may act as a substitute when managerial transparency is lacking.
Hypothesis 1 (“Demand-driven coverage”). Firms with more non-answers in their earnings calls receive, ceteris paribus, more media coverage.
In contrast, Hypothesis 2 posits that media outlets determine which firms to cover based on the availability and accessibility of information, rather than the level of interest or demand from their audience. Under this view, coverage is shaped more by what journalists can feasibly report on than by reader preferences.
Firms may deliberately withhold information due to proprietary costs—that is, the potential competitive disadvantages that could arise from disclosing sensitive details (Gow et al. (Reference Gow, Larcker and Zakolyukina2021)). For instance, revealing information about a forthcoming product or innovative technology might provide strategic advantages to competitors. As a result, firms often choose to limit disclosure to protect their proprietary interests.
This withholding of information degrades the firm’s overall information environment (Ellis, Fee, and Thomas (Reference Ellis, Fee and Thomas2012)), making it more difficult for journalists and media outlets to access sufficient material to generate news content. In line with the theoretical model proposed by Bhushan (Reference Bhushan1989), a poorer information environment shifts the media’s supply curve to the left, reducing the total volume of coverage. In other words, when firms limit the release of value-relevant information, fewer media articles are produced about them. Supporting this perspective, Lang and Lundholm (Reference Lang and Lundholm1996) find that equity analysts are more likely to follow firms with robust disclosure practices. Clear and accessible corporate communication makes it easier for analysts to collect information and issue informed investment recommendations, further reinforcing the role of supply-side considerations in intermediary attention.
In summary, Hypothesis 2 suggests that firm visibility in the media is primarily determined by the ease with which information can be gathered and reported—rather than by audience interest alone. This perspective implies that media coverage and management disclosure act as complements—greater transparency facilitates greater coverage.
Hypothesis 2 (“Supply-driven coverage”). Firms with more non-answers in their earnings calls receive, ceteris paribus, coverage from fewer media outlets.
III. Data
For our main analysis, we construct a survivorship bias-free S&P 500 data set, which is well fitted for our analysis for several reasons. First, S&P 500 firms operate in relatively similar information environments, an important consideration in media coverage studies (Drake, Myers, and Myers (Reference Drake, Myers and Myers2009), Drake, Guest, and Twedt (Reference Drake, Guest and Twedt2014)). Second, both the media (Miller (Reference Miller2006), Hillert et al. (Reference Hillert, Jacobs and Müller2014)) and equity analysts (Martineau and Zoican (Reference Martineau and Zoican2020)) tend to focus disproportionately on S&P 500 firms. Third, these firms are large, high-volume publicly traded companies for which investor demand for information is particularly strong.
In addition to these theoretical justifications, a key practical consideration further supports our focus on S&P 500 firms. Specifically, RavenPack—our source of media coverage data—does not capture local news outlets, which are more likely to report on smaller or regionally focused firms. As a result, the media coverage data in our sample is significantly more comprehensive and representative for large-cap firms such as those in the S&P 500. That said, we also conduct supplementary analyses using a broader sample to assess the generalizability of our findings.
The following three subsections define the main independent variable (
$ NonAnswer $
 ), the primary dependent variables (various measures of media coverage), and the key control variables used in the analysis. Section III.D presents descriptive statistics for the main variables, and the Appendix lists these variables along with their corresponding definitions.
A. Managerial Nonanswers
This study employs the “nonanswer” score developed by Barth et al. (Reference Barth, Mansouri and Woebbeking2022) to quantify the extent to which management withholds information during earnings calls. The measure is built upon two key indicators of evasive communication: “rejection” (Gow et al. (Reference Gow, Larcker and Zakolyukina2021)) and “blathering” (Barth et al. (Reference Barth, Mansouri, Woebbeking and Zörgiebel2020)), and is estimated using the Multinomial Inverse Regression (MNIR) technique introduced by Taddy (Reference Taddy2013).Footnote 5 Barth et al. (Reference Barth, Mansouri and Woebbeking2022) construct a glossary consisting of 1,364 trigrams—such as “back to you,” “do not know,” and “hard to predict”—which are commonly used in English-language Q&As to avoid providing direct, factual answers. Figure 1 displays a word cloud of the most prominent trigrams from this glossary.
Figure 1 displays a word cloud of the trigrams included in the nonanswer glossary developed by Barth et al. (Reference Barth, Mansouri and Woebbeking2022), consisting of 1,364 trigrams. Font size reflects the relative importance of each trigram, with larger sizes indicating higher factor loadings. A machine-readable version of the glossary is available at econlinguistics.org.

FIGURE 1 Long description
The word cloud features a high density of three-word phrases (trigrams) in various colors including teal, purple, green, and yellow.
At the center, the largest and most prominent trigram is ‘back to you’ in a large teal font.
Surrounding the center are several other large-scale trigrams indicating high factor loadings:
* ‘hard to predict’ in yellow at the top right.
* ‘difficult to predict’ in green at the bottom left.
* ‘not know that’ in dark purple on the right side.
* ‘to wait and’ in green above the center.
* ‘too early to’ in light green on the left.
* ‘not know if’ in teal at the top left.
* ‘thank you for’ in green at the bottom left.
Medium-sized phrases scattered throughout include ‘have to wait’, ‘do not know’, ‘its too early’, ‘wait and see’, ‘to add anything’, and ‘work to do’.
The background is filled with hundreds of much smaller, less legible trigrams such as ‘of the world’, ‘year and then’, ‘number of people’, and ‘early in the’, representing lower factor loadings in the glossary.
We collect transcripts of all earnings calls held by S&P 500 companies from Thomson Reuters’ StreetEvents database, covering the period from 2007 to 2019.Footnote 6 These calls occur quarterly, typically on the same day as the corresponding earnings release. Most calls begin with management delivering a prepared statement, followed by a Q&A session during which analysts—and occasionally investors—pose questions.
The spontaneous and unscripted nature of the Q&A session provides a unique setting to assess the extent to which management avoids offering direct, factual responses. Accordingly, we exclude all earnings calls that do not include a Q&A session, as our analysis centers specifically on this portion of the call.
We define
$ NonAnswer $
 as the weighted count of the terms in the glossary provided by Barth et al. (Reference Barth, Mansouri and Woebbeking2022) for every answer in the earnings call of the company
$ i $
 in quarter
$ t $
 :

We limit our observations to the transcripts where the total management’s answers are at least 100 words long. This helps to avoid the extreme values of the nonanswer measure due to a small denominator. This filter affects only 21 observations.
B. Media Coverage
Measures of firm media coverage serve as the dependent variable in our main analysis. We obtain media coverage data for the firms in our sample from RavenPack News Analytics (RPNA). The RPNA data set comprises three primary editions: the Dow Jones Edition, which offers historical coverage since 2000 of Dow Jones Newswires, regional editions of The Wall Street Journal, Barron’s, and MarketWatch; the Web Edition, which has been available since January 2007 and includes hundreds of thousands of articles per day from over 22,000 sources, including major publishers and web aggregators (Hafez and Xie (Reference Hafez and Xie2014)); and the PR Edition, which covers press releases from PR Newswire. Each news item in RPNA is timestamped to the millisecond and is tagged with various sentiment scores and taxonomy identifiers. These features make RPNA a widely used data set among institutional investors, asset managers, and hedge funds (RavenPack (2017)).
We merge our firm-level data with RPNA using 8-digit CUSIP codes. For firms that do not match on CUSIP, we manually search for the matching RavenPack ID for merging. To ensure relevance, we further restrict our sample to news items with a “Relevance” score of at least 75%, which, according to the RPNA user guide, indicates a high level of significance to the target firm. In supplementary analysis, we verify that our results remain qualitatively unchanged when applying a more stringent relevance threshold of 95% for media content.
1. Coverage
We use two measures of media coverage in this study. Sources is defined as the natural logarithm of 1 plus the number of unique media sources (or channels) that publish content—whether full articles, (hot-)newsflashes, or tabular material—within the 2-month period following a firm’s earnings call. We construct Sources
$ {}^F $
 by restricting the count to only full articles, and Sources
$ {}^{NF} $
 by including only (hot-)newsflashes and tabular materials. The second measure, Counts, is defined as the natural logarithm of 1 plus the total number of content items of any of the aforementioned types. These two measures capture distinct but related dimensions of media attention—while
$ Sources $
 reflects the breadth of coverage across outlets,
$ Counts $
 captures the depth or intensity of reporting activity. Including both measures allows us to disentangle whether changes in media coverage are driven by shifts in the number of outlets covering the firm or by changes in the volume of content produced by a given set of sources.
To avoid inflating our metrics with coverage directly tied to the earnings announcement, we exclude both the day of the conference call and the following day from the measurement window.
Figure 2 displays the time trends of the average number of distinct sources and total news counts across all firms in each quarter. The noticeable spike in both measures at the beginning of 2007 corresponds with the launch of RavenPack’s Web Edition, which has since expanded its coverage by continuously incorporating new media sources. While this structural change can be addressed using quarter fixed effects (which we include in all our regressions), we trim the sample to begin in 2007 to ensure consistency across observations for our main analyses. For robustness, we also replicate our core results using the full sample, including pre-2007 data.
Figure 2 plots the time trend in media coverage for firms in our sample. The left axis shows the number of unique media sources that published at least one article with over 75% relevance to a firm within 2 months following its quarterly earnings call. The right axis displays the total number of such publications. Beginning in January 2007, RavenPack expanded its data set to include the Web Edition (RP-WEB), which covers content from leading online publishers and web aggregators. RavenPack continues to expand its coverage universe over time; for example, RP-WEB began including content from “Reuters” only after 2011.

FIGURE 2 Long description
The line graph features a horizontal X axis representing time from 2002 q 3 to 2018 q 3. The left Y axis is labeled Sources with a scale from 0 to 150. The right Y axis is labeled Counts with a scale from 0 to 1500.
Two data series are plotted:
* Sources is represented by a solid black line.
* Counts is represented by a dashed green line.
From 2002 to early 2006, both lines remain flat and near zero. A sharp upward inflection occurs in late 2006. Between 2007 and 2010, both series show a steady linear increase. Around 2011, there is a significant spike where Sources reaches nearly 100 and Counts reaches approximately 1100. Following this peak, both lines fluctuate with a slight downward trend until 2014, after which they resume a volatile upward trajectory. By the end of the period in 2018 q 3, Sources reaches its peak at approximately 115 and Counts reaches its maximum at 1500. The two lines track closely together throughout the entire duration, indicating a strong positive correlation between the number of unique media sources and the total volume of publications.
2. Press Releases
We control for the number of press releases within our analysis window, denoted as
$ PR $
 . In doing so, we treat all articles distributed via the press release wire, as well as entries tagged with “NEWS_TYPE” as “PRESS-RELEASE,” as firm-initiated disclosures (Bushee and Miller (Reference Bushee and Miller2007), Core, Guay, and Larcker (Reference Core, Guay and Larcker2008), and Bushee et al. (Reference Bushee, Core, Guay and Hamm2010)).
3. Professional Versus NonProfessional Business Media
Inspired by Drake et al. (Reference Drake, Thornock and Twedt2017), we divide media sources into professional and nonprofessional business media. A media outlet is categorized as professional if it, or its parent company, is listed among the following RavenPack identifiers: Barron’s (18A55F), Bloomberg News (208421), Business Insider (C75B8C), CNBC (AA1167), Dow Jones Newswires (B5569E), Entrepreneur (938822), The Financial Times (FD0B00), Forbes (22AC8B), MarketWatch (1E5E35), Morningstar (E04BE4), Reuters (751371), and The Wall Street Journal (AA6E89).
Under this classification, our set of professional business media includes outlets such as FT Alphaville—Hedge Funds (parent company: Financial Times) and Bloomberg Businessweek (Bloomberg). In total, this group consists of 65 sources, as listed in Table O.A.1 in the Supplementary Material. In contrast, the nonprofessional media in our sample primarily consist of blogs and independent news websites run by nonprofessional analysts or commentators. Prominent examples include Seeking Alpha (B61D8F), Zero Hedge (5E506B), and The Motley Fool (C81722).
We construct distinct measures of media coverage based on the professional status of the source. Specifically,
$ {Sources}_{Pro} $
 (
$ {Sources}_{N\hbox{-} Pro} $
 ) and
$ {Count}_{Pro} $
 (
$ {Count}_{N\hbox{-} Pro} $
 ) represent the number of unique sources and the total number of articles, respectively, filtered to include only professional (nonprofessional) media outlets.
4. Newsworthiness
Inspired by Dyck et al. (Reference Dyck, Volchkova and Zingales2008), we define
$ NewsWorthiness $
 as the natural logarithm of 1 plus the number of articles referencing a company in The Wall Street Journal (RavenPack ID “AA6E89”) and The Financial Times (RavenPack ID “FD0B00”) during the 2-month period preceding the earnings call (excluding the day of the call and the day prior).Footnote
7
5. News Contents and Corporate Events
To control for the content of news relevant to firms during our analysis window, we collect topic-level information from all news entries mentioning sample firms between 1 and 60 days after each earnings call. RavenPack identifies the role of each firm in a news story and classifies the event across four levels of granularity. For our analysis, we rely on the “GROUP” taxonomy provided by RavenPack, which offers an optimal balance between topic specificity and granularity—making it suitable for inclusion as controls in regression models. Using this classification, we identify 36 distinct news topics across our sample, covering a wide range of themes including mergers and acquisitions, analyst ratings, stock price movements, and technical analysis.
Additionally, to control for important company events, we add the number of Form 8-K filings submitted to the SEC, which disclose major corporate events that are likely to attract media attention.
C. Other Control Variables
1. General Speech Characteristics
We calculate the
$ Tone $
 and
$ Uncertainty $
 in management responses using the “negative” and “uncertainty” word lists developed by Loughran and McDonald (Reference Loughran and McDonald2011). As suggested by Loughran and McDonald (Reference Loughran and McDonald2016), we exclude the “positive” word list for the tone calculation.
In addition, we control for the
$ Complexity $
 of managerial language using the word list introduced by Loughran and McDonald (Reference Loughran and McDonald2024). Specifically, we construct the measure as the frequency of words from the complexity dictionary divided by the total word count of the response.
2. Earnings Surprise
We collect analysts’ earnings per share (EPS) forecasts for the firms in our sample from the IBES database and constructs the earnings surprise variable, denoted as
$ EarnSurp $
 , following the methodology of Dzielinski, Wagner, and Zeckhauser (Reference Dzielinski, Wagner and Zeckhauser2021). Specifically, we calculate earnings surprises as the difference between actual EPS and the consensus analyst forecast, scaled by the firm’s closing share price on the fifth trading day prior to the earnings announcement each quarter. We separately rank negative and (zero or) positive earnings surprises into five quantiles each. We then merge these into a 10-point ordinal scale: values from 1 (most negative) to 5 (least negative) and from 6 (least positive) to 10 (most positive), capturing the full distribution of standardized earnings surprises.
3. Firm Characteristics
We obtain quarterly balance sheet data from Compustat. As firm-level controls, we include the book-to-market ratio (BTM) and firm size, measured as the natural logarithm of total assets (ln(Assets)). We also compute Tobin’s Q as the sum of the book value of assets minus the book value of common equity, plus the market value of common equity, divided by the total book value of assets.
D. Descriptive Statistics
Table 1 presents descriptive statistics for the main variables used in this article. The distribution of the NonAnswer score aligns closely with that reported in Barth et al. (Reference Barth, Mansouri and Woebbeking2022). On average, the median firm in our sample is covered by approximately 240 published news items from around 35 distinct media sources during the 2-month window following the earnings call. In the same period, the firm typically issues around 15 press releases, and three 8-Ks.

TABLE 1 Long description
The table consists of 9 columns: Variable, Number of Observations, M (Mean), Standard Deviation, Minimum, P 10, P 50, P 90, and Maximum. All variables have 18,373 observations. Key data points include:
* NonAnswer: Mean .074, Standard Deviation .014, Range .029 to .15.
* Sources: Mean 3.8, Standard Deviation .93, Range 0 to 7.6.
* Sources super F: Mean 3.7, Standard Deviation .95, Range 0 to 7.5.
* Sources super N F: Mean 2.5, Standard Deviation .79, Range 0 to 6.6.
* Sources sub Pro super F: Mean 2, Standard Deviation .48, Range 0 to 3.3.
* Sources sub N-Pro super F: Mean 3.5, Standard Deviation 1.1, Range 0 to 7.5.
* Counts sub Pro super F: Mean 4, Standard Deviation 1.2, Range 0 to 9.1.
* Counts sub N-Pro super F: Mean 4.9, Standard Deviation 1.5, Range 0 to 11.
* P R: Mean 2.9, Standard Deviation 1.2, Range 0 to 8.7.
* 8-Ks: Mean 1.2, Standard Deviation .84, Range 0 to 4.1.
* Tone: Mean minus .0053, Standard Deviation .011, Range minus .063 to .041.
* EarnSurp: Mean 5.7, Standard Deviation 2.9, Range 1 to 10.
* Uncertainty: Mean .016, Standard Deviation .0056, Range 0 to .055.
* ln(Assets): Mean 9.8, Standard Deviation 1.4, Range 6.2 to 15.
* B T M: Mean .44, Standard Deviation .41, Range minus 3.2 to 17.
* Q: Mean 2.1, Standard Deviation 1.4, Range .63 to 36.
* Complexity: Mean .0072, Standard Deviation .0039, Range 0 to .029.
* NewsWorthiness: Mean .29, Standard Deviation .47, Range 0 to 2.1.
IV. Empirical Analysis
Section IV.A examines the relationship between management withholding information (i.e., nonanswers) and subsequent media coverage. Section IV.B explores whether this effect varies by question type, focusing on forward-looking questions—expected to have particularly high information value—versus other questions. In Section IV.C, we analyze how nonanswers influence different types of media content, distinguishing between full articles and newsflashes. Section IV.D investigates the differential effect of nonanswers across media types, comparing professional and nonprofessional outlets. Section IV.E assesses whether nonanswers impact the novelty of media coverage, distinguishing between novel and recycled (or stale) reporting. Finally, Section IV.F evaluates whether nonanswers lead to a shift in media attention from firms with high nonanswer scores to their industry peers with lower scores.
A. Media Coverage
We begin by examining whether nonanswers by management during earnings calls are associated with the media coverage their firm receives in the subsequent quarter. Figure 3 illustrates binned scatter plots depicting the association between our media coverage measures (
$ Sources $
 and
$ Counts $
 ) and the nonanswer scores from earnings calls. The figure demonstrates a negative correlation between nonanswers and subsequent media coverage—both in terms of the number of unique sources and the total number of articles—providing initial support for Hypothesis 2.
Figure 3 presents binned scatter plots showing the correlation between our nonanswer measure and subsequent media coverage. Graph A uses the number of unique media sources covering a firm as the coverage metric, while Graph B relies on the total number of media content items as an alternative proxy for media attention.

FIGURE 3 Long description
Two vertically stacked binned scatter plots with linear regression lines.
Graph A. Unique Media Sources (Top Panel)
* X-axis: NonAnswers, ranging from 0.04 to 0.12.
* Y-axis: MediaCoverage: unique sources, ranging from 3.5 to 4.
* Data: Approximately 40 blue data points are scattered around a solid red downward-sloping regression line. The trend shows that as NonAnswers increase from 0.04 to 0.12, the unique media source count decreases from roughly 3.9 to 3.55.
Graph B. Total Media Content (Bottom Panel)
* X-axis: NonAnswers, ranging from 0.04 to 0.12.
* Y-axis: MediaCoverage: counts, ranging from 5.4 to 6.
* Data: Similar to Graph A, blue data points follow a solid red downward-sloping regression line. As NonAnswers increase, the total media content count decreases from approximately 5.85 to 5.35.
Both graphs feature a light gray dotted grid background.
We next test this relationship formally. Specifically, we model media coverage of firm
$ i $
 during the 2-month window following the earnings call in quarter
$ t $
 , as specified in the following equation:

In this specification,
$ Media\hskip0.4em {Coverage}_{it} $
 represents either of the media coverage measures—
$ Sources $
 and
$ Counts $
 —as defined in Section III.B. The key independent variable,
$ {NonAnswer}_{it} $
 , captures the extent to which management withholds information during the earnings call. Under Hypothesis 1,
$ {NonAnswer}_{it} $
 serves as a proxy for unmet investor demand for information following the call. A positive
$ {\beta}_1 $
 would indicate that the media respond to this demand by increasing coverage for firms that withhold more information. Conversely, under Hypothesis 2, a negative
$ {\beta}_1 $
 would suggest that firms with higher information acquisition costs receive less coverage, as the media are less able or less willing to invest in content production under such conditions.
We include several sets of control variables that may influence a firm’s media coverage. First, we control for firm-initiated disclosures using two measures: the number of press releases issued by the firm (
$ {PR}_{it} $
 ), which represent direct contributions to media content via the media’s dissemination role, and the number of Form 8-K filings submitted to the SEC (
$ 8\hbox{-} {K}_{it} $
 ), which disclose material corporate events likely to draw media attention. The occurrence of such events—such as ongoing negotiations or regulatory developments—may also constrain what managers are willing or permitted to disclose during earnings calls.
Moreover, to account for the informational richness of the call itself, we include several well-established linguistic content measures as additional controls. In particular, we control for the tone of management responses (Tone), as Price, Doran, Peterson, and Bliss (Reference Price, Doran, Peterson and Bliss2012) show that tone significantly predicts both abnormal returns and trading volume in the immediate reaction window, and even outperforms earnings surprises in explaining market responses over the 60 trading days following the call. Similarly, Dzielinski et al. (Reference Dzielinski, Wagner and Zeckhauser2021) find that investors penalize higher levels of Uncertainty in management’s tone and responses with lower firm valuations. To control for the complexity of managerial language, we include the Complexity measure proposed by Loughran and McDonald (Reference Loughran and McDonald2024). This metric not only captures variation related to firm size, but also reflects the extent to which firms are required to provide informative disclosures, as noted by Guay, Samuels, and Taylor (Reference Guay, Samuels and Taylor2016).
We also follow the approach of Dyck et al. (Reference Dyck, Volchkova and Zingales2008) by controlling for NewsWorthiness, which captures the extent to which certain firms attract media attention due to ongoing or anticipated high-profile events. Beyond reflecting media demand, NewsWorthiness may also mitigate supply-side constraints by increasing the availability of firm-related content. Firms deemed newsworthy are more likely to be the subject of prior coverage or to have accessible information, making them more feasible and attractive targets for further media attention. Thus, NewsWorthiness serves as a proxy for both audience interest and the ease of content generation for media outlets.
In addition, to control for topic-specific effects that may independently influence both newsworthiness and media coverage, we include a set of indicator variables representing the presence of each of the 36 RavenPack news topics during the analysis window (e.g., legal disputes, mergers, and acquisitions). These controls allow us to account for external news events that may drive media attention independently of firms’ disclosure behavior.
Additionally, we include a vector of firm-quarter control variables. This includes the Earnings Surprise (
$ EarningsSurp $
 ), which measures the deviation between analysts’ forecasts and actual earnings; the natural logarithm of total assets (
$ \ln (Assets) $
 ), as a proxy for firm size; the book-to-market ratio (
$ BTM $
 ); and Tobin’s Q, as a proxy for growth opportunities. These are standard firm characteristics known to influence media attention (Miller (Reference Miller2006), Bushee et al. (Reference Bushee, Core, Guay and Hamm2010)).
Finally, to address unobservable factors at the firm and time levels that may jointly influence both media coverage and nonanswers during earnings calls, we incorporate a comprehensive set of fixed effects in our analysis. Specifically, we include quarter-year fixed effects to capture aggregate time trends and broader macroeconomic influences on media coverage. More importantly, we further include firm-year fixed effects to control for both observable and unobservable time-varying heterogeneity at the firm level that could simultaneously affect disclosure behavior and media attention. This specification ensures that identification is based on variation in management response quality across different earnings calls within the same firm-year and its corresponding effect on changes in media coverage for the same firm.
To address potential serial correlation in the error terms within firms and across quarters, we follow the recommendation of Cameron, Gelbach, and Miller (Reference Cameron, Gelbach and Miller2011) and employ two-way clustering of standard errors at the firm and quarter levels.
Table 2 presents the results of our main analysis. Columns 1–4 report estimates using our primary dependent variable,
$ Sources $
 . Column 1 includes only
$ NonAnswer $
 as the explanatory variable, while columns 2–4 incrementally add control variables and fixed effects. The most comprehensive specification, shown in column 4, includes the full set of control variables as well as Quarter-Year and Firm-Year fixed effects.Footnote
8 Column 5 replicates the specification in column 4 using
$ Counts $
 as the dependent variable.

TABLE 2 Long description
The table presents regression results for two dependent variables: Sources (columns 1 through 4) and Counts (column 5).
Key Independent Variable:
* NonAnswer: Shows negative coefficients across all models, ranging from -5.433 in column 1 to -0.570 in column 4 and -0.729 in column 5. All are statistically significant at the 1% or 5% level, with t-statistics between -2.46 and -2.91.
Control Variables:
* Tone: Coefficients are mostly positive but statistically insignificant.
* EarnSurp: Negative and significant in columns 2 through 4 (-0.004 to -0.002).
* Uncertainty: Negative coefficients, significant only in columns 2 and 3.
* ln(Assets): Positive and significant in columns 2 and 3 (0.238 and 0.141).
* B T M: Positive and significant in columns 2 and 3 (0.054 and 0.030).
* Q: Significant only in column 5 (0.014).
* Complexity: Significant only in column 2 (1.662).
* P R: Highly significant positive coefficients in columns 3 through 5 (0.129 to 0.279).
* 8-Ks: Highly significant positive coefficients in columns 3 through 5 (0.030 to 0.058).
* NewsWorthiness: Significant only in column 3 (0.077).
Model Statistics:
* Number of observations: Approximately 18,200 across models.
* R-squared: Increases from 0.007 in column 1 to 0.967 in column 5.
* Fixed Effects: Models 2 through 5 include QuarterYear fixed effects. Models 4 and 5 include FirmYear fixed effects and News categories.
The results reported in Table 2 provide strong support for Hypothesis 2. Across all model specifications—with varying sets of controls and fixed effects as well as different dependent variables—we consistently find a negative and statistically significant coefficient on
$ NonAnswer $
 , indicating that greater information withholding by management is associated with lower levels of media coverage. In particular, the estimated coefficient in column 4 implies that a 1-standard-deviation increase in the
$ NonAnswer $
 score corresponds to an approximate 1% decline in media coverage.
Among the control variables, only those related to firm-initiated disclosures—namely, PR and 8-Ks—are consistently significant across all specifications. Firms that issue more press releases or file more 8-K reports tend to receive greater media coverage. These forms of communication offer media outlets readily accessible and credible content, thereby lowering information acquisition costs and facilitating coverage. As official and typically vetted disclosures, they also enhance the perceived credibility of the firm’s public messaging, increasing media trust and engagement.
Other control variables exhibit some association with media coverage, though the relationships are less robust. The estimated coefficient on
$ Uncertainty $
 is negative and statistically significant in columns 2 and 3, suggesting that greater use of ambiguous or uncertain language by management may deter media attention. Additionally, we find some evidence in columns 2 through 4 that lower earnings surprises are associated with higher media coverage, potentially reflecting increased media interest in firms that defy expectations with more stable or less volatile performance. Finally,
$ NewsWorthiness $
 is positively and significantly associated with media coverage in column 3, indicating that media outlets are more inclined to cover firms already viewed as newsworthy. This likely reflects both demand-side incentives (reader interest) and supply-side considerations (ease of content generation from existing narratives or prior coverage).
Overall, the results presented in Table 2 indicate that increased information withholding by management leads to significantly lower levels of media coverage.
B. Nonanswer Types: Forward-Looking Versus Other Questions
Our Hypothesis 2 posits that media coverage declines when there is a supply-side constraint—namely, when it becomes difficult for journalists to identify and extract publishable content. The Non-Answer score serves as a proxy for this difficulty. To refine this measure, we extend the analysis by examining the types of questions that receive nonanswers and whether evading specific question types signals a weaker information environment.
Prior research by Barth et al. (Reference Barth, Mansouri and Woebbeking2022) shows that nonanswers are more frequently given in response to forward-looking questions—those concerning future financial performance, strategic initiatives, product development, or expansion plans. A lack of substantive responses to such questions may reflect management’s unwillingness or inability to provide meaningful disclosures, thereby indicating a lower level of transparency and a poorer information environment.
By disaggregating nonanswers based on question type, we aim to better understand the specific sources of supply-side friction for media coverage. This approach allows us to construct a more nuanced indicator of the challenges media outlets face when seeking publishable material and offers deeper insight into the underlying quality of the firm’s disclosure practices.
To quantify the forward-looking nature of each analyst question
$ q $
 during the earnings call of firm
$ i $
 in quarter
$ t $
 , we measure the share of forward-looking words (
$ FLQ $
 ) using the dictionaries provided by Bozanic, Roulstone, and Van Buskirk (Reference Bozanic, Roulstone and Van Buskirk2018) and Matsumoto, Pronk, and Roelofsen (Reference Matsumoto, Pronk and Roelofsen2011):

Our primary coefficient of interest is that on the interaction term between
$ NonAnswer $
 and
$ FLQ $
 , which we expect to be negative. This would indicate that the adverse effect of
$ NonAnswer $
 on media coverage is amplified when the unanswered questions are more forward-looking. In this specification,
$ FLQ $
 is computed at the question level, and the unit of observation corresponds to individual questions, not earnings calls.Footnote
9 This structure allows us to include earnings call fixed effects (which subsume firm fixed effects), as each call contains multiple questions, enabling within-call variation in both the forward-looking content and the nonanswering behavior. To account for potential correlation among observations within the same call, we cluster standard errors at the earnings call level.
As a complementary strategy, we construct a weighted version of the
$ NonAnswer $
 score at the earnings call level by factoring in the degree of forward-looking content in each analyst question. This approach places greater emphasis on nonanswers to questions that are more forward looking, under the assumption that such questions are more informative for external stakeholders. The weighted score is defined as follows:

The constructed measure reflects the extent to which management avoids responding to high-value, forward-looking inquiries. In this specification, the unit of observation remains the earnings call, consistent with our main analysis. From this point forward, we adopt the full specification used in columns 4 and 5 of Table 2, with minor modifications as dictated by the specific empirical setup. Unless otherwise noted, all regressions include the full set of control variables, along with quarter-year and firm-year fixed effects. For brevity, these controls and fixed effects are not reported in subsequent tables.
Table 3 presents the results of these analyses. Column 1, which mirrors the specification in column 4 of Table 2 (but at the question—instead of earnings call level), reaffirms the negative association between the NonAnswer score and a firm’s media coverage in the subsequent quarter. The results indicate that higher levels of nonanswering behavior are linked to reduced media attention.

TABLE 3 Long description
A statistical table with four columns of regression results. The dependent variable for columns 1, 2, and 3 is Sources. The dependent variable for column 4 is Counts.
Row 1: NonAnswer. Column 1 shows minus 0.013 with a t-statistic of minus 2.78, significant at the 1 percent level. Column 2 shows minus 0.005 with a t-statistic of minus 0.79.
Row 2: NonAnswer times F L Q. Column 2 shows minus 0.137 with a t-statistic of minus 2.09, significant at the 5 percent level.
Row 3: NonAnswer super F L Q. Column 3 shows minus 0.477 with a t-statistic of minus 3.90, significant at the 1 percent level. Column 4 shows minus 0.343 with a t-statistic of minus 2.43, significant at the 5 percent level.
Row 4: F L Q. Column 2 shows 0.010 with a t-statistic of 1.37.
Summary Statistics and Controls:
Number of observations: 489,576 in column 1; 476,064 in column 2; 18,192 in columns 3 and 4.
R-squared values: 0.953 in columns 1 and 2; 0.956 in column 3; 0.967 in column 4.
Full controls, QuarterYear F E, and News categories are marked Yes for all columns.
EarningsCall F E is Yes for columns 1 and 2.
FirmYear F E is Implied for columns 1 and 2, and Yes for columns 3 and 4.
Column 2 introduces the interaction between
$ NonAnswer $
 and the forward-looking content of the question. The interaction term is statistically significant, while the coefficient of
$ NonAnswer $
 becomes statistically insignificant. This shift suggests that the negative effect of nonanswers is primarily concentrated in responses to forward-looking questions. Since the interaction term serves as a more precise proxy for the difficulty media sources face in obtaining value-relevant information, this finding offers further support for the notion that supply-side constraints play an important role in determining media coverage. It also strengthens our confidence that the observed effect is unlikely to be driven by an omitted firm-level factor that is merely correlated with
$ NonAnswer $
 .
Column 3 confirms these findings at the earnings call level: the coefficient on
$ {NonAnswer}^{FLQ} $
 is negative and statistically significant at the 5% level, indicating that a firm’s media coverage declines as the incidence of nonanswers to forward-looking questions increases. A similar result is observed in column 4, where we use Counts as the dependent variable.
Overall, the results reported in Table 3 suggest that nonanswers to forward-looking questions negatively affect both the scope of coverage—measured by the number of distinct media sources—and the intensity of coverage, as reflected in the volume of articles published about the firm.
C. Media Coverage Type: Full Articles Versus Newsflashes
Media outlets allocate differing levels of time, effort, and resources when producing various types of content about a firm. The most common and easily disseminated form is the “newsflash,” which typically consists of a brief headline or a short summary, often linking to external sources. Newsflashes are quick to generate and require minimal editorial input. In contrast, full-length articles demand substantially more resources, as they involve original editorial content, including research, analysis, and often interviews (Drake et al. (Reference Drake, Guest and Twedt2014)). These articles provide more in-depth coverage and thus reflect a greater investment by the media outlet in producing informative content.
Consistent with Hypothesis 2, we posit that firms with higher nonanswer scores—reflecting a poorer information environment—are less likely to receive media coverage, particularly in the form of full-length articles. When management withholds value-relevant information during earnings calls, it raises the cost of acquiring and verifying information, thereby discouraging media outlets from committing the editorial resources required for producing substantive, analytical content. In contrast, the relationship between nonanswer behavior and the publication of lower effort media formats, such as newsflashes or tabular summaries, is less clear. Because these content types are typically brief, often automated or lightly curated, and rely less on original reporting, their production may be less sensitive to the quality of firm disclosures.
The RavenPack data set allows us to distinguish between full-length articles and other types of content, such as newsflashes and tabular material, based on source-provided classification tags. Leveraging this distinction, we estimate regression models analogous to those specified in equation (1), but separately for each type of media coverage. This enables us to examine whether the relationship between management’s information withholding and media attention differs depending on the editorial intensity of the coverage.
Table 4 shows that NonAnswer significantly reduces both sources and counts of full articles. The regression coefficient of −0.609 in the first column indicates that a 1-standard-deviation increase in the within-firm nonanswer metric leads to 1% fewer media sources publishing at least one full article about a firm within the 2-month window following the earnings call.

TABLE 4 Long description
The table consists of four numbered columns. Columns 1 and 2 are under the header Sources, specifically Sources super F for full articles and Sources super N F for newsflashes. Columns 3 and 4 are under the header Count, specifically Count super F and Count super N F.
Row 1: NonAnswer coefficients.
Column 1: minus 0.609 with three asterisks, t-statistic minus 2.89.
Column 2: 0.181, t-statistic 0.86.
Column 3: minus 0.653 with two asterisks, t-statistic minus 2.13.
Column 4: minus 0.710 with two asterisks, t-statistic minus 2.56.
Row 2: Number of observations is 18,192 for all columns.
Row 3: R-squared values.
Column 1: 0.953.
Column 2: 0.922.
Column 3: 0.963.
Column 4: 0.948.
Bottom Rows: Full controls, QuarterYear F E, FirmYear F E, and News categories are all marked as Yes for all four columns.
For newsflashes, by contrast—and consistent with our earlier argument—the effect of
$ NonAnswer $
 on media coverage is notably weaker. The estimated coefficient is statistically insignificant for the number of unique sources covering the firm. However, the results indicate that these same sources produce a significantly lower volume of newsflashes about the firm (column 4).
Overall, the results of Table 4 suggest that nonanswers have the most pronounced impact on full-length articles, which typically involve higher editorial effort. While the number of outlets producing newsflashes remains unchanged, the overall volume of this lower effort coverage also declines in response to higher levels of nonanswers.
D. Media Types: Professional Versus NonProfessional Media
In this section, we examine whether the reduction in media coverage due to nonanswers varies by the professionalism of the media source. Professional business outlets (e.g., The Financial Times, The Wall Street Journal, Bloomberg News) are well-established information intermediaries in capital markets, while nonprofessional sources (e.g., Seeking Alpha, The Motley Fool)—though less formal—also play a meaningful role in generating and disseminating financial information (Cookson, Runjing, Mullins, and Niessner (Reference Cookson, Runjing, Mullins and Niessner2024), Koenraadt and Schutt (Reference Koenraadt and Schutt2024)). Prior research demonstrates that investors respond not only to the informational content of professional media outlets but also to the tone and analysis provided by nonprofessional commentators, underscoring the broader relevance of both media types in shaping investor perceptions and market outcomes (Chen et al. (Reference Chen, De, Hu and Hwang2014), Drake et al. (Reference Drake, Thornock and Twedt2017)).
To examine the relationship between NonAnswer and media coverage by different types of outlets, we distinguish full articles produced by professional and nonprofessional business media based on the classification outlined in Section III.B. We then estimate regression models analogous to those in equation (1), restricting the construction of our dependent variables to content published exclusively by either professional or nonprofessional media sources.
As shown in Table 5, we find a negative and statistically significant relationship between
$ NonAnswer $
 and professional business media coverage, both in terms of the number of distinct sources and the total count of articles (columns 1 and 3). For nonprofessional media, the estimated effect is also negative but only statistically significant for the number of sources (column 2), not for the volume of content produced (column 4).

TABLE 5 Long description
The table consists of four numbered columns. The first two columns are grouped under the heading Sources, and the next two are under the heading Count.
Column 1: Sources sub Pro super F.
Column 2: Sources sub N-Pro super F.
Column 3: Counts sub Pro super F.
Column 4: Counts sub N-Pro super F.
The first row of data for the independent variable NonAnswer shows the following coefficients and t-statistics in parentheses:
Column 1: -0.490** with a t-statistic of -2.12.
Column 2: -0.581** with a t-statistic of -2.47.
Column 3: -1.646*** with a t-statistic of -4.23.
Column 4: -0.387 with a t-statistic of -1.11.
Summary statistics for all four columns are identical for the number of observations at 18,192. The R-squared values are 0.847 for column 1, 0.951 for column 2, 0.922 for column 3, and 0.965 for column 4.
All columns indicate ‘Yes’ for Full controls, QuarterYear F E, FirmYear F E, and News categories.
Overall, these results provide strong evidence that management’s withholding of information reduces media coverage broadly, with the effect being particularly pronounced among professional business media outlets.
E. Media Coverage: Novel Versus Stale News
The reduction in media coverage following instances of NonAnswer documented above may be driven by novel content, recycled (stale) coverage, or both. If the effect were limited to stale news, this would suggest that nonanswers have minimal impact on content generation and the media’s role in information production.Footnote 10 However, under Hypothesis 2, we expect the effect to be most evident in novel content, which demands greater editorial effort and original reporting. A decline in novel coverage is also likely to cascade into a reduction in recycled content, given that stale news often derives from or amplifies original reporting.
To distinguish between these types of news, we employ RavenPack’s Novelty Score, which ranges from 0 to 100 and captures how “new” a news story is within a 24-hour window across all published content. A score of 100 indicates the first article to report a categorized event involving one or more companies and is therefore classified as highly novel. Based on this metric, we construct our media coverage variables—Sources, Counts, and their respective subcategories—separately for novel news (novelty score = 100) and stale news (novelty score
$ < $
 100). We then re-estimate our regressions across these disaggregated measures to assess whether the impact of NonAnswer is primarily driven by reductions in novel versus recycled news content.
Table 6 presents the results of this analysis. Panel A reports the findings for novel news, while Panel B displays the corresponding results for stale news. As shown in Panel A, NonAnswer is associated with a significant reduction in the number of Sources, driven primarily by a decline in full-article coverage, particularly from professional media outlets. Panel B reveals a similar pattern for stale news. Notably, we also observe a reduction in the volume of content produced by nonprofessional media (such as blogs), suggesting that lower output of novel and stale content from professional media may spill over and dampen recycled content generation by nonprofessional sources. However, this effect is not statistically significant at conventional levels.

TABLE 6 Long description
The table consists of five columns numbered 1 through 5. The column headers are: 1. Sources, 2. Sources super F, 3. Sources super N F, 4. Counts sub Pro super F, and 5. Counts sub N minus Pro super F.
Panel A. Novel News:
For the variable NonAnswer:
Column 1: minus 0.378 with t-statistic minus 2.20 (significant at 5%).
Column 2: minus 0.518 with t-statistic minus 2.99 (significant at 1%).
Column 3: minus 0.091 with t-statistic minus 0.34.
Column 4: minus 1.625 with t-statistic minus 3.38 (significant at 1%).
Column 5: 0.090 with t-statistic 0.28.
R-squared values for Panel A range from 0.761 to 0.948.
Panel B. Stale News:
For the variable NonAnswer:
Column 1: minus 0.658 with t-statistic minus 2.61 (significant at 5%).
Column 2: minus 0.658 with t-statistic minus 2.50 (significant at 5%).
Column 3: 0.285 with t-statistic 0.88.
Column 4: minus 1.405 with t-statistic minus 3.47 (significant at 1%).
Column 5: minus 0.515 with t-statistic minus 1.39.
Summary statistics for all columns include:
Number of observations: 18,192.
R-squared values for Panel B range from 0.896 to 0.963.
Full controls, QuarterYear F E, FirmYear F E, and News categories are all marked as Yes for all columns.
Overall, the results in Table 6 indicate that NonAnswer during earnings calls leads to a reduction in the generation of novel media content—as well as a decline in recycled coverage—highlighting a meaningful disruption to the media’s information production function.Footnote 11
F. Coverage Shift Within the Industry
This subsection tests Hypothesis 2 at the media source level by examining whether media outlets reallocate their coverage away from firms with poor information environments toward peer firms that provide more substantive responses during earnings calls. Unlike previous analyses, which focus on firm-level outcomes, this approach centers on media sources that already cover a group of industry peers, allowing us to track changes in relative coverage intensity before and after an earnings call.
We begin by constructing a coverage shift score and then examine its association with management nonanswers through a regression analysis.
1. Coverage shift
For the firm
$ i $
 of industry
$ \unicode{x1D540} $
 on the earnings call day
$ t $
 , we define the “prior” coverage weight
$ {\omega}_{mit} $
 for media source
$ m $
 as:

where
$ {Counts}_{mid} $
 denotes the number of published news about firm
$ i $
 published by source
$ m $
 on day
$ d $
 . By definition we have
$ {\omega}_{mit}\ge 0 $
 and
$ {\sum}_{i\in \unicode{x1D540}}{\omega}_{mit}=1 $
 . Following the same approach, we define the posterior coverage weights
$ {\omega}_{mit}^{\prime } $
 using the window
$ d\in \left[t+1,\dots, t+60\right] $
 .
We define the coverage shift as the change in coverage weight from the pre- to postearnings call period. Specifically, the coverage shift for firm
$ i $
 by media source
$ m $
 on earnings call date
$ t $
 is defined as:

We illustrate this definition with an example in Figure 4. On Apr. 14, 2015 (
$ t $
 ), J.P. Morgan (JPM) and Wells Fargo & Co. (WFC) held their earnings calls, with
$ NonAnswer $
 scores of 0.12 and 0.07, respectively. Both firms belong to Fama–French industry 44 (
$ \unicode{x1D540} $
 ), based on the 48-industry classification. We examine the coverage shift from The Wall Street Journal (WSJ, denoted
$ m $
 ) for these two firms.
Figure 4 illustrates an example of media coverage reallocation by The Wall Street Journal, using data from two firms—J.P. Morgan (JPM) and Wells Fargo & Co. (WFC)—that held their earnings calls on Apr. 14, 2015. Both firms belong to the same Fama–French industry classification (industry code 44). In the 2 months preceding the earnings call, The Wall Street Journal published 23 articles on JPM and 2 on WFC. In the 2 months following the call, the outlet published 14 articles on these firms—12 on JPM and 2 on WFC—highlighting a relative shift in coverage toward the firm providing more informative responses. The example and computations are described in details in IV.F.

FIGURE 4 Long description
At the top center, two blue equations define NonAnswer phi sub J P M equals 0.12 and NonAnswer phi sub W F C equals 0.07. Below this is a horizontal timeline with a central vertical divider representing the earnings call date.
To the left of the divider, the timeline spans from t minus 60 days. A bracket indicates 23 Articles for J P M and 2 Articles for W F C. Below this bracket, equations show omega sub m, J P M, t equals 23 forward slash (1 plus (2 plus 23)) equals 0.885 and omega sub m, W F C, t equals 2 forward slash (1 plus 25) equals 0.077.
To the right of the divider, the timeline spans to t plus 60 days. A bracket indicates 12 Articles for J P M and 2 Articles for W F C. Below this bracket, equations show omega sub m, J P M, t equals 12 forward slash (1 plus 14) equals 0.8 and omega sub m, W F C, t equals 2 forward slash (1 plus 14) equals 0.133.
An arrow points from the left set of omega values to the right set. At the bottom, two final delta equations calculate the shift. Delta omega sub m, J P M, t equals l n (1 plus 0.8 forward slash 1 plus 0.885) equals minus 0.046. Delta omega sub m, W F C, t equals l n (1 plus 0.133 forward slash 1 plus 0.077) equals plus 0.051.
In the 2 months prior to
$ t $
 , WSJ published 23 articles on JPM and 2 on WFC. This results in prior weights of
$ {\omega}_{m,\mathrm{JPM},t}=23/\left(1+23+2\right)=0.885 $
 and
$ {\omega}_{m,\mathrm{WFC},t}=2/\left(1+25\right)=0.077 $
 . In the 2 months following
$ t $
 , WSJ published 14 articles on these two banks—12 on JPM and 2 on WFC—yielding posterior weights of
$ {\omega}_{m,\mathrm{JPM},t}^{\prime }=12/\left(1+14\right)=0.800 $
 and
$ {\omega}_{m,\mathrm{WFC},t}^{\prime }=2/\left(1+14\right)=0.133 $
 .
Using equation (3), we compute the coverage shifts as
$ \Delta {\omega}_{m,\mathrm{JPM},t}=\ln \left(\frac{1+0.800}{1+0.885}\right)=-0.046 $
 and
$ \Delta {\omega}_{m,\mathrm{WFC},t}=\ln \left(\frac{1+0.133}{1+0.077}\right)=+0.051 $
 . This suggests a relative shift in the Wall Street Journal’s coverage away from JPM and toward increased coverage of WFC.
2. Analysis
We model the shift in the firm’s coverage weight within industries with the following equation:

$ {X}_{it} $
 includes the full list of control variables as defined in equation (1). We include media fixed effects (
$ {\alpha}_m $
 ) to exploit within-media variation, isolating the differential treatment of firms by the same media outlet. In addition, we control for industry-year fixed effects (
$ {\alpha}_{\unicode{x1D540}t} $
 ) to account for time-specific shocks or common characteristics affecting earnings calls within the same industry on a given year. We also report standard errors clustered at the media source level.
Table 7 presents the results of this analysis. Column 1 shows that firms with higher NonAnswer scores experience a statistically significant decline in their media-level coverage weight relative to industry peers. In other words, holding other factors constant, media outlets tend to shift coverage toward firms that provide more substantive responses during earnings calls. Importantly, since the regression includes both industry-year and media fixed effects, the results capture within-media shifts in coverage across firms within the same industry. These findings suggest that media sources prioritize covering firms with less obstructed information flows and clearer communication strategies.

TABLE 7 Long description
A statistical table with 5 columns of regression results.
Column Headers (Dependent Variables):
1. Delta omega (All news articles).
2. Delta omega where Novelty equals 100 (Novel news).
3. Delta omega where Novelty is less than 100 (Stale news).
4. Delta omega for Non-Full Articles.
5. Delta omega for Full Articles.
Data Rows:
- NonAnswer: Shows negative coefficients across all columns, all significant at the 1% level. Values are -0.119 (t-stat -4.34) for column 1; -0.041 (t-stat -3.20) for column 2; -0.112 (t-stat -4.12) for column 3; -0.042 (t-stat -3.00) for column 4; and -0.100 (t-stat -3.84) for column 5.
- Number of observations: 862,279 for all columns.
- R-squared: Ranges from 0.007 to 0.029.
- Full controls, Industry-Year Fixed Effects (F E), and Source Fixed Effects (F E) are marked as Yes for all models.
Columns 2 and 3 replicate the analysis using only novel news content (i.e., articles with a novelty score of 100) and less novel news items (i.e., with a novelty score below 100), respectively. In both specifications, we find consistent evidence that firms exhibiting higher nonanswer behavior receive reduced media attention relative to their peers. This indicates that the coverage shift occurs for both novel and non-novel news.Footnote 12
To further examine whether this shift applies to different types of journalistic output, columns 4 and 5 repeat the analysis separately for nonfull articles (e.g., flash news) and full-length articles, respectively. The results show that the media coverage shift occurs in both cases, with larger magnitudes for full-length articles.Footnote 13
Taken together, the results in Table 7 provide strong support for Hypothesis 2: when management withholds information, media outlets reallocate attention toward more transparent firms within the same industry—across both novel and stale news, and across both brief and in-depth reporting.
V. Additional Analyses
In the preceding sections, we demonstrate that when management withholds information during earnings calls (NonAnswer), firms experience a decline in subsequent media coverage. This effect is particularly pronounced when nonanswers are given to forward-looking questions, which are of high informational value. Although the reduction in coverage is observed across both professional and nonprofessional media outlets, it is most concentrated in full-length articles—which require greater editorial effort and investment—and is particularly pronounced among professional media sources.
In this section, we conduct a series of additional analyses to further examine the relationship between NonAnswer and subsequent media coverage. First, we explore how media coverage—and its tone—following earnings calls relates to abnormal stock returns. Second, we extend our analysis to a new sample that includes smaller publicly traded firms to assess the generalizability of our findings. Third, we examine whether changes in media coverage translate into shifts in investor trading behavior by analyzing several indicators of trading activity. Finally, we conduct a set of robustness checks.
A. Media Coverage and Stock Returns
Our primary research question concerns the determinants of media coverage—specifically, whether and how management’s withholding of information during earnings calls influences subsequent media attention to the firm. We document a significant decline in media coverage following instances of NonAnswer, indicating that reduced managerial transparency affects the media’s engagement with the firm.
As discussed earlier, a separate strand of literature examines the consequences of media coverage for trading behavior and market outcomes. This body of work generally finds that greater media attention is associated with higher firm valuation and lower cost of capital (Fang and Peress (Reference Fang and Peress2009), Liu, Sherman, and Zhang (Reference Liu, Sherman and Zhang2014)), narrower bid–ask spreads (Bushee et al. (Reference Bushee, Core, Guay and Hamm2010)), increased trading volume (Guest (Reference Guest2021), Fedyk (Reference Fedyk2024)), reduced mispricing (Drake et al. (Reference Drake, Guest and Twedt2014)), and greater participation from both retail investors (Barber and Odean (Reference Barber and Odean2007)) and institutional investors (Fang, Peress, and Zheng (Reference Fang, Peress and Zheng2014)). Identifying the causal effect of media coverage on such outcomes is empirically challenging, and several studies have proposed innovative identification strategies to address this issue (Engelberg and Parsons (Reference Engelberg and Parsons2011), Peress (Reference Peress2014), and Fedyk (Reference Fedyk2024)).Footnote 14
Given that our study primarily focuses on the determinants—rather than the consequences—of media coverage, and in light of the well-documented empirical challenges in identifying the causal effects of media coverage on market outcomes, a comprehensive analysis of how reductions in media coverage affect stock returns and trading activity lies beyond the scope of this article. Nonetheless, with this caveat in mind, we offer suggestive evidence on whether the observed decline in media coverage following earnings calls is associated with changes in shareholder value, proxied by abnormal stock returns.
We measure cumulative abnormal returns (CAR) for each firm over the 60 trading days following its earnings call (day 1 to day 60), using the Fama–French three-factor model as the benchmark. To assess the relationship between media coverage and stock performance, we estimate regressions with CAR as the dependent variable and media coverage—measured by both the number of unique sources (Sources) and the volume of content (Counts)—as key explanatory variables. Prior research suggests that media coverage, regardless of its content, is positively associated with firm valuation (Fang and Peress (Reference Fang and Peress2009)). Additionally, there is evidence that the tone of media coverage affect firm valuation and future stock returns (Tetlock, Saar-Tsechansky, and Macskassy (Reference Tetlock, Saar-Tsechansky and Macskassy2008), Kothari, Li, and Short (Reference Kothari, Li and Short2009)). Therefore, we also include the tone of coverage as an alternative explanatory variable in our analysis. As a results, we will have three dependent variables.
For each of the three dependent variables—media coverage measured by Sources, Counts, and Tone—we construct five variations: i) based on all news from all sources (Overall), ii) limited to professional media outlets (Pro), iii) limited to nonprofessional media (N-Pro), iv) restricted to highly novel news with a novelty score of 100 (Novel), and v) restricted to stale news with a novelty score below 100 (N-Novel). This results in a total of 15 alternative measures of media coverage, each of which is used as the main explanatory variable in separate regressions to assess their relationship with cumulative abnormal returns (CAR).
To further evaluate the robustness of our findings, we replicate the entire analysis using a more stringent relevance threshold for media content. Specifically, we raise the minimum relevance score from the default 75% to 90%, thereby focusing on news items that are more directly related to the firm. All regressions include the full set of control variables and both firm-year and quarter-year fixed effects, allowing us to identify within-firm changes in coverage rather than cross-sectional differences between firms with high and low media attention.
Table 8 presents the estimated relationships between the various media coverage measures and abnormal stock returns. Panel A reports the results using the default relevance threshold of 75%, while Panel B displays results using the stricter 90% cutoff. Each coefficient in the table is derived from a separate regression; rows correspond to the different media coverage metrics, while columns reflect how each measure is constructed (e.g., professional vs. nonprofessional media).

TABLE 8 Long description
The table consists of five columns numbered 1 to 5, labeled: Overall, Pro, N-Pro, Novel, and N-Novel.
Panel A. Relevance greater than 75 percent:
* Source: Overall 0.013 (1.93); Pro 0.011 (1.85); N-Pro 0.013 (3.03); Novel 0.013 (2.22); N-Novel 0.002 (5.06).
* Count: Overall 0.007 (1.20); Pro 0.011 (1.97); N-Pro 0.008 (1.72); Novel 0.003 (4.76); N-Novel 0.003 (3.61).
* Tone: Overall 0.009 (1.58); Pro 0.019 (2.74); N-Pro 0.031 (4.35); Novel 0.001 (5.66); N-Novel minus 0.000 (-0.16).
Panel B. Relevance greater than 90 percent:
* Source: Overall 0.014 (2.19); Pro 0.011 (1.85); N-Pro 0.013 (3.06); Novel 0.015 (2.59); N-Novel 0.002 (5.06).
* Count: Overall 0.008 (1.33); Pro 0.011 (2.20); N-Pro 0.007 (1.54); Novel 0.003 (4.76); N-Novel 0.003 (3.61).
* Tone: Overall 0.010 (1.77); Pro 0.023 (3.24); N-Pro 0.031 (4.35); Novel 0.001 (5.66); N-Novel minus 0.000 (-0.49).
t-statistics are provided in parentheses below each coefficient. Asterisks indicate statistical significance levels: three for 1 percent, two for 5 percent, and one for 10 percent.
The results suggest a positive association between media coverage and abnormal stock returns: firms receiving greater (less) media attention following earnings calls tend to exhibit higher (lower) cumulative abnormal returns. The effects are similar in magnitude but become statistically more significant when we focus on highly relevant news (Panel B). The magnitude of the effect is also economically meaningful. Specifically, a 1-standard-deviation decrease in the number of media sources covering a firm postcall is associated with a 1.3% decline in abnormal returns.
This positive relationship generally holds with similar magnitudes across coverage from both professional and nonprofessional media, though the effect appears more robust for professional media. Similarly, we find a positive association between coverage of both novel and stale news and abnormal returns; however, the effect is substantially larger for novel news (e.g., coefficients of 0.015 for novel vs. 0.002 for stale news in the first row of Panel B).
Finally, while the tone of articles from both professional and nonprofessional media is positively correlated with abnormal returns, we do not find any association between the tone of stale news and stock returns.
Overall, the results reported in Table 8 suggest a positive relationship between media coverage and abnormal stock returns, with the association being particularly strong and robust for coverage from professional business media and for novel news.
B. Media Coverage and Investor Activities
In this section, we examine whether changes in media coverage following earnings calls are associated with individual investors’ trading behavior and interest in the company. Prior literature suggests that media attention to individual stocks influences investor behavior, particularly among retail investors (Barber and Odean (Reference Barber and Odean2007), Da, Engelberg, and Gao (Reference Da, Engelberg and Gao2011), Engelberg and Parsons (Reference Engelberg and Parsons2011), and Tetlock (Reference Tetlock2011)). Our analysis builds on this work by exploring whether the decline in media coverage following nonanswers during earnings calls affects investor activity and interest in the firm. We expect that lower postcall media coverage will be associated with decreased investor attention and trading activity—especially among retail investors.
To proxy for retail investor activity, we use Google Search Volume Index data, a measure suggested in prior studies to capture retail attention and engagement with individual stocks (Da et al. (Reference Da, Engelberg and Gao2011), Ben-Rephael, Da, and Israelsen (Reference Ben-Rephael, Da and Israelsen2017)). For example, Da et al. (Reference Da, Engelberg and Gao2011) argue that high Google search volume for a stock suggests that many investors are looking for information about that stock. They document a strong positive relation between search volume changes and investor trading. We obtain monthly Google Trend data based on each company’s name and examine how media coverage during that month correlates with search activity.
Table 9 presents the relationship between various measures of media coverage and Google search intensity for a firm. Column 1 shows that overall media coverage is strongly and significantly correlated with search activity. We find similar patterns when media coverage is disaggregated into full articles versus newsflashes (columns 2–3), as well as into professional versus nonprofessional media sources (columns 4–5). These results suggest that media coverage—regardless of type or source—is significantly and positively related to retail investor interest.Footnote 15

TABLE 9 Long description
The table presents regression results for the dependent variable Google Trend across five columns.
Row 1: Sources has a coefficient of 0.018 in column 1 with a t-statistic of 3.49.
Row 2: Sources super F has a coefficient of 0.018 in column 2 with a t-statistic of 3.50.
Row 3: Sources super N F has a coefficient of 0.041 in column 3 with a t-statistic of 3.09.
Row 4: Counts sub Pro super F has a coefficient of 0.005 in column 4 with a t-statistic of 3.41.
Row 5: Counts sub N-Pro super F has a coefficient of 0.001 in column 5 with a t-statistic of 3.27.
Control variables across all five columns:
- l n (Assets): Coefficients range from 2.589 to 2.795, all significant at the 1% level.
- Q: Coefficients range from 0.322 to 0.340, all significant at the 5% level.
- B T M: Coefficients range from minus 0.511 to minus 0.636, none are statistically significant.
Summary statistics for all columns:
- Number of observations: 36,711.
- R-squared: Ranges from 0.870 to 0.872.
- Month Year F E: Yes.
- Firm Year F E: Yes.
All media coverage coefficients are significant at the 1% level as indicated by three asterisks.
Assuming that search intensity serves as a valid proxy for retail engagement, the findings in Table 9 imply that reduced media coverage following NonAnswer behavior may substantially diminish retail investor attention to the stock.
As an additional analysis, we examine the relationship between media coverage and changes in retail investor holdings using Robinhood data, available from 2017 onward. Leveraging within-firm variation across earnings calls, we find that increased media coverage—particularly in terms of content volume and across both professional and nonprofessional sources—is positively associated with growth in the number of Robinhood users holding a stock. While the coefficient on the number of unique sources is not statistically significant at conventional levels, robustness checks using higher relevance thresholds (above 90%) yield statistically significant results. These findings, though, should be interpreted with caution due to the short sample period for this analysis. Results are reported in Table O.A.4 in the Supplementary Material.
Overall, the results reported earlier provide suggestive evidence of a positive impact of media coverage on retail investor engagement and trading following earnings calls. These findings imply that the reductions in media attention documented earlier—driven by NonAnswer behavior by management—are likely to reduce retail investor interest and, in turn, lead to lower retail ownership of the stock.
As noted earlier, the existing literature has primarily focused on the influence of media coverage on retail investors, who are generally more susceptible to news and media coverage. Institutional investors are often assumed to be less reliant on media coverage, given their greater access to resources and analytical capabilities. However, prior research also indicates that professional investors actively monitor and utilize press-distribution channels, particularly real-time services such as newswires (Li et al. (Reference Li, Ramesh and Shen2011), Rogers, Skinner, and Zechman (Reference Rogers, Skinner and Zechman2016), and Twedt (Reference Twedt2016)). Moreover, there is evidence that institutional investors, like retail investors, face cognitive and attention constraints. For instance, Fang et al. (Reference Fang, Peress and Zheng2014) show that media coverage—irrespective of its tone—triggers increased trading activity by institutional investors, and that such behavior is linked to inferior investment performance.
Accordingly, management’s use of NonAnswer responses and the resulting decline in media coverage could plausibly reduce professional investors’ interest in the stock. Alternatively, in the face of reduced media content, these investors may respond by seeking more detailed information directly from primary sources such as company filings. Therefore, the net effect of NonAnswer and the subsequent lower media coverage on professional investors’ interest in a stock is an empirical question.
Financial professionals typically rely on two primary search platforms for accessing noneditorialized financial information: Bloomberg terminals (a subscription-based service) and the SEC’s EDGAR system (a first-source repository and a publicly accessible platform). Prior research uses search activity on Bloomberg terminals (Ben-Rephael et al. (Reference Ben-Rephael, Da and Israelsen2017)) and EDGAR platform (Loughran and McDonald (Reference Loughran and McDonald2017), Li, Wang, Yan, and Zhao (Reference Li, Wang, Yan and Zhao2019), Gibbons, Iliev, and Kalodimos (Reference Gibbons, Iliev and Kalodimos2021), and Crane, Crotty, and Umar (Reference Crane, Crotty and Umar2023)) as a proxy for professional investors’ information acquisition and interest in specific stocks. An important consideration in this literature is the need to exclude automated downloads by “robots.” Drake, Roulstone, and Thornock (Reference Drake, Roulstone and Thornock2015) excludes all requests from IP addresses that access more than five filings in a given minute or more than 1000 filings in a single day. Loughran and McDonald (Reference Loughran and McDonald2017) defines more than 50 requests in a single day from a particular IP address as indicative of a “robot.”
We use data on downloads of company filings from the SEC’s EDGAR platform to proxy for professional investor interest. The EDGAR log file data sets provide detailed records of Internet search traffic related to corporate disclosures, including annual reports (10-Ks), quarterly reports (10-Qs), 8-Ks, and IPO prospectuses (Form S-1 and Form 424) as well as insider trading files (Forms 3, 4, and 5). Following Loughran and McDonald (Reference Loughran and McDonald2017), we exclude automated activity (“robots”), defined as instances where a single IP address makes more than 50 requests in a single day. We then aggregate the remaining data at the firm level to construct a measure of firm-specific investor attention. In the Appendix, we also report similar results using the alternative robot definition from Drake et al. (Reference Drake, Roulstone and Thornock2015).Footnote 16
We estimate regressions similar to those used in earlier analyses to assess the effect of changes in media coverage following earnings calls on filing downloads, measured as the log of the number of downloads. The regressions include the full set of control variables, along with quarter-year and firm-year fixed effects. As such, the results are identified from within-firm-year variation in media coverage and its association with changes in filing downloads.
Table 10 presents the results of this analysis. We find a robust, positive, and statistically significant relationship between media coverage and professional investors’ interest or engagement with a stock, as measured by downloads of company filings. Very similar results are obtained when using the alternative method for excluding automated downloads, as proposed by Drake et al. (Reference Drake, Roulstone and Thornock2015), which is reported in Table O.A.5 in the Supplementary Material.Footnote 17

TABLE 10 Long description
A statistical table with five columns labeled 1 through 5 under the heading E D G A R Downloads. The rows list independent variables followed by their coefficients and t-statistics in parentheses.
* Sources: Column 1 shows 0.124 with a t-stat of 9.02.
* Sources super F: Column 2 shows 0.117 with a t-stat of 9.41.
* Sources super N F: Column 3 shows 0.082 with a t-stat of 7.96.
* Counts sub Pro super F: Column 4 shows 0.108 with a t-stat of 12.43.
* Counts sub N-Pro super F: Column 5 shows 0.091 with a t-stat of 9.77.
All coefficients are significant at the 1% level as indicated by three asterisks. The bottom of the table indicates that all five models have 14,131 observations and an R-squared value of approximately 0.972. All models include Full controls, Quarter-Year fixed effects, Firm-Year fixed effects, and News categories.
It is important to acknowledge that professional investors can access certain information from company filings through a variety of platforms beyond the SEC’s EDGAR system. Sources such as company websites, Bloomberg terminals, Capital IQ, and Yahoo! Finance often provide consolidated access to some standard filing content. However, these alternative platforms typically omit valuable textual elements—such as the tone of Management’s Discussion and Analysis (Loughran and McDonald (Reference Loughran and McDonald2011)) or detailed disclosures about contingent liabilities (Boustanifar and Verriest (Reference Boustanifar and Verriest2025))—that are available only in the original filings. Accordingly, while EDGAR server log data serve as a useful and commonly used proxy for (professional) investor attention in the literature, this measure should be interpreted with the caveat that investors may also access structured filing data through alternative sources.Footnote 18
Taken together with our earlier findings that NonAnswer behavior reduces overall media coverage, the results presented in this section provide suggestive evidence that reduced managerial transparency may diminish investor engagement—among both retail and professional investors.
C. Analyzing a Sample of Smaller Firms
As motivated in Section III, this article focuses on S&P 500 firms. Nevertheless, one might reasonably question whether the findings generalize to smaller firms. There are several reasons to believe that the effects of NonAnswer behavior may differ in the context of smaller firms. Compared to large, prominent firms, smaller firms typically have fewer information channels available to investors, and may also be subject to lower scrutiny. Consequently, instances of NonAnswer may be less frequent. Additionally, the relationship between NonAnswer and media coverage may be more substitutive rather than complementary. In such cases, when management fails to provide adequate information, media outlets may attempt to fill the informational void through their own interpretation and analysis. Therefore, one might expect that, on average, more frequent nonanswers could lead to greater—rather than diminished—media coverage among smaller firms. Alternatively, if this relationship varies across subsets of firms—being substitutive in some cases and complementary in others—the net effect in the aggregate could be muted or statistically insignificant.
To investigate this possibility, we extend our analysis to a sample of smaller firms. Specifically, we collect the necessary data for companies in the S&P 1500 index that are not included in the S&P 500. We re-estimate our main regressions examining the relationship between NonAnswer and various media coverage metrics within this new sample. We further examine whether these effects vary across firm size by introducing interactions with firm size indicators.
Table O.A.6 in the Supplementary Material presents the descriptive statistics for this broader sample. The average and median levels of NonAnswer are 0.073 and 0.072, respectively—values that are nearly identical to those observed in the S&P 500 sample (0.074 and 0.073). However, media coverage levels differ substantially between the two samples. For instance, the average values of
$ Sources $
 and
$ {Counts}_{Pro}^F $
 for firms in the S&P 500 are 3.8 and 2.0, respectively, whereas the corresponding figures in this broader sample are 2.5 and 1.3.Footnote
19
Panel A of Table 11 presents the average relationship between NonAnswer and media coverage in this extended sample. The estimated coefficients are sometimes positive and sometimes negative, but none are statistically significant. In Panel B, we explore heterogeneity by firm size. We interact NonAnswer with a dummy variable, Large, which equals 1 if the firm is above the median size in this sample. The interaction term is consistently negative and, in several cases—particularly for professional media sources and full-length articles—statistically significant. This indicates that, among relatively larger firms in this sample, higher NonAnswer scores are associated with lower media coverage. In contrast, the coefficients on NonAnswer for smaller firms (i.e., those in the bottom half of the size distribution) are positive in some cases and statistically significant for the volume of content produced by professional media.Footnote 20

TABLE 11 Long description
The table consists of five numbered columns representing different media coverage measures: 1 Sources, 2 Sources super F, 3 Sources super N F, 4 Counts sub Pro super F, and 5 Counts sub N-Pro super F.
Panel A: The Average Effect.
Row NonAnswer: Column 1 is -0.012 -0.09; Column 2 is 0.027 0.19; Column 3 is -0.142 -1.01; Column 4 is 0.077 0.36; Column 5 is -0.183 -0.96.
Row R-squared: Column 1 is 0.941; Column 2 is 0.934; Column 3 is 0.898; Column 4 is 0.889; Column 5 is 0.951.
Panel B: Large Versus Small Firms.
Row NonAnswer times Large: Column 1 is -0.419 -1.67; Column 2 is -0.466* -1.72; Column 3 is -0.130 -0.52; Column 4 is -1.304*** -3.27; Column 5 is -0.499 -1.58.
Row NonAnswer: Column 1 is 0.176 0.92; Column 2 is 0.236 1.21; Column 3 is -0.084 -0.47; Column 4 is 0.661** 2.26; Column 5 is 0.040 0.17.
Row Large: Column 1 is 0.029 1.37; Column 2 is 0.031 1.39; Column 3 is 0.025 1.20; Column 4 is 0.095** 2.61; Column 5 is 0.018 0.61.
Summary Statistics for all columns: Number of observations is 61,192. R-squared values match Panel A. Full controls, QuarterYear F E, FirmYear F E, and News categories are all marked Yes for all columns.
Taken together, the results in Table 11 suggest that while the main patterns documented in our S&P 500 sample generally hold for relatively larger firms in the broader sample, there is some (albeit weak) evidence that for a subset of smaller firms, media coverage may function as a substitute for management disclosure. These findings align with Fang and Peress (Reference Fang and Peress2009), who show that analyst coverage and media coverage can act as substitutes—particularly for firms with weaker information environments—where media coverage helps bridge the gap in information provided to the market.
D. Robustness Checks
We have conducted several robustness checks, which are reported in the Supplementary Material for brevity. Specifically, Table O.A.8 in the Supplementary Material demonstrates that our main findings hold when focusing on a shorter window—the first 48 h following earnings calls. Furthermore, Table O.A.9 in the Supplementary Material verifies the robustness of our results using an expanded sample beginning in 2002. Moreover, we re-estimate the main regressions using the token-weighted version of
$ NonAnswer $
 measure proposed by Barth et al. (Reference Barth, Mansouri and Woebbeking2022), and the findings remain consistent (Table O.A.10 in the Supplementary Material). In addition, Table O.A.11 in the Supplementary Material shows that including lagged media coverage as a control does not affect our results. Finally, we confirm that our results are robust to accounting for potential nonlinear relationship between firm size and media coverage (Table O.A.12 in the Supplementary Material).Footnote
21
VI. Conclusion
This article investigates how the quality of managerial disclosure during earnings calls affects subsequent media coverage. Using a machine learning-based measure of “nonanswers” in earnings call Q&A sessions, we document a robust negative relationship between evasive managerial responses and postcall media attention. This pattern holds especially for professional media outlets and full-length journalistic content, consistent with a supply-driven view of media coverage: when management withholds information, media face greater constraints in sourcing and producing content, leading to diminished coverage.
Further analyses reveal that this decline in media attention is not merely limited to recycled or low-effort content—it extends to novel, high-effort reporting, particularly from professional sources. We also show that the media’s role in disseminating and producing information is especially impaired when managers avoid answering forward-looking questions. At the media source level, we further find that, within a given industry, outlets systematically shift their coverage away from firms with high nonanswer behavior and toward those providing more complete responses—reinforcing the supply-driven mechanism.
Consistent with the extant literature, we also find that reduced media coverage is associated with lower abnormal stock returns and diminished investor engagement, suggesting that the consequences of managerial nondisclosure extend beyond media dynamics to affect capital market outcomes.
Although our primary analysis focuses on S&P 500 firms, we examine the broader applicability of our findings using a larger sample. While the supply-driven effect remains evident among large and mid-sized firms, the relationship weakens or even reverses for the smallest firms—offering tentative evidence that media may act as a substitute for firm disclosure when transparency is low, but information demand remains high. However, as our data and empirical setup are not ideally suited for analyzing small firms, we view this as a promising area for future research.
Our findings contribute to the literature on the determinants of media attention, the distinct roles of business media in financial markets—namely, disseminating existing information and generating new, original content—and the consequences of managerial disclosure practices. By highlighting the media’s reliance on accessible information, our results underscore the importance of transparency in enabling the media to effectively perform both its informational and monitoring functions.
The recent growth in the literature on financial media has been facilitated by the emergence of high-frequency, structured data sets such as RavenPack (Tetlock (Reference Tetlock2014)), which continues to expand in coverage and granularity (Miller and Skinner (Reference Miller and Skinner2015)). Future research will benefit from broader firm coverage and longer time horizons, enabling more granular analyses at the media-source level and further exploration of how information production and dissemination dynamics vary across different institutional settings.
Appendix. Definition of Variables
-
$ BTM $
 :
-
Book-to-market ratio; defined as the total common/ordinary equity divided by the market value of equity (from Compustat).
-
$ Complexity $
:
-
The ratio of the complex words to the total words in the answers provided by the management. “Complexity” word list provided by Loughran and McDonald (Reference Loughran and McDonald2024).
-
$ Counts $
:
-
The natural logarithm of 1 plus the total number of news pieces in a 2-month period after firms’ earnings calls.
-
$ {Counts}^F $
:
-
The $ Counts $
variable filtered for the news pieces tagged as a full article in the Raven Pack data set. -
$ {Counts}_{N- Pro}^F $
:
-
The $ {Counts}^F $
variable filtered for the sources we identify as nonprofessional. -
$ {Counts}_{Pro}^F $
:
-
The $ Counts $
variable filtered for the sources we identify as professional. We label a source as professional if it is associated with Dow Jones Newswire, Barron’s, Marketwatch, Bloomberg News, Thomson Reuters, the Wall Street Journal, the Financial Times, Entrepreneur, Business Insider, CNBC, and Forbes. -
$ EarningsSurp $
:
-
Represents the grouping of all firms in deciles of earnings surprise following Dzielinski et al. (Reference Dzielinski, Wagner and Zeckhauser2021) (defined as the difference between the actual and the consensus forecast earnings (from IBES) as a ratio to the share price 5 trading days before the announcement).
-
$ FLQ $
:
-
Forward lookingness of the question; the ratio of the forward-looking words to the total words in the analyst’s question. Forward-looking terms provided by Bozanic et al. (Reference Bozanic, Roulstone and Van Buskirk2018) and Matsumoto et al. (Reference Matsumoto, Pronk and Roelofsen2011).
-
$ \mathit{\ln}(Assets) $
:
-
The natural logarithm of total assets (from Compustat).
-
$ Negativity $
:
-
The ratio of the negative words to the total words in the answers provided by the management. “Negative” word list provided by Loughran and McDonald (Reference Loughran and McDonald2011).
-
$ NewsWorthiness $
:
-
Inspired by Dyck et al. (Reference Dyck, Volchkova and Zingales2008), defined as the natural logarithm of 1 plus the number of articles in the Wall Street Journal and the Financial Times that refer to a company during the 6-month period before its earnings call (excluding the day of earnings call and 1 day before it).
-
$ NonAnswer $
:
-
The ratio of trigrams in the nonanswer glossary of Barth et al. (Reference Barth, Mansouri and Woebbeking2022) to the total words.
-
$ {NonAnswer}^{FLQ} $
:
-
The ratio of trigrams weighted by the forward-lookingness of the question to the total words.
-
$ {NonAnswer}^{\phi } $
:
-
The ratio of trigrams weighted by their corresponding loadings in the nonanswer glossary of Barth et al. (Reference Barth, Mansouri and Woebbeking2022) to the total words.
-
$ PR $
:
-
The natural logarithm of 1 plus the firm’s initiated press releases (from Ravenpack PR-edition).
-
$ Q $
:
-
The Tobin’s Q; the book value of assets minus book value of common equity plus the market value of common equity, divided by the total book value of assets (from Compustat).
-
$ Sources $
:
-
The natural logarithm of 1 plus the number of unique news sources that publish a piece in a 2-month period after firms’ earnings calls (from Ravenpack).
-
$ {Sources}^F $
:
-
The $ Sources $
variable filtered for the news pieces tagged as a full article in the Raven Pack data set. -
$ {Sources}^{NF} $
:
-
The $ Sources $
variable filtered for the news pieces not tagged as full article in the Raven Pack data set. -
$ {Sources}_{N- Pro}^F $
:
-
The $ {Sources}^F $
variable filtered for the sources we identify as nonprofessional. -
$ {Sources}_{Pro}^F $
:
-
The $ Sources $
variable filtered for the sources we identify as professional. We label a source as professional if it is associated with Dow Jones Newswire, Barron’s, Marketwatch, Bloomberg News, Thomson Reuters, the Wall Street Journal, the Financial Times, Entrepreneur, Business Insider, CNBC, and Forbes. -
$ Uncertainty $
:
-
The ratio of the uncertain words to the total words in the management answers. “Uncertainty” word list provided by Loughran and McDonald (Reference Loughran and McDonald2011).


Supplementary Material
To view supplementary material for this article, please visit http://doi.org/10.1017/S0022109026102634.


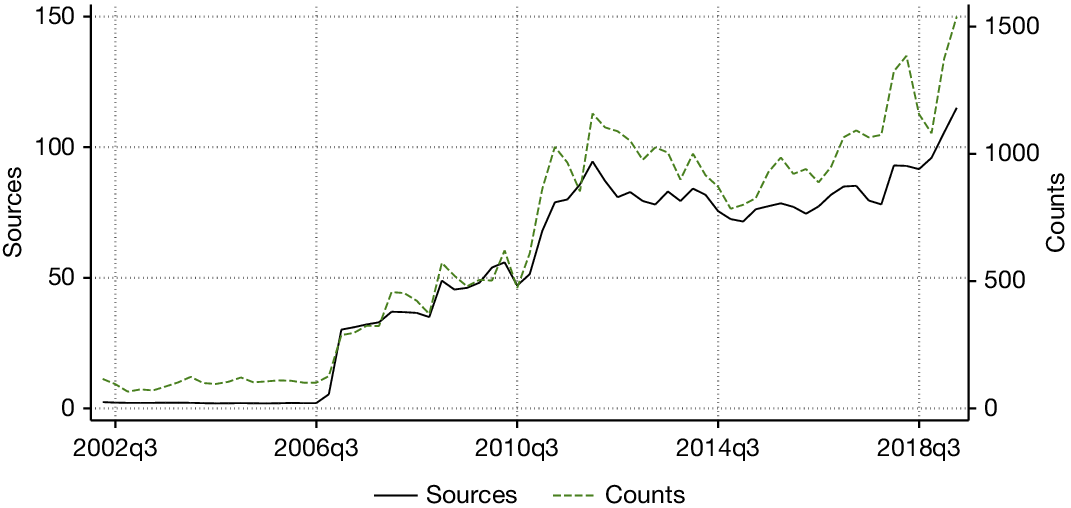

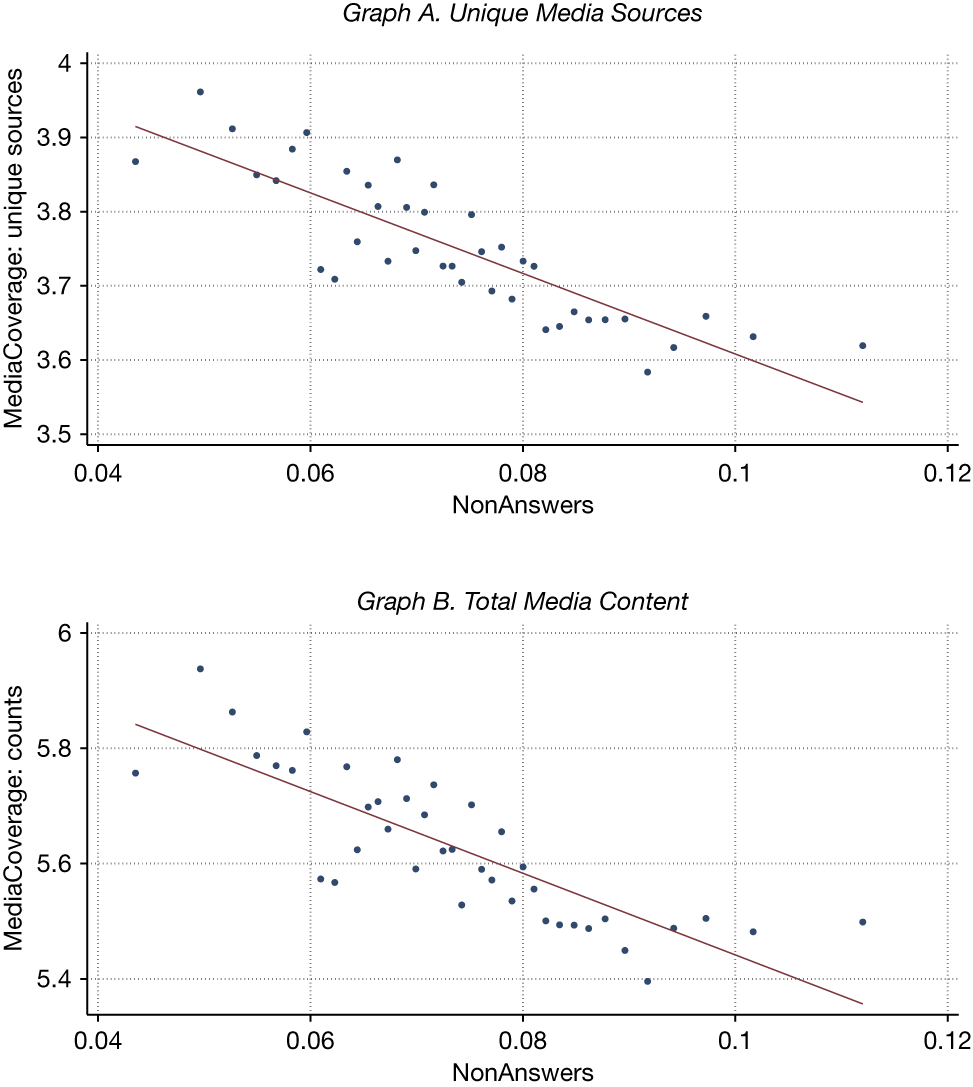


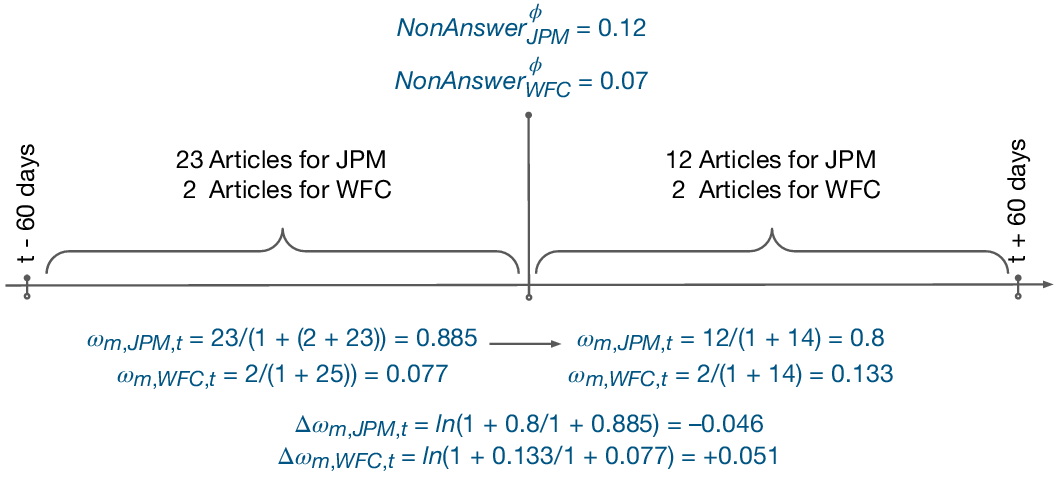


 Open access

