




No CrossRef data available.
CRITICAL VALUES AND P VALUES OF BESSEL PROCESS DISTRIBUTIONS: COMPUTATION AND APPLICATION TO STRUCTURAL BREAK TESTS
Published online by Cambridge University Press: 24 September 2003
Abstract
The p values of structural break tests, when the break date or dates are unknown, must be calculated in terms of the probability distributions of functions of Bessel processes. The literature so far has maintained that direct computation of these p values and of the corresponding critical values is too difficult and has relied on approximations based on simulations, asymptotic expansions, or curve fitting. This paper presents a fast simple method of calculating exact p values and critical values and uses the method to evaluate the accuracy of the various approximations.The author is grateful for comments and suggestions from Don Andrews, Clint Cummins, Jeff Fuhrer, Ken Garbade, Jim Mahoney, Tony Rodrigues, Josh Rosenberg, Sebastian Schich, participants in a workshop at the Federal Reserve Bank of New York, and the referees. The views expressed in this paper are those of the author and do not necessarily represent those of the Federal Reserve Bank of New York or the Federal Reserve System.
Information
- Type
- MISCELLANEA
- Information
- Copyright
- © 2003 Cambridge University Press
1. INTRODUCTION
The last decade has seen a surge in the development of statistical tests for breaks in time series models, particularly when the exact break point is unknown. For example, Andrews (1993) provides an extensive study of the properties of unknown break point tests based on generalized method of moments (GMM) estimation. These tests correspond to the classical Wald, likelihood ratio, and Lagrange multiplier tests. Ghysels, Guay, and Hall (1997) have developed an alternative test, also applicable to GMM estimates, that is based on the accuracy of predictions of the orthogonality conditions used in estimation. Bai and Perron (1998) and Bai (1999) present tests for multiple unknown break points.
In contrast to tests of known break points, which have asymptotic chi square distributions, the asymptotic distribution of unknown break point tests is related to less standard Bessel process distributions. These Bessel distributions present several challenges for the applied researcher. For instance, there are no closed-form expressions for the distribution function, which makes it difficult to compute p values. Moreover, the distribution depends on two parameters, which makes it somewhat inconvenient to tabulate critical values.
Thus, the literature has generally deemed it too difficult to calculate exact p values and critical values and has relied almost exclusively on approximations to the distribution function or to its inverse function. These approximations are based on simulations (as in Andrews, 1993), asymptotic formulas (based on the limit of the distribution function as the test value approaches infinity, as in DeLong, 1981, and others), and curve fitting (as in Hansen, 1997).
The main objectives of this paper are to show that it is actually quite feasible to calculate the exact values of the asymptotic distribution function and to examine the accuracy of the approximations that have been employed in the past. The computational method suggested is easily programmed using existing statistical packages, be it as a subroutine or as a feature of the package itself.
Of course, a compelling case for the calculation of exact values would make the use of approximations less relevant going forward. It is nevertheless important to gauge the accuracy of the approximations, because the literature already contains many applications and it is useful to know whether existing results would be affected by the substitution of approximations for exact values.
The following section describes the Bessel process distribution and the role it plays in tests for unknown break points. Section 3 then considers the calculation of exact p values and critical values and presents exact results analogous to those of Andrews (1993), which are based on simulations. Sections 4 and 5 deal with the asymptotic and Hansen approximations, respectively, and with the accuracy of those approximations. Section 6 concludes. Proofs of the propositions are found in the Appendix.
2. THE USE OF BESSEL PROCESS DISTRIBUTIONS IN BREAK TESTING
2.1. Tests for a Single Unknown Break Point
Suppose that the model to be tested is indexed by a vector of parameters θt, where t is an index of time. The subscript indicates that the value of the parameter vector may change from period to period. The null hypothesis is that the parameters are constant throughout the sample, that is,

The alternative is that the parameter vector changes at a proportion π of the sample, that is, at time Tπ:

To perform this test, Andrews (1993) discusses GMM analogues of the three classical tests: Wald, likelihood ratio, and Lagrange multiplier. The exact form of the statistics may be found in that paper. Like their classical counterparts, these statistics are distributed asymptotically as chi squared when the break point parameter π is known. If π is unknown, but is suspected to lie in a proper subset of the unit interval, the break point may be estimated by locating the value of π that corresponds to the strongest indication of a break, that is, to the largest value of one of the three statistics. Andrews and Ploberger (1984) also consider statistics based on the average or exponential average value of the break statistic over a subset of the unit interval. In this paper, we focus on the tests based on the supremum of the statistic, which are widely used and have a direct intuitive interpretation.
Thus, let Π = [π1,π2] be a closed interval contained in (0,1) and let S be the set of observations from t = [π1T] to t = [π2T] , where [·] denotes rounding to the nearest integer, that is, S = {t|[π1T] ≤ t ≤ [π2T]}. Consider the supremum of the Wald (W), likelihood ratio (LR), or Lagrange multiplier (LM) statistic from among the values computed at every point in S and let ζ denote one of supS W, supS LR, or supS LM. Andrews (1993) shows that, under certain regularity conditions, the distribution of ζ is a function of multivariate Brownian motion, which may be constructed as follows.
Let Bp(·) be a p-dimensional vector of independent Brownian motions. Then ∥Bp(π)∥ = (Bp(π)′Bp(π))1/2 is the Bessel process of order p and BBp(π) = Bp(π) − πBp(1), known as a Brownian bridge. If Bp(·) is defined on [0,1] and restricted to Π, then

is the square of the standardized tied-down Bessel process of order p.
When one of the GMM break tests is performed with a known value of π, the asymptotic distribution of the test statistic corresponds to Qp(π), which in that case has a χp2 distribution, as demonstrated by Andrews and Fair (1988). However, when π is unknown and is estimated by locating the supremum of one of the test statistics, Andrews (1993) shows that the relevant distribution is

where λ = π2(1 − π1)/π1(1 − π2). Note that the probability depends on π1 and π2, not individually, but only through λ. Note also that when π1 = 1 − π2 = π0, then λ = ((1 − π0)/π0)2. The interpretation of equation (4) is that the distribution of the supremum of the tied-down Bessel process is equivalent to the distribution of the supremum of the standard Bessel process exceeding a square-root boundary, which has been studied by DeLong (1981).
In addition to Andrews (1993), other papers have used Bessel process distributions to test for single unknown breaks in models. Among these are Siegmund (1986) for a single parameter, James, James, and Siegmund (1987) for multiple parameters, and Akman and Raftery (1986) for a single Poisson parameter.
Ghysels et al. (1997) introduce a test for multiple parameters, which is based on estimating the model by GMM over a portion of the sample and predicting the value of the GMM orthogonality conditions over the remaining portion. When the model is just-identified, their statistic measures the distance of the orthogonality conditions from zero, which would hold if the model fit perfectly over the remaining portion of the sample. In this case, the asymptotic distribution of the statistic is the same as in Andrews (1993).
2.2. Tests for Multiple Breakpoints
Some tests for multiple break points also use the Bessel process distribution from equation (4). For instance, Bai (1999) constructs a LR test for m + 1 breaks under the null of m breaks. Let 0 < φ1 < ··· < φm < 1 be the proportions of the sample representing the m break points estimated under the null, with φi − φi−1 > π0 for some small value π0. Define also ηi = π0 /(φi − φi−1), i = 1,…,m + 1, where we take φ0 = 0 and φm+1 = 1.
The LR test is obtained by estimating m + 1 break points and comparing the likelihood to the m break likelihood. In this case, the distribution of the LR is asymptotically

Thus, p values for LR may be computed by repeated application of the formula for p values in the single-break case.
Bai and Perron (1998) also use the Bessel process distribution in tests for multiple break points. They develop two types of tests, one for no breaks vs. a fixed number k of breaks and the other a sequential test for m vs. m + 1 breaks. In the former, the asymptotic distribution is the Bessel process when k = 1, whereas in the sequential test, the asymptotic distribution is given by repeated application of the Bessel process, as in Bai (1999).
2.3. Other Statistical Applications
Bessel process distributions are also useful in statistical applications other than structural break tests. For instance, Anderson and Darling (1952) construct a variant of the Kolmogorov–Smirnov test for goodness of fit, whose distribution is given by the Bessel process. Siegmund (1985) is a comprehensive survey of sequential analysis tests, several of which are asymptotically distributed as the Bessel process. For instance, a repeated significance test for nonzero drift in Brownian motion W(t) is based on the first time that

within a time interval m0 ≤ t ≤ m. Its distribution is essentially the same as (4). Siegmund (1986) contains a more detailed summary of these and other applications.
3. EXACT P VALUES AND CRITICAL VALUES
3.1. DeLong's Exact Formula
Equation (4) in the previous section presents two equivalent formulations for the asymptotic distribution of the supremum-based break tests, one in terms of the standardized tied-down Bessel process and one in terms of the Bessel process itself. In an important and influential paper, DeLong (1981) gives an exact expression for the Bessel process formulation, which involves the crossing of a square-root boundary. Virtually all the numerical applications of the Bessel process to break testing because 1981 correspond to approximations of DeLong's formula.
The reason for the use of approximations is the generally perceived intractability of the expression of DeLong (1981). In this section, we examine the expression and provide some results that simplify its calculation. With these results, we argue that the calculation is in fact fairly quick and simple and that there is little reason to resort to approximations.
To state DeLong's expression, let M(a,b,z) be the confluent hypergeometric function

where (a)k ≡ a(a + 1)…(a + k − 1) is the Pochhammer symbol, with (a)0 ≡ 1. The infinite series converges as long as b is not a negative integer. Let M1(a,b,z) be the partial derivative of this function with respect to its first argument. DeLong (1981) shows that

where βj is the jth root of M(β + p/2,p/2,−c/2) as a function of β > 0,

and Γ(·) is the gamma function.
Computationally, the only real challenge in this formula is the identification of the roots βj. Once these values are known, the infinite sums in (6) and (7) converge quickly, and their computation to any desired degree of accuracy is straightforward. Let us therefore focus on the calculation of the roots βj. The main problem is that there is an infinity of βj, and there is no known closed-form expression for these values. However, given a relatively close first approximation

, Newton's method may be used to compute βj accurately. Thus, how can

be obtained?
DeLong (1981) provides an asymptotic approximation (as j approaches infinity) that is very accurate for large values of j, and fairly accurate even for small j, unless the number of parameters p is large. Thus,

Newton's method could be applied using this value as an initial guess

. If βj(n) is the nth guess, the n + 1 approximation is given by

The derivative M1 may be computed analytically or numerically, and βj(n) generally converges to βj quickly.
The problem with this method is that

is not always sufficiently accurate, particularly if the value of p is large. In such cases, Newton's method may converge to the wrong βj. A more reliable method, though computationally somewhat more costly, is to perform a grid search to identify the approximate location of each βj and then to apply Newton's method using each approximate location as an initial approximation. Because of its reliability, an optimally constructed grid search is the preferable method.
Thus, consider a grid for β based on an increment of size δ > 0 and look successively at M(nδ + p/2,p/2,−c/2), n = 0,1,… until a change of sign is detected. If the sign changes for β between nδ and (n + 1)δ, Newton's method may be used locally to compute the zero.1
This approach was implemented with a small arbitrary value of δ in Estrella and Fuhrer (2003).
PROPOSITION 1. Let mn = M(n + b,b,z) for n = 0,1,…. Then m0 = exp(z), m1 = ((b + z)/b)m0, and mn+1 = (2 + (z − b)/(n + b))mn + (b/(n + b) − 1)mn−1 for n ≥ 1.
PROPOSITION 2. Let βj and βj+1 be two consecutive roots of M(β + p/2, p/2,−c/2) as a function of β > 0. Then |βj+1 − βj| = βj+1 − βj > 1.
PROPOSITION 3.

, so that αj λ−βj > 0 for all j.
Proposition 2 implies that we can take δ = 1 with no danger of missing any of the roots βj. Any interval one unit long contains at most one root, and this root is more than one unit away from the nearest roots. Moreover, to speed up the grid search, we may use the recursive formula in Proposition 1 and obviate the need to evaluate M at every point n = 0,1,…. Once a change is detected, specifically when mn+1 mn ≤ 0, we can find a root in the interval (mn,mn+1] using Newton's method. The initial guess is determined by linear interpolation in this interval.
This process may be used to continue identifying roots until the number of terms in the infinite sum in (7) is sufficient to obtain the desired level of accuracy. Proposition 3 implies that all the terms in (7) are positive and one may stop when the last term computed is smaller than some positive tolerance level.
3.2. Numerical Results
To check the accuracy of the computational method described previously, the method was used to replicate the relevant tables in DeLong (1981). DeLong's Table I (first four panels) contains probabilities that correspond to the application of (7) to 1,500 combinations of the parameters p, λ, and c. The method was applied with tolerance levels that provide accuracy to at least the four decimal places given by DeLong. The results matched DeLong's exactly in more than 98% of cases.
In cases where the results differ, DeLong's figure was always slightly lower, suggesting perhaps the inclusion of fewer terms from expression (7) (because all are positive by Proposition 3). Most differences were very minor, however, only 0.0001. A few larger differences were found only in cases in which p = 1 and c = 1. These differences were all less than 0.0042 and in most instances were much smaller. As a robustness check in light of these puzzling discrepancies, the method of Section 3.1 was applied with p = 1 and c = 1 ± ε, for small values of ε. The same results as with c = 1 were obtained.
DeLong's Table II presents critical values c, to two decimal places, corresponding to various combinations (375 altogether) of the parameters p and λ. This table was replicated by inverting the numerical probability function of Section 3.1, using another application of Newton's method. The results of DeLong's Table II were matched exactly.
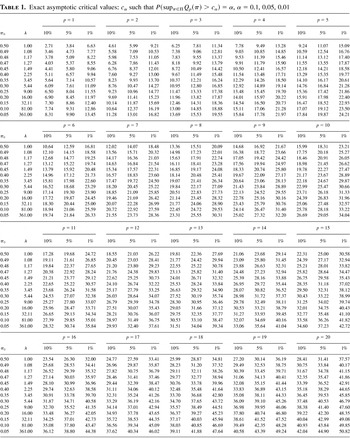
Finally, the method was used with the same tolerance level to recalculate Table 1 of critical values in Andrews (1993), which is widely cited as a reference in both the theoretical and applied literatures. Exact results are presented here in Table 1. Note that, following Andrews (1993), these results are tabulated according to π0, the proportion of data points dropped at either end of the sample, rather than λ, as given in equation (4). Andrews calculates his figures by stochastic simulation of the Bessel process over the unit interval. These simulation results are subject to discretization bias and to sampling error. Discretization bias results because continuous Brownian motion is approximated using a large but finite number of normal distributions over small disjoint intervals. This bias is notoriously difficult to eliminate, even when using very small intervals.
Exact asymptotic critical values: cα such that P(supπ∈Π Qp(π) > cα) = α, α = 0.1, 0.05, 0.01

Andrews (1993) splits the unit interval into 3,600 segments, and yet his critical values tend to be a bit low, most likely as a result of discretization. In most cases, however, the approximations are reasonably close. Exceptions are the values for p = 8, which are particularly low for no obvious reason. Andrews (2003) provides a revised table based on a larger number of simulation iterations. The entries for p = 8 are no longer outliers, and the sampling error is reduced. However, some discretization bias remains.
Discretization does not necessarily lead to less accurate results, because the timing of observations in a finite sample maps to a discrete set of points in the unit interval, rather than the infinity of points corresponding to the asymptotic theory. However, use of the exact asymptotic distribution seems preferable in most applications. One important reason is that simple discretization assumes that increments are independent and normally distributed, a result that derives from the application of central limit theorems (as in Andrews, 1993, Theorem 1) in the asymptotic case. Assuming independence and normality directly in finite samples is possible but is much more restrictive than the typical assumptions of the asymptotic GMM approach.
4. ASYMPTOTIC APPROXIMATION
4.1. Approximate Probability for Large c
Because DeLong's formula has been considered intractable, various researchers have proposed using an asymptotic approximation to the formula, which is accurate when c is large. In fact, DeLong (1981) himself derives such an approximation, though special cases had been known earlier. The approximation is based on an expansion of the probability from equation (4) in terms of powers of c. Specifically,

The asymptotic approximation is obtained by ignoring the term O(c−2) in (10), resulting in a closed-form expression as a function of the arguments p, λ, and c. Dirkse (1975) studies essentially the same distribution but with the Bessel process constructed from univariate Brownian motion (p = 1). He does not derive an expression for the exact probability but proceeds directly to the calculation of the asymptotic approximation, which matches (10) exactly (with p = 1).2
Several papers have proposed approximations that are formally the same as (10) but with 4/c replacing 2/c within the last brackets. These include Miller and Siegmund (1982), Siegmund (1985, 1986), James et al. (1987), and Bai (1999). Siegmund (1985, equation (11.1)) and (1986, equation (2.29)) also gives the formula with 2/c, although at least in the 1985 paper the preferred value seems to be 4/c. A straightforward way to determine the appropriate value of this constant is to evaluate the formula using parameter values that lead to a simplified expression. For example, if p = 1 and π0 = ½, the exact distribution is χ12. The asymptotic approximation with 2/c (as in (10)) reduces to A(2) = 2φ(c1/2)/c1/2 + o(φ(c1/2)/c1/2), and it may be shown that limc→∞ A(2)/(1 − χ12(c)) = 1, as expected. If 4/c is used, limc→∞ A(4)/(1 − χ12(c)) = 2. Thus, 2/c is correct, which confirms the results of DeLong (1981) and Dirkse (1975) and the alternative results of Siegmund (1985, 1986).
4.2. Accuracy of Asymptotic Approximation
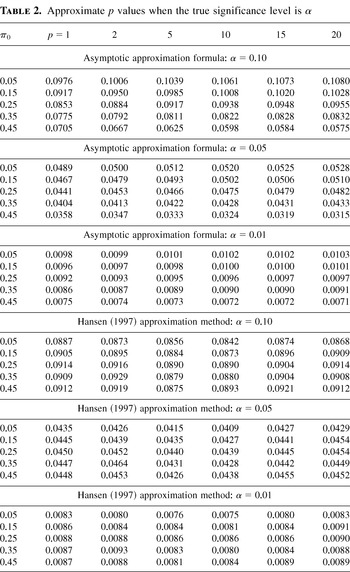
To gauge the accuracy of the asymptotic approximation, we perform the following experiment. First, using the exact distribution for a given set of parameter values, we obtain the critical value corresponding to a significance level α, where α is 10, 5, or 1%. Then, we apply the approximation formula to the critical value. The more accurate the approximation, the closer the resulting approximate p value will be to α. The first part of Table 2 provides results for selected values of p ranging from 1 to 20 and for selected values of π0 ranging from 0.05 to 0.45. These ranges are likely to be representative of values encountered in practice.
Approximate p values when the true significance level is α

As the table indicates, results for π0 = 0.05 and 0.15 are quite accurate for all three significance levels, particularly for α = 0.01. This pattern is explained by the assumptions underlying the asymptotic approximation, which correspond to low values of both α and π0. To see this, note that in DeLong's derivation, he makes the assumption that λ is large and, correspondingly, that π0 is small. Moreover, the result is obtained by allowing the critical value c to be arbitrarily large, which corresponds to an arbitrarily low significance level α. When π0 = 0.25, the results deteriorate somewhat, and the errors are more pronounced for larger π0, particularly when both π0 and p are large. For instance when π0 = 0.45, p = 20, and the true significance level is 10%, the formula produces an approximate significance level of 5.75%.
5. HANSEN APPROXIMATION
Hansen (1997) introduces an alternative approach to approximating the p values of the supremum of the Bessel process. The approach involves very extensive preliminary computations, but once those results are obtained and stored in look-up tables, the approximation reduces to the computation of a chi square probability (with noninteger degrees of freedom).
In arriving at this method, Hansen (1997) observes that the shape of the distribution in question is roughly similar to that of the chi square. Thus, for a pair of parameter values (π0, p), he fits a curve of the form

by selecting values of the parameters (a, b, ν) so as to minimize a specific loss function. The “actual” y values are generated from simulations similar to those of Andrews (1993), except that 1,000 points are used in the unit interval, rather than 3,600 as in Andrews. Thus, the discretization bias will tend to be larger. Hansen's loss function is a weighted sum of squared deviations, with larger weights attached to significance levels up to 0.10, which are generally the focus of empirical research.
The method used in the previous section to gauge the accuracy of the asymptotic approximation is applied to the Hansen approximation in the second part of Table 2. In contrast to the results for the asymptotic approximation, the errors in this panel are very consistent across values of the parameters. The errors are not as large as some of those obtained with the asymptotic approximation, but the approximate p values are all lower than the true values, by about 10 to 20% of the p value. Thus, the approximation uniformly overstates significance. It is likely that this pattern is related to the discretization bias in the simulations, which, as noted earlier, can be surprisingly large even with a seemingly large number of points.
6. CONCLUSIONS
This paper has demonstrated that exact asymptotic p values for supremum-based break test statistics are not as intractable as they might appear from the earlier literature. A quick simple method is outlined, which may be executed with existing statistical packages. The method is used to provide a table of exact critical values corresponding to the table in Andrews (1993).
With the availability of this method, the various approximations found in the literature lose some of their appeal. Nevertheless, it is important to examine the accuracy of these approximations to the extent that they have been used in the empirical literature and may have possibly led to misleading conclusions regarding significance of results. Thus, the paper analyzes the accuracy of the approximations and reaches several general conclusions.
First, simulation-based approximations are subject to noticeable discretization bias, even when a large number of points is used. However, for the most part, the simulated critical values provided in Andrews (1993, 2003) are fairly accurate.3
The only caveat is that caution must be used when the number of parameters is 8 in the 1993 table, because these values contain some large errors.
Second, the asymptotic approximation is quite accurate for p values up to 10% when π0 ≤ 0.15. When the proportion of points not tested at the ends is larger than 0.15, the accuracy of the asymptotic approximation can be substantially lower.
Finally, conclusions based on the Hansen (1997) approximation are not likely to be overturned if they are very strong or very weak, because the approximation error is not large and is consistent in magnitude across parameter values. However, results that are reported to be marginally significant may be misclassified by the approximation.
APPENDIX: PROOFS OF PROPOSITIONS
Proof of Proposition 1. Abramowitz and Stegun (1964) provide the following results:


The second equality in (A.2) follows by direct substitution of the argument values into (6), because (−1)j = 0 for j > 1. Expressions for m0 and m1 follow immediately from equations (A.1) and (A.2), respectively. Substitution of a = n + b in (A.3) leads to the difference equation in Proposition 1, after solving for mn+1. █
Proof of Proposition 2. Substitute b = p/2 and z = −c/2 in the difference equation from Proposition 1, which becomes

The strategy is to show that the oscillatory frequency of mn (hence the frequency of its zeros) increases as a function of c. In the limit as c → ∞, the length of a cycle approaches 2, independently of the value of n, and the zeros are equally spaced at the integers. Thus, for finite c, the difference between any two zeros is greater than 1.
The characteristic equation corresponding to (A.4) is

which has roots given by

The local oscillatory frequency of the difference equation is given by θn = arg(λn), where arg indicates the argument of the root as a complex number. The subscripts of λn and θn signify that these measures vary as a function of n, because the coefficients in (A.5) vary with n. If the coefficients were constant, λn and θn would also be constant, and the solution could be expressed as a simple exponential function of the λn.
Now, λn is real or complex according to the sign of the expression within the radical in (A.6). Consider the root corresponding to the positive sign in (A.6). The analysis of the other root is analogous. If we focus on the value of c, we have to treat three separate cases. Let

and

Then, if 0 < c ≤ c1, λn is real and positive; hence θn = 0. If c1 < c < c2, λn is complex with positive imaginary part, and its real part is a decreasing function of c (see (A.6)). Thus, θn is an increasing function of c. Finally, if c ≥ c2, λn is real and negative; hence θn = π. Note that θn is continuous at c1 and c2 and that these results hold for all n. Thus, for any given n, θn is a continuous nondecreasing function of c, which is strictly increasing in the oscillatory cases corresponding to c1 < c < c2. The distance between two zeros in the oscillatory case corresponds to one-half of the wavelength, π/θn, which is clearly decreasing in c.
To complete the proof, we cite DeLong's (1981) result that if βj is the jth root of M(β + p/2,p/2,−c/2) as a function of β, then βj → j − 1 as c → ∞ and hence βj+1 − βj → 1. Note that this result is consistent with the preceding oscillation analysis, because c → ∞ implies that θn = π and that the half-wavelength, which corresponds to the distance between consecutive zeros, is such that π/θn → 1. █
Proof of Proposition 3. Let βj be the jth zero of M(β + p/2,p/2,−c/2) as a function of β. Then by equation 13.4.5 of Abramowitz and Stegun (1964),

Because Proposition 2 implies that there are no zeros between βj and βj + 1, we also have that

The result follows immediately. █
References
REFERENCES
Abramowitz, M. &
I.A. Stegun
(1964)
Handbook of Mathematical Functions.
Washington, D.C.:
U.S. Department of Commerce.
Akman, V.E. &
A.E. Raftery
(1986)
Asymptotic inference for a change-point Poisson process.
Annals of Statistics
14,
1583–1590.Google Scholar
Anderson, T.W. &
D.A. Darling
(1952)
Asymptotic theory of certain “goodness of fit” criteria
based on stochastic processes.
Annals of Mathematical Statistics
23,
193–212.Google Scholar
Andrews, D.W.K.
(1993)
Tests for parameter instability and structural change with unknown
change point.
Econometrica
61,
821–856.Google Scholar
Andrews, D.W.K.
(2003)
Tests for parameter instability and structural change with unknown
change point: Corrigendum.
Econometrica
71,
395–397.Google Scholar
Andrews, D.W.K. &
R.C. Fair
(1988)
Inference in nonlinear econometric models with structural change.
Review of Economic Studies
55,
615–640.Google Scholar
Andrews, D.W.K. &
W. Ploberger
(1984)
Optimal tests when a nuisance parameter is present only under the
alternative.
Econometrica
62,
1383–1414.Google Scholar
Bai, J.
(1999)
Likelihood ratio tests for multiple structural changes.
Journal of Econometrics
91,
299–323.Google Scholar
Bai, J. &
P. Perron
(1998)
Estimating and testing linear models with multiple structural
changes.
Econometrica
66,
47–78.Google Scholar
DeLong, D.M.
(1981)
Crossing probabilities for a square root boundary by a Bessel
process.
Communications in Statistics—Theory and Methods
A10,
2197–2213.Google Scholar
Dirkse, J.P.
(1975)
An absorption probability for the Ornstein–Uhlenbeck process.
Journal of Applied Probability
12,
595–599.Google Scholar
Estrella, A. &
J.C. Fuhrer
(2003)
Monetary policy shifts and the stability of monetary policy models.
Review of Economics and Statistics
85,
94–104.Google Scholar
Ghysels, E.,
A. Guay, &
A. Hall
(1997)
Predictive tests for structural change with unknown breakpoint.
Journal of Econometrics
82,
209–233.Google Scholar
Hansen, B.E.
(1997)
Approximate asymptotic P values for structural-change
tests.
Journal of Business and Economic Statistics
15,
60–67.Google Scholar
James, B.,
K.L. James, &
D. Siegmund
(1987)
Tests for a change-point.
Biometrika
74,
71–83.Google Scholar
Miller, R. &
D. Siegmund
(1982)
Maximally selected chi square statistics.
Biometrics
38,
1011–1016.Google Scholar
Siegmund, D.
(1985)
Sequential Analysis: Tests and Confidence Intervals.
New York:
Springer-Verlag.
Siegmund, D.
(1986)
Boundary crossing probabilities and statistical applications.
Annals of Statistics
14,
361–404.Google Scholar
Exact asymptotic critical values: cα such that P(supπ∈Π Qp(π) > cα) = α, α = 0.1, 0.05, 0.01
Approximate p values when the true significance level is α
 You have
Access
- 28
- Cited by