1 Introduction
Since the pioneering study of Orszag & Patterson (Reference Orszag and Patterson1972a ) over forty years ago, direct numerical simulation (DNS) has been widely used to study turbulent flows. Previous DNS studies have provided a wealth of information about the underlying turbulent flow field, much of which is very difficult to obtain experimentally, including Lagrangian statistics (Yeung & Pope Reference Yeung and Pope1989), pressure fluctuations (Spalart Reference Spalart1988) and velocity gradient tensors (Ashurst et al. Reference Ashurst, Kerstein, Kerr and Gibson1987).
Only within the last ten years, however, with the advent of tera- and petascale computing, have DNS at Reynolds numbers comparable to those in the largest laboratory experiments become possible. The highest-Reynolds-number simulations to date (with Taylor microscale Reynolds numbers
 $R_{{\it\lambda}}\sim 1000$
) have been of isotropic turbulence in triperiodic domains and have considered both the Eulerian dynamics of the turbulent flow field and the Lagrangian dynamics of inertialess tracer (i.e. fluid) particles advected by the flow (Kaneda et al.
Reference Kaneda, Ishihara, Yokokawa, Itakura and Uno2003; Ishihara et al.
Reference Ishihara, Kaneda, Yokokawa, Itakura and Uno2007; Ishihara, Gotoh & Kaneda Reference Ishihara, Gotoh and Kaneda2009; Yeung, Donzis & Sreenivasan Reference Yeung, Donzis and Sreenivasan2012).
Many industrial and environmental turbulent flows, however, are laden with dense, inertial particles, which can display profoundly different dynamics than inertialess fluid particles. The degree to which the dynamics of inertial particles differs from those of fluid particles depends on their Stokes number
 $St$
, a non-dimensional measure of particle inertia, which we define based on Kolmogorov-scale turbulence. We summarize the relevant physical mechanisms at small, intermediate and large values of
 $St$
below.
It is well known from both computational and experimental studies that inertial particles preferentially sample certain regions of the flow (e.g. see Balachandar & Eaton Reference Balachandar and Eaton2010). This preferential sampling is often attributed to the fact that heavy particles are centrifuged out of vortex cores and accumulate in low vorticity and high strain regions (Maxey Reference Maxey1987; Squires & Eaton Reference Squires and Eaton1991; Eaton & Fessler Reference Eaton and Fessler1994), leading to higher collision rates (Sundaram & Collins Reference Sundaram and Collins1997). However, this centrifuge mechanism is mainly important for small-
 $St$
particles that are strongly coupled to the underlying flow. As
 $St$
is increased, the particle dynamics becomes less coupled to the local fluid velocity field and the influence of their path-history interactions with the turbulence becomes increasingly important (e.g. see Bragg & Collins Reference Bragg and Collins2014b
). Particles with sufficiently large
 $St$
can therefore come together from different regions of the flow with large relative velocities, increasing their collision rate (Wilkinson, Mehlig & Bezuglyy Reference Wilkinson, Mehlig and Bezuglyy2006; Falkovich & Pumir Reference Falkovich and Pumir2007). Such a process is referred to as ‘caustics’ (Wilkinson et al.
Reference Wilkinson, Mehlig and Bezuglyy2006) and the ‘sling effect’ (Falkovich & Pumir Reference Falkovich and Pumir2007). At high values of
 $St$
, several studies (e.g. Bec et al.
Reference Bec, Biferale, Boffetta, Celani, Cencini, Lanotte, Musacchio and Toschi2006a
; Ayyalasomayajula, Warhaft & Collins Reference Ayyalasomayajula, Warhaft and Collins2008) have shown that particles have a modulated response to the underlying turbulence as they filter out high-frequency flow features (i.e. features with time scales significantly below the particle response time), and they therefore have lower kinetic energies and lower accelerations.
Despite recent advances in simulating high-Reynolds-number turbulent flows, current studies of inertial particles in turbulence are primarily at low and moderate Reynolds numbers (
 $R_{{\it\lambda}}\lesssim 500$
), and only recently have DNSs been conducted of inertial particles in turbulence with a well-defined inertial range (Bec et al.
Reference Bec, Biferale, Cencini, Lanotte and Toschi2010a
,Reference Bec, Biferale, Lanotte, Scagliarini and Toschi
b
; Pan et al.
Reference Pan, Padoan, Scalo, Kritsuk and Norman2011; Ray & Collins Reference Ray and Collins2011; Pan & Padoan Reference Pan and Padoan2013; Rosa et al.
Reference Rosa, Parishani, Ayala, Grabowski and Wang2013). It is vital to understand the effect of Reynolds number on the mechanisms above (preferential sampling, path-history interactions and inertial filtering), particularly at higher Reynolds numbers that are more representative of those in nature. We give two examples to emphasize the importance of developing such an understanding.
The first example, cloud formation, is the primary motivation for this work. For reviews on this subject, see Shaw (Reference Shaw2003), Devenish et al. (Reference Devenish, Bartello, Brenguier, Collins, Grabowski, IJzermans, Malinowski, Reeks, Vassilicos and Wang2012), Grabowski & Wang (Reference Grabowski and Wang2013); here we provide a brief overview. It is well known that standard microphysical cloud models overpredict the time required for the onset of precipitation in warm cumulus clouds (e.g. see Shaw Reference Shaw2003). At early stages of cloud formation, particles experience condensational growth. This process slows down quickly with increasing droplet diameter, making condensational growth effective only for droplets with diameters less than approximately
 $30~{\rm\mu}\text{m}$
(Grabowski & Wang Reference Grabowski and Wang2013). Moreover, gravity is only able to significantly enhance collisional growth for particles with diameters above
 $80~{\rm\mu}\text{m}$
(Pruppacher & Klett Reference Pruppacher and Klett1997; Grabowski & Wang Reference Grabowski and Wang2013), leaving a ‘size gap’ where neither condensational growth nor gravitational coalescence is very effective. For particles between these two limits, it has been proposed that turbulence-induced collisions are primarily responsible for droplet growth.
It is unclear, however, the extent to which particle collision rates are affected by changes in Reynolds number at conditions representative of those in cumulus clouds (which have
 $R_{{\it\lambda}}\sim 10\,000$
, see Siebert, Lehmann & Wendisch (Reference Siebert, Lehmann and Wendisch2006)). Sundaram & Collins (Reference Sundaram and Collins1997) showed that particle collision rates depend on both the degree of clustering and on the relative velocities between particles, and thus many subsequent analyses have considered the Reynolds-number dependence of both of these statistics. While the early study of Wang, Wexler & Zhou (Reference Wang, Wexler and Zhou2000) suggested that clustering increases with
 $R_{{\it\lambda}}$
, later investigations (Collins & Keswani Reference Collins and Keswani2004; Bec et al.
Reference Bec, Biferale, Cencini, Lanotte and Toschi2010a
; Ray & Collins Reference Ray and Collins2011; Rosa et al.
Reference Rosa, Parishani, Ayala, Grabowski and Wang2013) indicate that clustering saturates at higher Reynolds numbers. Other researchers have suggested that caustics become more prevalent at high Reynolds numbers, leading to larger relative velocities and thus more frequent particle collisions (Falkovich, Fouxon & Stepanov Reference Falkovich, Fouxon and Stepanov2002; Wilkinson et al.
Reference Wilkinson, Mehlig and Bezuglyy2006). The findings of Bec et al. (Reference Bec, Biferale, Cencini, Lanotte and Toschi2010a
) and Rosa et al. (Reference Rosa, Parishani, Ayala, Grabowski and Wang2013), however, do not seem to support that trend. In all cases, the Reynolds-number range (
 $R_{{\it\lambda}}\lesssim 500$
) leaves open the question of whether the results apply to atmospheric conditions at much higher Reynolds numbers. Laboratory measurements of inertial particle clustering (Salazar et al.
Reference Salazar, de Jong, Cao, Woodward, Meng and Collins2008; Saw et al.
Reference Saw, Shaw, Ayyalasomayajula, Chuang and Gylfason2008; Lu, Nordsiek & Shaw Reference Lu, Nordsiek and Shaw2010; Monchaux, Bourgoin & Cartellier Reference Monchaux, Bourgoin and Cartellier2010; Saw et al.
Reference Saw, Shaw, Salazar and Collins2012) and relative velocity statistics (de Jong et al.
Reference de Jong, Salazar, Cao, Woodward, Collins and Meng2010; Saw et al.
Reference Saw, Bewley, Bodenschatz, Ray and Bec2014) have provided reasonably good confirmation of the DNS; however, they too have been performed over a limited range of Reynolds numbers, and therefore have not fully addressed the question of how the collision kernel depends upon the Reynolds number.
The second example relates to planetesimal formation. Planetesimals begin to form when small dust grains collide and coalesce in turbulent protoplanetary nebulae (Pan & Padoan Reference Pan and Padoan2010). Cuzzi et al. (Reference Cuzzi, Hogan, Paque and Dobrovolskis2001) estimated that the turbulence in such nebulae is characterized by
 $R_{{\it\lambda}}\sim 10^{4}{-}10^{6}$
. It is unclear to what extent the rate of coalescence depends on the Reynolds number, and studies at progressively higher Reynolds numbers are necessary to develop scaling relations for particle collision rates at conditions representative of nebula turbulence. Pan & Padoan (Reference Pan and Padoan2010) noted that the range of relevant particle sizes in the planetesimal formation process spans approximately nine orders of magnitude, and therefore we expect that the collision rates will be affected by preferential sampling (for small, medium and large particles), path-history interactions (for medium and large particles) and inertial filtering (for medium and large particles).
In this study, we use high-performance computing resources provided by the US National Center for Atmospheric Research (Computational and Information Systems Laboratory 2012) to simulate inertial particles in isotropic turbulence over the range
 $88\leqslant R_{{\it\lambda}}\leqslant 597$
. To our knowledge, the top value represents the highest Reynolds-number flow with particles simulated to date. The overall goal is to improve predictions for the collision kernel at Reynolds numbers more representative of those in atmospheric clouds. Gravitational forces are neglected in this study, but will be considered in detail in Part 2 of this study (Ireland, Bragg & Collins Reference Ireland, Bragg and Collins2016).
The paper is organized as follows: § 2 provides a summary of the numerical methods used and the relevant fluid and particle parameters. In § 3, we study single-particle statistics (small-scale velocity gradients, large-scale velocity fluctuations and also particle accelerations). Many of the results from this section help explain the particle-pair statistics presented in § 4. These statistics include the particle relative velocities, radial distribution functions and collision kernels. Finally, in § 5, we summarize our results and suggest practical implications for the turbulence and cloud physics communities.
2 Overview of simulations
A brief summary of the simulation parameters and numerical methods is provided below. Refer to Ireland et al. (Reference Ireland, Vaithianathan, Sukheswalla, Ray and Collins2013) for a more detailed description of the code, including integration techniques, parallelization strategies and interpolation methods.
2.1 Fluid phase
We perform DNS of isotropic turbulence on a cubic, triperiodic domain of length
 $\mathscr{L}=2{\rm\pi}$
with
 $N^{3}$
grid points. A pseudospectral method (Orszag & Patterson Reference Orszag and Patterson1972b
) is used to evaluate the continuity and momentum equations for an incompressible flow,
 $$\begin{eqnarray}\displaystyle & \boldsymbol{{\rm\nabla}}\boldsymbol{\cdot }\boldsymbol{u}=0, & \displaystyle\end{eqnarray}$$
 $$\begin{eqnarray}\displaystyle & \displaystyle \frac{\partial \boldsymbol{u}}{\partial t}+{\bf\omega}\times \boldsymbol{u}+\boldsymbol{{\rm\nabla}}\left(\frac{p}{{\it\rho}_{f}}+\frac{u^{2}}{2}\right)={\it\nu}{\rm\nabla}^{2}\boldsymbol{u}+\boldsymbol{f}. & \displaystyle\end{eqnarray}$$
Here,
 $\boldsymbol{u}$
is the fluid velocity,
 ${\bf\omega}\equiv \boldsymbol{{\rm\nabla}}\times \boldsymbol{u}$
is the vorticity,
 $p$
is the pressure,
 ${\it\rho}_{f}$
is the fluid density,
 ${\it\nu}$
is the kinematic viscosity and
 $\boldsymbol{f}$
is a large-scale forcing term that is added to make the flow field statistically stationary. For our simulations, we added forcing to wavenumbers with magnitude
 ${\it\kappa}=\sqrt{2}$
in Fourier space in a deterministic fashion to compensate precisely for the energy lost to viscous dissipation (Witkowska, Brasseur & Juvé Reference Witkowska, Brasseur and Juvé1997).


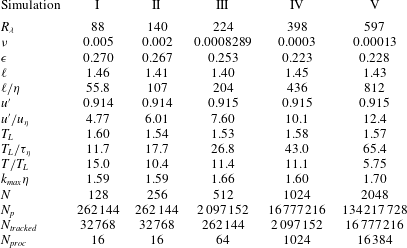
We perform a series of five different simulations, with Taylor microscale Reynolds numbers
 $R_{{\it\lambda}}\equiv 2k\sqrt{5/(3{\it\nu}{\it\epsilon})}$
ranging from 88 to 597, where
 $k$
denotes the turbulent kinetic energy and
 ${\it\epsilon}$
the turbulent energy dissipation rate. Details of the simulations are given in table 1. The simulations are parameterized to have similar large scales, but different dissipation (small) scales. The small-scale resolution for the simulations was held constant, with
 ${\it\kappa}_{\mathit{max}}{\it\eta}\approx 1.6{-}1.7$
, where
 ${\it\kappa}_{\mathit{max}}\equiv \sqrt{2}N/3$
is the maximum resolved wavenumber and
 ${\it\eta}\equiv ({\it\nu}^{3}/{\it\epsilon})^{1/4}$
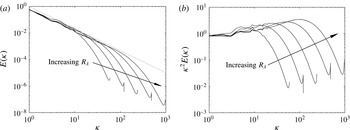
is the Kolmogorov length scale. Dealiasing is performed using a combination of spherical truncation and phase shifting. Time-averaged energy and dissipation spectra for all five simulations are shown in figure 1. A clear
 $-5/3$
spectral slope is evident for the three highest Reynolds-number cases (
 $R_{{\it\lambda}}\geqslant 224$
), indicating the presence of a well-defined inertial subrange. The simulations are performed in parallel on
 $N_{\mathit{proc}}$
processors, and the P3DFFT library (Pekurovsky Reference Pekurovsky2012) is used for efficient parallel computation of three-dimensional fast Fourier transforms.
(a) Energy and (b) dissipation spectra for the different simulations described in table 1. The diagonal dotted line in (a) has a slope of
 $-5/3$
, the expected spectral scaling in the inertial subrange. All values are in arbitrary units.

2.2 Particle phase
We simulate the motion of small (
 $d/{\it\eta}\ll 1$
, where
 $d$
is the particle diameter), heavy (
 ${\it\rho}_{p}/{\it\rho}_{f}\gg 1$
, where
 ${\it\rho}_{p}$
is the particle density), spherical particles. Eighteen different particle classes are simulated with Stokes numbers
 $St$
ranging from 0 to 30.
 $St\equiv {\it\tau}_{p}/{\it\tau}_{{\it\eta}}$
is a non-dimensional measure of a particle’s inertia, comparing the response time of the particle
 ${\it\tau}_{p}\equiv {\it\rho}_{p}d^{2}/(18{\it\rho}_{f}{\it\nu})$
to the Kolmogorov time scale
 ${\it\tau}_{{\it\eta}}\equiv ({\it\nu}/{\it\epsilon})^{1/2}$
.
We assume that the particles are subjected to only linear drag forces, which is a reasonable approximation when the particle Reynolds number
 $Re_{p}\equiv |\boldsymbol{u}(\boldsymbol{x}^{p}(t),t)-\boldsymbol{v}^{p}(t)|/{\it\nu}<0.5$
(Elghobashi & Truesdell Reference Elghobashi and Truesdell1992). Here,
 $\boldsymbol{u}(\boldsymbol{x}^{p}(t),t)$
denotes the undisturbed fluid velocity at the particle position
 $\boldsymbol{x}^{p}(t)$
and
 $\boldsymbol{v}^{p}(t)$
denotes the velocity of the particle. (Throughout this study, we use the superscript
 $p$
on
 $\boldsymbol{x}$
,
 $\boldsymbol{u}$
, and
 $\boldsymbol{v}$
to denote time-dependent Lagrangian variables defined along particle trajectories. Phase-space positions and velocities are denoted without the superscript
 $p$
.) Though particles with large
 $St$
experience non-negligible nonlinear drag forces (e.g. Wang & Maxey Reference Wang and Maxey1993), the use of a linear drag model for large-
 $St$
particles provides a useful first approximation and facilitates comparison between several theoretical models that make the same assumption (e.g. Chun et al.
Reference Chun, Koch, Rani, Ahluwalia and Collins2005; Zaichik & Alipchenkov Reference Zaichik and Alipchenkov2009; Gustavsson & Mehlig Reference Gustavsson and Mehlig2011). We have also neglected the history force in this study. In an earlier work, Elghobashi & Truesdell (Reference Elghobashi and Truesdell1992) showed that the Basset history force is orders of magnitude smaller than the Stokes drag force when
 ${\it\rho}_{p}/{\it\rho}_{f}\gg 1$
(here our primary focus is on water droplets in air, where
 ${\it\rho}_{p}/{\it\rho}_{f}\sim 1000$
). On this basis, most DNS of inertial particles in turbulence neglect this term, which involves an integral and is very expensive to compute. However, Daitche (Reference Daitche2015) showed that the Basset history term can slightly reduce particle clustering and collision rates for higher values of
 $St$
, and thus while we expect that our particle statistics generally have the correct leading-order behaviour, future studies are needed to systematically assess higher-order corrections to these statistics that result from the inclusion of the history force. The present study also neglects the influence of gravity. Part 2 of this study (Ireland et al.
Reference Ireland, Bragg and Collins2016) will address the combined effects of gravity and turbulence on particle motion. Finally, since a primary motivation is to understand droplet dynamics in atmospheric clouds, where the particle mass and volume loadings are low (Shaw Reference Shaw2003), we assume that the particle loadings are sufficiently dilute such that interparticle interactions and two-way coupling between the phases are negligible (Elghobashi & Truesdell Reference Elghobashi and Truesdell1993; Sundaram & Collins Reference Sundaram and Collins1999).
Under these assumptions, each inertial particle obeys a simplified Maxey–Riley equation (Maxey & Riley Reference Maxey and Riley1983),
 $$\begin{eqnarray}\frac{\text{d}^{2}\boldsymbol{x}^{p}}{\text{d}t^{2}}=\frac{\text{d}\boldsymbol{v}^{p}}{\text{d}t}=\frac{\boldsymbol{u}(\boldsymbol{x}^{p}(t),t)-\boldsymbol{v}^{p}(t)}{{\it\tau}_{p}},\end{eqnarray}$$
and each fluid (i.e. inertialess) particle is tracked by solving
 $$\begin{eqnarray}\frac{\text{d}\boldsymbol{x}^{p}}{\text{d}t}=\boldsymbol{u}(\boldsymbol{x}^{p}(t),t).\end{eqnarray}$$
To compute
 $\boldsymbol{u}^{p}(t)=\boldsymbol{u}(\boldsymbol{x}^{p}(t),t)$
, we need to interpolate from the Eulerian grid to the particle location. While other studies (e.g. see Bec et al.
Reference Bec, Biferale, Cencini, Lanotte and Toschi2010a
; Durham et al.
Reference Durham, Climent, Barry, Lillo, Boffetta, Cencini and Stocker2013) have done so using trilinear interpolation, Ireland et al. (Reference Ireland, Vaithianathan, Sukheswalla, Ray and Collins2013) showed that such an approach can lead to errors in the interpolated velocity that are orders of magnitude above the local time-stepping error. In addition, van Hinsberg et al. (Reference van Hinsberg, ten Thije Bookkkamp, Toschi and Clercx2013) demonstrated that trilinear interpolation, which possesses only
 $C^{0}$
continuity, leads to artificial high-frequency oscillations in the computed particle accelerations. Ray & Collins (Reference Ray and Collins2013) noted that the relative motion of particles at small separations will depend strongly on the interpolation scheme. Since a main focus of this paper is particle motion near contact and its influence on particle collisions, it is crucial to calculate
 $\boldsymbol{u}(\boldsymbol{x}^{p}(t),t)$
as accurately as possible. To that end, we use an eight-point B-spline interpolation scheme (with
 $C^{6}$
continuity) based on the algorithm in van Hinsberg et al. (Reference van Hinsberg, Thije Boonkkamp, Toschi and Clercx2012).
The particles were initially placed in the flow with a uniform distribution and velocities
 $\boldsymbol{v}^{p}$
equal to the underlying fluid velocity
 $\boldsymbol{u}^{p}$
. We began computing particle statistics once the particle distributions and velocities became statistically stationary, usually approximately 5 large eddy turnover times
 $T_{L}\equiv \ell /u^{\prime }$
(where
 $\ell$
is the integral length scale and
 $u^{\prime }\equiv \sqrt{2k/3}$
) after the particles were introduced into the flow. Particle statistics were calculated at a frequency of 2–3 times per
 $T_{L}$
and were time averaged over the duration of the run
 $T$
.
For a subset
 $N_{\mathit{tracked}}$
of the total number of particles in each class
 $N_{p}$
, we stored particle positions, velocities and velocity gradients every
 $0.1{\it\tau}_{{\it\eta}}$
for a duration of approximately
 $100{\it\tau}_{{\it\eta}}$
. These data are used to compute Lagrangian correlations, accelerations and time scales of the particles.
3 Single-particle statistics
We first consider single-particle statistics from our simulations. These statistics will provide a basis for our understanding of the two-particle statistics presented in § 4. We explore velocity gradient (i.e. small-scale velocity) statistics in § 3.1, kinetic energy (i.e. large-scale velocity) statistics in § 3.2 and acceleration statistics in § 3.3. In each case, we study the effect of the underlying flow topology on these statistics.
3.1 Velocity gradient statistics
We consider the gradients of the underlying fluid velocity at the particle locations,
 $\unicode[STIX]{x1D63C}(\boldsymbol{x}^{p}(t),t)\equiv \boldsymbol{{\rm\nabla}}\boldsymbol{u}(\boldsymbol{x}^{p}(t),t)$
. These statistics provide us with information about the small-scale velocity field experienced by the particles. (Refer to Meneveau (Reference Meneveau2011) for a recent review on this subject.) In particular, to understand the interaction of particles with specific topological features of the turbulence, we decompose
 $\unicode[STIX]{x1D63C}(\boldsymbol{x}^{p}(t),t)$
into a symmetric strain rate tensor
 $\unicode[STIX]{x1D64E}(\boldsymbol{x}^{p}(t),t)\equiv [\unicode[STIX]{x1D63C}(\boldsymbol{x}^{p}(t),t)+\unicode[STIX]{x1D63C}^{\text{T}}(\boldsymbol{x}^{p}(t),t)]/2$
and an antisymmetric rotation rate tensor
 $\unicode[STIX]{x1D64D}(\boldsymbol{x}^{p}(t),t)\equiv [\unicode[STIX]{x1D63C}(\boldsymbol{x}^{p}(t),t)-\unicode[STIX]{x1D63C}^{\text{T}}(\boldsymbol{x}^{p}(t),t)]/2$
.
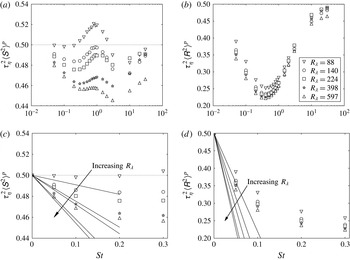
Data for
 $\langle \unicode[STIX]{x1D61A}^{2}\rangle ^{p}$
(a,c) and
 $\langle \unicode[STIX]{x1D619}^{2}\rangle ^{p}$
(b,d) sampled at inertial particle positions as function of
 $St$
for different values of
 $R_{{\it\lambda}}$
. The data are shown at low
 $St$
in (c,d) to highlight the effect of preferential sampling in this regime. The solid lines in (c,d) are the predictions from (3.3) for
 $St\ll 1$
. DNS data are shown with symbols.

Due to their inertia, heavy particles are ejected out of regions of high rotation rate and accumulate in regions of high strain rate (e.g. Maxey Reference Maxey1987; Squires & Eaton Reference Squires and Eaton1991; Eaton & Fessler Reference Eaton and Fessler1994), and this is associated with a ‘preferential sampling’ of
 $\unicode[STIX]{x1D63C}(\boldsymbol{x},t)$
. For particles with low inertia (
 $St\ll 1$
), preferential sampling is the dominant mechanism affecting the particle motion (e.g. see Chun et al.
Reference Chun, Koch, Rani, Ahluwalia and Collins2005). As the particle inertia increases, the particle motion becomes increasingly decoupled from the local fluid turbulence, and the effect of the preferential sampling on the particle dynamics decreases. At the other limit (
 $St\gg 1$
), preferential sampling vanishes and the particles have a damped response to the underlying flow which leads them to sample the turbulence more uniformly (e.g. see Bec et al.
Reference Bec, Biferale, Boffetta, Celani, Cencini, Lanotte, Musacchio and Toschi2006a
).
We first consider the average of the second invariants of the strain rate and rotation rate tensors evaluated at the inertial particle positions
 $$\begin{eqnarray}\langle \unicode[STIX]{x1D61A}^{2}\rangle ^{p}\equiv \langle \unicode[STIX]{x1D64E}(\boldsymbol{x}^{p}(t),t)\boldsymbol{ : }\unicode[STIX]{x1D64E}(\boldsymbol{x}^{p}(t),t)\rangle ,\end{eqnarray}$$
and
 $$\begin{eqnarray}\langle \unicode[STIX]{x1D619}^{2}\rangle ^{p}\equiv \langle \unicode[STIX]{x1D64D}(\boldsymbol{x}^{p}(t),t)\boldsymbol{ : }\unicode[STIX]{x1D64D}(\boldsymbol{x}^{p}(t),t)\rangle .\end{eqnarray}$$
By definition, for fully mixed fluid particles (
 $St=0$
) in homogeneous turbulence,
 ${\it\tau}_{{\it\eta}}^{2}\langle \unicode[STIX]{x1D61A}^{2}\rangle ^{p}={\it\tau}_{{\it\eta}}^{2}\langle \unicode[STIX]{x1D619}^{2}\rangle ^{p}=0.5$
.
Since small-
 $St$
particles are centrifuged out of regions of high rotation, we expect that
 ${\it\tau}_{{\it\eta}}^{2}\langle \unicode[STIX]{x1D619}^{2}\rangle ^{p}$
will decrease with increasing
 $St$
; their accumulation in high strain regions would also lead to the expectation that
 ${\it\tau}_{{\it\eta}}^{2}\langle \unicode[STIX]{x1D61A}^{2}\rangle ^{p}$
will increase with increasing
 $St$
. In figure 2 we see that while
 ${\it\tau}_{{\it\eta}}^{2}\langle \unicode[STIX]{x1D619}^{2}\rangle ^{p}$
is more strongly affected by changes in
 $R_{{\it\lambda}}$
than is
 ${\it\tau}_{{\it\eta}}^{2}\langle \unicode[STIX]{x1D61A}^{2}\rangle ^{p}$
, both quantities decrease with increasing
 $St$
(for
 $St\ll 1$
). This surprising result is consistent with other DNS (Collins & Keswani Reference Collins and Keswani2004; Chun et al.
Reference Chun, Koch, Rani, Ahluwalia and Collins2005; Salazar & Collins Reference Salazar and Collins2012a
). Our data also show that both
 ${\it\tau}_{{\it\eta}}^{2}\langle \unicode[STIX]{x1D61A}^{2}\rangle ^{p}$
and
 ${\it\tau}_{{\it\eta}}^{2}\langle \unicode[STIX]{x1D619}^{2}\rangle ^{p}$
decrease with increasing
 $R_{{\it\lambda}}$
for
 $St\ll 1$
, in agreement with Collins & Keswani (Reference Collins and Keswani2004).
We use the formulation given in Chun et al. (Reference Chun, Koch, Rani, Ahluwalia and Collins2005) (and rederived in Salazar & Collins (Reference Salazar and Collins2012a
)) to model the effect of preferential sampling on
 ${\it\tau}_{{\it\eta}}^{2}\langle \unicode[STIX]{x1D61A}^{2}\rangle ^{p}$
and
 ${\it\tau}_{{\it\eta}}^{2}\langle \unicode[STIX]{x1D619}^{2}\rangle ^{p}$
in limit of
 $St\ll 1$
. Chun et al. (Reference Chun, Koch, Rani, Ahluwalia and Collins2005) and Salazar & Collins (Reference Salazar and Collins2012a
) showed that for an arbitrary quantity
 ${\it\phi}$
, the average value of
 ${\it\phi}$
sampled along a particle trajectory
 $\langle {\it\phi}\rangle ^{p}$
can be reconstructed entirely from fluid particle statistics using the relation,
 $$\begin{eqnarray}\langle {\it\phi}(St)\rangle ^{p}=\langle {\it\phi}(St=0)\rangle ^{p}+{\it\tau}_{{\it\eta}}{\it\sigma}_{{\it\phi}}^{p}St({\it\rho}_{\unicode[STIX]{x1D61A}^{2}{\it\phi}}^{p}{\it\sigma}_{\unicode[STIX]{x1D61A}^{2}}^{p}T_{\unicode[STIX]{x1D61A}^{2}{\it\phi}}^{p}-{\it\rho}_{\unicode[STIX]{x1D619}^{2}{\it\phi}}^{p}{\it\sigma}_{\unicode[STIX]{x1D619}^{2}}^{p}T_{\unicode[STIX]{x1D619}^{2}{\it\phi}}^{p}).\end{eqnarray}$$
Here,
 ${\it\sigma}_{Y}^{p}$
denotes the standard deviation of a variable
 $Y$
along a fluid particle trajectory,
 ${\it\rho}_{YZ}^{p}$
is the correlation coefficient between
 $Y$
and
 $Z$
,
 $$\begin{eqnarray}{\it\rho}_{YZ}^{p}\equiv \frac{\langle [Y(\boldsymbol{x}^{p}(t),t)-\langle Y(\boldsymbol{x}^{p}(t),t)\rangle ][Z(\boldsymbol{x}^{p}(t),t)-\langle Z(\boldsymbol{x}^{p}(t),t)\rangle ]\rangle }{{\it\sigma}_{Y}^{p}{\it\sigma}_{Z}^{p}}\end{eqnarray}$$
and
 $T_{YZ}^{p}$
is the Lagrangian correlation time,
 $$\begin{eqnarray}T_{YZ}^{p}\equiv \frac{\displaystyle \int _{0}^{\infty }\langle [Y(\boldsymbol{x}^{p}(0),0)-\langle Y(\boldsymbol{x}^{p}(0),0)\rangle ][Z(\boldsymbol{x}^{p}(s),s)-\langle Z(\boldsymbol{x}^{p}(s),s)\rangle ]\rangle \,\text{d}s}{\langle [Y(\boldsymbol{x}^{p}(0),0)-\langle Y(\boldsymbol{x}^{p}(0),0)\rangle ][Z(\boldsymbol{x}^{p}(0),0)-\langle Z(\boldsymbol{x}^{p}(0),0)\rangle ]\rangle }.\end{eqnarray}$$
The predictions from (3.3) for small
 $St$
are shown by the solid lines in figure 2(c,d). The data at the highest Reynolds numbers provide the first test of the predictions from Chun et al. (Reference Chun, Koch, Rani, Ahluwalia and Collins2005) for flows with a well-defined inertial range. In the limit of small
 $St$
, (3.3) is able to capture the decrease in both
 ${\it\tau}_{{\it\eta}}^{2}\langle \unicode[STIX]{x1D61A}^{2}\rangle ^{p}$
and
 ${\it\tau}_{{\it\eta}}^{2}\langle \unicode[STIX]{x1D619}^{2}\rangle ^{p}$
with increasing
 $St$
, and also the decrease in these quantities with increasing
 $R_{{\it\lambda}}$
. It is uncertain whether the quantitative differences between the DNS data and the model are due to shortcomings of the model or the fact that the smallest inertial particles (
 $St=0.05$
) are too large for the model (which assumes
 $St\ll 1$
) to hold.
An important implication of these results is that the degree of preferential sampling (and thus indirectly, the amount of clustering) of inertial particles can be predicted using experimental or DNS data measured along fluid particle trajectories. Such data are generally more widely available at even higher Reynolds numbers than those simulated here and could provide an indication of the trends in preferential sampling at such conditions.
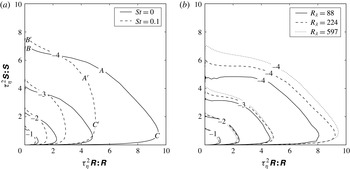
Despite the success of the model of Chun et al. (Reference Chun, Koch, Rani, Ahluwalia and Collins2005) in reproducing the trends in the DNS, the physical explanation for the changes in the mean strain and rotation rates remains unclear. In figure 3(a), we plot joint probability density functions (PDFs) of the strain and rotation rates sampled by both
 $St=0$
and
 $St=0.1$
particles to better understand the specific topological features of the regions of the flow contributing to these changes. Following the designations given in Soria et al. (Reference Soria, Sondergaard, Cantwell, Chong and Perry1994), we refer to regions with high strain and high rotation (indicated by ‘
 $A$
’ in figure 3
a) as ‘vortex sheets’, regions of low rotation and high strain (indicated by ‘
 $B$
’) as ‘irrotational dissipation’ areas, and regions of high rotation and low strain (indicated by ‘
 $C$
’) as ‘vortex tubes.’
(a) Joint PDFs of
 ${\it\tau}_{{\it\eta}}^{2}\unicode[STIX]{x1D64E}\boldsymbol{ : }\unicode[STIX]{x1D64E}$
and
 ${\it\tau}_{{\it\eta}}^{2}\unicode[STIX]{x1D64D}\boldsymbol{ : }\unicode[STIX]{x1D64D}$
for
 $R_{{\it\lambda}}=597$
for
 $St=0$
and
 $St=0.1$
particles. Certain regions of the flow are labelled to aid in the discussion of the trends. (b) Joint PDFs of
 ${\it\tau}_{{\it\eta}}^{2}\unicode[STIX]{x1D64E}\boldsymbol{ : }\unicode[STIX]{x1D64E}$
and
 ${\it\tau}_{{\it\eta}}^{2}\unicode[STIX]{x1D64D}\boldsymbol{ : }\unicode[STIX]{x1D64D}$
for different
 $R_{{\it\lambda}}$
for
 $St=0$
particles. In both plots, the exponents of the decade are indicated on the contour lines.

We see that the inertial particle PDFs differ from those of fluid particles in three primary ways. First, inertial particles are less likely to occupy vortex sheets (
 $A$
) and are more likely to occupy regions of moderate rotation and moderate strain (
 $A^{\prime }$
). This undersampling of vortex sheets has only recently been discussed in the literature (Salazar & Collins Reference Salazar and Collins2012a
). Second, inertial particles are more likely to be found in irrotational dissipation regions, where they preferentially sample regions of higher strain (e.g. compare
 $B$
and
 $B^{\prime }$
). Third, inertial particles are less likely to be found in vortex tubes (
 $C$
) and more likely to be found in regions of lower rotation and higher strain (
 $C^{\prime }$
). Evidently, this first trend is primarily responsible for the decrease in
 ${\it\tau}_{{\it\eta}}^{2}\langle \unicode[STIX]{x1D61A}^{2}\rangle ^{p}$
at small
 $St$
, as suggested in Salazar & Collins (Reference Salazar and Collins2012a
), and the first and third trends both contribute to the decrease in
 ${\it\tau}_{{\it\eta}}^{2}\langle \unicode[STIX]{x1D619}^{2}\rangle ^{p}$
. We will revisit these three trends in relation to the particle kinetic energies (§ 3.2) and the particle accelerations (§ 3.3).
Figure 3(b) shows the PDF map for fluid particles at three values of the Reynolds number. Notice that as
 $R_{{\it\lambda}}$
increases, the probability of encountering a vortex sheet (overlapping high strain and high rotation) increases. This finding is consistent with the results of Yeung et al. (Reference Yeung, Donzis and Sreenivasan2012), who observed that high strain and rotation events increasingly overlap in isotropic turbulence as the Reynolds number increases. It is thus likely that with increasing Reynolds number, rotation and strain events become increasingly intense and the resulting vortex sheets become increasingly efficient at expelling particles, causing both
 ${\it\tau}_{{\it\eta}}^{2}\langle \unicode[STIX]{x1D61A}^{2}\rangle ^{p}$
and
 ${\it\tau}_{{\it\eta}}^{2}\langle \unicode[STIX]{x1D619}^{2}\rangle ^{p}$
to decrease (cf. figure 2).
Maxey (Reference Maxey1987) noted that at low
 $St$
, the compressibility of the particle field (and hence the degree of particle clustering) is directly related to the difference between the rates of strain and rotation sampled by the particles,
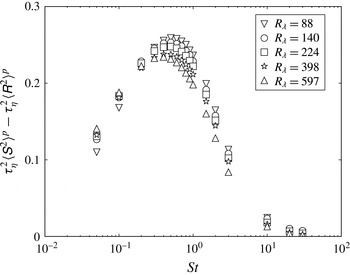
 ${\it\tau}_{{\it\eta}}^{2}\langle \unicode[STIX]{x1D61A}^{2}\rangle ^{p}-{\it\tau}_{{\it\eta}}^{2}\langle \unicode[STIX]{x1D619}^{2}\rangle ^{p}$
. From figure 4, we see that at low
 $St$
,
 ${\it\tau}_{{\it\eta}}^{2}\langle \unicode[STIX]{x1D61A}^{2}\rangle ^{p}-{\it\tau}_{{\it\eta}}^{2}\langle \unicode[STIX]{x1D619}^{2}\rangle ^{p}$
increases with increasing
 $R_{{\it\lambda}}$
, suggesting that the degree of clustering may also increase here. We will test this hypothesis in § 4.2 when we directly measure particle clustering at different values of
 $St$
and
 $R_{{\it\lambda}}$
.
The difference between the mean rates of strain and rotation sampled by the particles as a function of
 $St$
for different values of
 $R_{{\it\lambda}}$
.

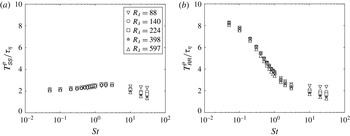
We finally consider the Lagrangian strain and rotation time scales, which will be useful for understanding the trends in particle clustering in § 4.2. Since the fluid and particle phases are isotropic, we will have nine statistically equivalent strain time scales:
 $T_{\unicode[STIX]{x1D61A}_{11}\unicode[STIX]{x1D61A}_{11}}^{p}$
,
 $T_{\unicode[STIX]{x1D61A}_{11}\unicode[STIX]{x1D61A}_{22}}^{p}$
,
 $T_{\unicode[STIX]{x1D61A}_{11}\unicode[STIX]{x1D61A}_{33}}^{p}$
,
 $T_{\unicode[STIX]{x1D61A}_{12}\unicode[STIX]{x1D61A}_{12}}^{p}$
,
 $T_{\unicode[STIX]{x1D61A}_{13}\unicode[STIX]{x1D61A}_{13}}^{p}$
,
 $T_{\unicode[STIX]{x1D61A}_{22}\unicode[STIX]{x1D61A}_{22}}^{p}$
,
 $T_{\unicode[STIX]{x1D61A}_{22}\unicode[STIX]{x1D61A}_{33}}^{p}$
,
 $T_{\unicode[STIX]{x1D61A}_{23}\unicode[STIX]{x1D61A}_{23}}^{p}$
and
 $T_{\unicode[STIX]{x1D61A}_{33}\unicode[STIX]{x1D61A}_{33}}^{p}$
. We take the strain time scale
 $T_{\unicode[STIX]{x1D61A}\unicode[STIX]{x1D61A}}^{p}$
to be the average of these nine components. We similarly take the rotation time scale
 $T_{\unicode[STIX]{x1D619}\unicode[STIX]{x1D619}}^{p}$
to be the average of three statistically equivalent components:
 $T_{\unicode[STIX]{x1D619}_{12}\unicode[STIX]{x1D619}_{12}}^{p}$
,
 $T_{\unicode[STIX]{x1D619}_{13}\unicode[STIX]{x1D619}_{13}}^{p}$
and
 $T_{\unicode[STIX]{x1D619}_{23}\unicode[STIX]{x1D619}_{23}}^{p}$
.
Lagrangian time scales of a single component of the strain rate (a) and rotation rate (b) tensors, plotted as a function of
 $St$
for different values of
 $R_{{\it\lambda}}$
.

We see that
 $T_{\unicode[STIX]{x1D61A}\unicode[STIX]{x1D61A}}^{p}/{\it\tau}_{{\it\eta}}$
is independent of
 $R_{{\it\lambda}}$
for
 $St<10$
, and decreases weakly with increasing
 $R_{{\it\lambda}}$
for
 $St\geqslant 10$
. On the other hand,
 $T_{\unicode[STIX]{x1D619}\unicode[STIX]{x1D619}}^{p}/{\it\tau}_{{\it\eta}}$
tends to decrease with increasing
 $R_{{\it\lambda}}$
for all values of
 $St$
, and this decrease becomes more pronounced as
 $St$
increases. We also see that
 $T_{\unicode[STIX]{x1D619}\unicode[STIX]{x1D619}}^{p}$
is much more sensitive to changes in
 $St$
than
 $T_{\unicode[STIX]{x1D61A}\unicode[STIX]{x1D61A}}^{p}$
, suggesting that the dominant effect of inertia is to cause particles to spend less time in strongly rotating regions. As a result, the particles will generally have less time to respond to fluctuations in the rotation rate, causing
 $\langle \unicode[STIX]{x1D619}^{2}\rangle ^{p}$
to be strongly reduced with increasing
 $St$
, as was seen above.
3.2 Particle kinetic energy
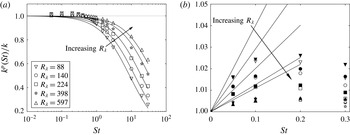
We now move from small-scale velocity statistics to large-scale velocity statistics. Figure 6 shows the average particle kinetic energy
 $k^{p}(St)\equiv \langle \boldsymbol{v}^{p}(t)\boldsymbol{\cdot }\boldsymbol{v}^{p}(t)\rangle /2$
(normalized by the average fluid kinetic energy
 $k$
) for different values of
 $R_{{\it\lambda}}$
.
(a) The ratio between the average particle kinetic energy
 $k^{p}(St)$
and the average fluid kinetic energy
 $k$
for different values of
 $R_{{\it\lambda}}$
. DNS data are shown with symbols and the predictions of the filtering model in (3.6) are shown with solid lines. (b) The ratio between
 $k^{p}(St)$
and
 $k$
(open symbols) and the ratio between the average fluid kinetic energy at the particle locations
 $k^{fp}(St)$
and
 $k$
(filled symbols), shown at low
 $St$
to highlight the effects of preferential sampling. Also shown is the prediction from the preferential sampling model given in (3.3) (solid lines).

We first consider the effect of inertial filtering on this statistic and then examine the effect of preferential sampling. It is well known that filtering leads to a reduction in the particle turbulent kinetic energy for large values of
 $St$
. This reduction is the strongest for the lowest Reynolds numbers and the weakest for the highest Reynolds numbers, as seen in figure 6(a). These trends are captured by the model in Abrahamson (Reference Abrahamson1975), which assumes an exponential decorrelation of the Lagrangian fluid velocity. Under this assumption, the ratio between the particle and fluid kinetic energies can be expressed as
 $$\begin{eqnarray}\frac{k^{p}(St)}{k}\approx \frac{1}{1+{\it\tau}_{p}/{\it\tau}_{\ell }}=\frac{1}{1+St({\it\tau}_{{\it\eta}}/{\it\tau}_{\ell })},\end{eqnarray}$$
where
 ${\it\tau}_{\ell }$
is the Lagrangian correlation time of the fluid, which we approximate using the relation given in Zaichik, Simonin & Alipchenkov (Reference Zaichik, Simonin and Alipchenkov2003). The model predictions of
 $k^{p}(St)/k$
are included in figure 6(a) and are in good agreement with the DNS at large
 $St$
, where filtering is dominant. The trends with
 $R_{{\it\lambda}}$
are also reproduced well.
We thus have the following physical explanation of inertial filtering on the particle kinetic energies: for low-Reynolds-number flows, the response time of the largest particles exceeds the time scales of many large-scale flow features. The result is a filtered response to the large-scale turbulence and an overall reduction in the particle kinetic energy. As the Reynolds number is increased (and the particle response time is fixed with respect to the small-scale turbulence), more flow features are present with time scales that exceed the particle response time, and hence the effect of inertial filtering is diminished with increasing
 $R_{{\it\lambda}}$
, as predicted by (3.6).
To highlight the effect of preferential sampling on the particle kinetic energy, figure 6(b) shows both the average particle kinetic energy
 $k^{p}(St)$
and the average kinetic energy of the fluid sampled along an inertial particle trajectory,
 $k^{fp}(St)\equiv \langle \boldsymbol{u}(\boldsymbol{x}^{p}(t),t)\boldsymbol{\cdot }\boldsymbol{u}(\boldsymbol{x}^{p}(t),t)\rangle /2$
. As is evident in figure 6(b), the particle kinetic energy exceeds
 $k$
for low values of
 $St$
. By comparing
 $k^{p}$
to
 $k^{fp}$
, we see that the increased kinetic energy of the smallest particles is due almost entirely to preferential sampling of the flow field. While Salazar & Collins (Reference Salazar and Collins2012b
) were the first to show an increase in
 $k^{p}(St)/k$
for low
 $St$
(which they attributed to preferential sampling), this trend is also suggested by the early study of Squires & Eaton (Reference Squires and Eaton1991), in which the authors observed that small inertial particles preferentially sample certain high kinetic energy regions they referred to as ‘streaming zones.’ Figure 6(b) also shows that at small values of
 $St$
,
 $k^{p}(St)/k$
decreases with increasing Reynolds number.
The solid lines in figure 6(b) show the predictions of the particle kinetic energy from (3.3). In the limit of small
 $St$
, the model of Chun et al. (Reference Chun, Koch, Rani, Ahluwalia and Collins2005) is able to capture qualitatively both the increase in
 $k^{p}(St)/k$
with increasing
 $St$
and the decrease in
 $k^{p}(St)/k$
with increasing
 $R_{{\it\lambda}}$
.
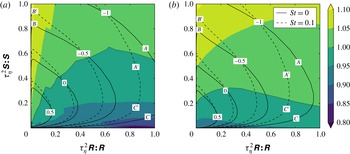
To further elucidate the physical mechanisms leading to these trends, we plot the mean kinetic energy of the fluid conditioned on
 $\unicode[STIX]{x1D61A}^{2}$
and
 $\unicode[STIX]{x1D619}^{2}$
,
 $k_{\unicode[STIX]{x1D61A}^{2},\unicode[STIX]{x1D619}^{2}}$
, in figure 7. Isocontours of the concentrations of
 $St=0$
and
 $St=0.1$
particles are shown for comparison. (To reduce the statistical noise in the conditional averages and to focus on the regions where most particles are present, we consider a narrower range of
 $\unicode[STIX]{x1D61A}^{2}$
and
 $\unicode[STIX]{x1D619}^{2}$
than in figure 3. The trends discussed below, however, are still evident when we consider the same range of
 $\unicode[STIX]{x1D61A}^{2}$
and
 $\unicode[STIX]{x1D619}^{2}$
as before.) While the data contain considerable statistical noise, we can draw a few conclusions about the qualitative trends.
Filled contours of the fluid kinetic energy conditioned on
 $\unicode[STIX]{x1D61A}^{2}$
and
 $\unicode[STIX]{x1D619}^{2}$
,
 $k_{\unicode[STIX]{x1D61A}^{2},\unicode[STIX]{x1D619}^{2}}$
, normalized by the unconditioned mean fluid kinetic energy
 $k$
at (a) the lowest Reynolds number and (b) the highest Reynolds number. The dotted contour lines indicate
 $k_{\unicode[STIX]{x1D61A}^{2},\unicode[STIX]{x1D619}^{2}}/k=1$
. Isocontours of particle concentration for
 $St=0$
and
 $St=0.1$
particles are included for reference, with the exponents of the decade indicated on the contour lines. Certain regions of the flow are labelled to aid in the discussion of the trends.

From figure 7(a), we see that the change in kinetic energy at
 $R_{{\it\lambda}}=88$
can be divided into the three mechanisms discussed in § 3.1. First, particles are less likely to sample vortex sheets (
 $A$
) and are more likely to sample moderate rotation and moderate strain regions (
 $A^{\prime }$
). This behaviour generally tends to decrease the particle kinetic energy. Second, as
 $St$
increases, particles preferentially sample regions of higher strain (
 $B^{\prime }$
), which are characterized by higher kinetic energy. Third, some inertial particles are less likely to occupy vortex tubes (
 $C$
), which are characterized by lower kinetic energies, and are more likely to occupy lower rotation and higher strain regions (
 $C^{\prime }$
), which have higher kinetic energies. The observed increase in
 $k^{p}(St)/k$
must therefore be due to the second and third trends.
At high Reynolds numbers, however, overlapping high rotation/high strain regions of the flow occur with a higher probability (as shown in § 3.1), and inertial particles tend to avoid these regions. The first trend (which tends to decrease the kinetic energy) therefore plays a larger role. Also, at
 $R_{{\it\lambda}}=597$
, high rotation and low strain regions (e.g. see region
 $C$
in figure 7
b) are no longer associated with very low kinetic energies, causing the third trend to be less effective at increasing the particle kinetic energy. The overall result is a decrease in
 $k^{p}(St)/k$
with increasing Reynolds number at small values of
 $St$
.
3.3 Particle accelerations
In this section, we analyse fluid and inertial particle accelerations
 $\boldsymbol{a}^{p}(t)\equiv \text{d}\boldsymbol{v}^{p}(t)/\text{d}t$
. Fluid particle accelerations are known to be strongly intermittent (e.g. see Voth et al.
Reference Voth, La Porta, Crawford, Alexander and Bodenschatz2002; Ishihara et al.
Reference Ishihara, Kaneda, Yokokawa, Itakura and Uno2007), with the probability of intense acceleration events increasing with the Reynolds number. Before accounting for inertial effects, we consider the effect of
 $R_{{\it\lambda}}$
on the acceleration variance
 $\langle a^{2}\rangle ^{p}\equiv \langle \boldsymbol{a}^{p}(t)\boldsymbol{\cdot }\boldsymbol{a}^{p}(t)\rangle /3$
of Lagrangian fluid particles in figure 8(a). To facilitate comparison between the different Reynolds numbers, we have normalized
 $\langle a^{2}\rangle ^{p}$
by the Kolmogorov acceleration variance
 $a_{{\it\eta}}^{2}\equiv \sqrt{{\it\epsilon}^{3}/{\it\nu}}$
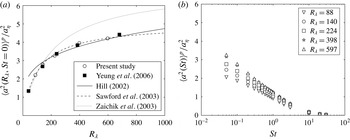
. The DNS data from Yeung et al. (Reference Yeung, Pope, Lamorgese and Donzis2006) and the theoretical predictions of Hill (Reference Hill2002), Sawford et al. (Reference Sawford, Yeung, Borgas, La Porta, Crawford and Bodenschatz2003) and Zaichik et al. (Reference Zaichik, Simonin and Alipchenkov2003) are shown for comparison. We see that our DNS data agrees well with Yeung et al. (Reference Yeung, Pope, Lamorgese and Donzis2006), and that the model of Sawford et al. (Reference Sawford, Yeung, Borgas, La Porta, Crawford and Bodenschatz2003) best reproduces the trends in the DNS. Hill (Reference Hill2002) breaks down at low
 $R_{{\it\lambda}}$
while Zaichik et al. (Reference Zaichik, Simonin and Alipchenkov2003) fails at high
 $R_{{\it\lambda}}$
.
(a) The acceleration variance of Lagrangian fluid particles as a function of
 $R_{{\it\lambda}}$
. The results from the present study (open circles) are compared to DNS data from Yeung et al. (Reference Yeung, Pope, Lamorgese and Donzis2006) (filled squares) and several theoretical predictions (lines). (b) The acceleration variance of inertial particles as a function of
 $St$
for different values of
 $R_{{\it\lambda}}$
.

We turn our attention to inertial particle accelerations in figure 8(b). The observed trend for inertial particles is analogous to that for fluid particles: at each value of
 $St$
considered, the particle acceleration variance (normalized by Kolmogorov units) monotonically increases with
 $R_{{\it\lambda}}$
(cf. Bec et al.
Reference Bec, Biferale, Boffetta, Celani, Cencini, Lanotte, Musacchio and Toschi2006a
). As
 $St$
increases, the acceleration variance decreases, presumably as a result of both preferential sampling of the flow field and inertial filtering.
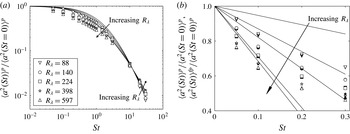
We now seek to understand and model how inertia changes the accelerations of particles through the filtering and preferential sampling effects. To do so, we rescale the inertial particle acceleration variance by that of fluid particles and plot the results in figure 9. In figure 9(a), we compare the rescaled acceleration variance to the model of Zaichik & Alipchenkov (Reference Zaichik and Alipchenkov2008), which only accounts for inertial filtering of the underlying flow. The model of Zaichik & Alipchenkov (Reference Zaichik and Alipchenkov2008) is able to capture all the qualitative trends in
 $R_{{\it\lambda}}$
and
 $St$
, and the model predictions provide remarkably good quantitative agreement with the DNS at the largest values of
 $St$
, where filtering is the dominant mechanism. At lower values of
 $St$
, the rescaled particle acceleration variance decreases with increasing
 $R_{{\it\lambda}}$
. In this case, as
 $R_{{\it\lambda}}$
increases, the underlying flow is subjected to increasingly intermittent acceleration events, and the inertial particles filter a larger fraction of these events. At the largest values of
 $St$
, most intermittent accelerations are filtered, and a particle’s acceleration variance is determined by its interaction with the largest turbulence scales. Since the range of available large scales increases with
 $R_{{\it\lambda}}$
, the rescaled particle acceleration variance increases with
 $R_{{\it\lambda}}$
for the largest values of
 $St$
.
(a) Inertial particle acceleration variances scaled by the fluid particle acceleration variance (open symbols). The solid lines and arrows indicate the predictions from the filtering model of Zaichik & Alipchenkov (Reference Zaichik and Alipchenkov2008). (b) The variance of the inertial particle accelerations (open symbols) and the fluid accelerations sampled at the inertial particle positions (filled symbols), shown at low
 $St$
to highlight the effect of preferential sampling. The solid lines indicate the predictions from the preferential sampling model given in (3.3).

We now consider the effect of preferential sampling on the acceleration variances. To do so, we also compute the acceleration of the fluid sampled by inertial particles, defined as
 $$\begin{eqnarray}\boldsymbol{a}^{fp}(t)\equiv \frac{\partial \boldsymbol{u}(\boldsymbol{x}^{p}(t),t)}{\partial t}+\boldsymbol{u}(\boldsymbol{x}^{p}(t),t)\boldsymbol{\cdot }\boldsymbol{{\rm\nabla}}\boldsymbol{u}(\boldsymbol{x}^{p}(t),t).\end{eqnarray}$$
The variance of
 $\boldsymbol{a}^{fp}$
is denoted as
 $\langle a^{2}\rangle ^{fp}\equiv \langle \boldsymbol{a}^{fp}(t)\boldsymbol{\cdot }\boldsymbol{a}^{fp}(t)\rangle /3$
. In figure 9(b), we plot both
 $\langle a^{2}\rangle ^{p}$
and
 $\langle a^{2}\rangle ^{fp}$
(scaled by the acceleration variance of
 $St=0$
particles). As expected, for
 $St\ll 1$
, where preferential sampling is the dominant mechanism, inertial particle accelerations are almost equivalent to the accelerations of the underlying flow sampled at inertial particle positions. The model of Chun et al. (Reference Chun, Koch, Rani, Ahluwalia and Collins2005) (equation (3.3) above) is able to reproduce all the qualitative trends correctly in the limit of small
 $St$
. The scaled variances decrease with increasing
 $R_{{\it\lambda}}$
, and we expect that this trend is due to the fact that high vorticity regions are associated with high accelerations (Biferale et al.
Reference Biferale, Boffetta, Celani, Lanotte and Toschi2005) and become increasingly efficient at ejecting particles (refer to § 3.1).
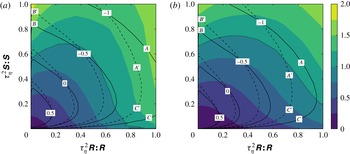
We test this expectation in figure 10 by plotting the acceleration variance for fluid particles conditioned on
 $\unicode[STIX]{x1D61A}^{2}$
and
 $\unicode[STIX]{x1D619}^{2}$
,
 $\langle a^{2}\rangle _{\unicode[STIX]{x1D61A}^{2},\unicode[STIX]{x1D619}^{2}}^{p}$
, and normalized by the unconditioned variance
 $\langle a^{2}\rangle ^{p}$
. We see that inertial particles do indeed undersample high vorticity regions (both vortex sheets and vortex tubes) and preferentially sample lower vorticity regions (e.g. compare
 $A$
and
 $A^{\prime }$
and
 $C$
and
 $C^{\prime }$
) and that these high vorticity regions are marked by very large accelerations. Though some inertial particles experience higher accelerations as they preferentially sample irrotational straining regions with higher strain rates (e.g. compare
 $B$
and
 $B^{\prime }$
), this effect is relatively weak and the overall trend is a decrease in the particle accelerations with increasing inertia.
Filled contours of the variance of the fluid particle accelerations conditioned on
 $\unicode[STIX]{x1D61A}^{2}$
and
 $\unicode[STIX]{x1D619}^{2}$
,
 $\langle a^{2}\rangle _{\unicode[STIX]{x1D61A}^{2},\unicode[STIX]{x1D619}^{2}}^{p}$
, normalized by the unconditioned fluid particle acceleration variance
 $\langle a^{2}\rangle ^{p}$
, at (a)
 $R_{{\it\lambda}}=88$
and (b)
 $R_{{\it\lambda}}=597$
. The dotted contour lines indicate
 $\langle a^{2}\rangle _{\unicode[STIX]{x1D61A}^{2},\unicode[STIX]{x1D619}^{2}}^{p}/\langle a^{2}\rangle ^{p}=1$
. Isocontours of particle concentration for
 $St=0$
and
 $St=0.1$
particles are included for reference, with the exponents of the decade indicated on the contour lines. Certain regions of the flow are labelled to aid in the discussion of the trends.

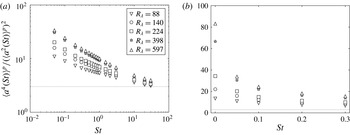
To investigate the intermittency of inertial particle accelerations, we plot the kurtosis of the particle accelerations,
 $\langle a^{4}\rangle ^{p}/(\langle a^{2}\rangle ^{p})^{2}$
, in figure 11, where
 $\langle a^{4}\rangle ^{p}\equiv \langle a_{1}^{p}(t)^{4}+a_{2}^{p}(t)^{4}+a_{3}^{p}(t)^{4}\rangle ^{p}/3$
. (Note that a Gaussian distribution has a kurtosis of 3, as indicated in figure 11 by a dotted line.) As expected, the particle accelerations are highly intermittent, with the degree of intermittency increasing with increasing
 $R_{{\it\lambda}}$
. We note that this trend in the kurtosis with
 $R_{{\it\lambda}}$
seems to be entirely due to the fluid flow intermittency. In fact, when we divide the acceleration kurtosis values of inertial particles by those of fluid particles (not shown), we observe the opposite trend with
 $R_{{\it\lambda}}$
, suggesting that inertial particles are affected less by intermittent events than fluid particles are. This is consistent with our explanations for trends in the particle acceleration variances given above, as well as with Bec et al. (Reference Bec, Biferale, Cencini, Lanotte and Toschi2006c
), who found that inertial particles undersample the most highly intermittent turbulent events in the fluid.
The kurtosis decreases very rapidly as
 $St$
increases. Figure 11(b) indicates that the kurtosis of very small particles (
 $St=0.05$
) at the highest value of
 $R_{{\it\lambda}}$
is over a factor of two smaller than that of fluid particles. The largest-
 $St$
particles have kurtosis values approaching those of a Gaussian distribution. These trends can be explained by the fact that both preferential sampling and inertial filtering decrease the probability of high-intensity acceleration events. Standardized moments of up to order
 $10$
(not shown) were also analysed and found to exhibit the same trends.
Particle acceleration kurtosis as a function of
 $St$
for different values of
 $R_{{\it\lambda}}$
. The dotted line indicates a kurtosis of 3, the value for a Gaussian distribution. Values over the whole range of non-zero
 $St$
are shown in (a). (b) Shows only small-
 $St$
results on a linear plot to emphasize the rapid reduction in kurtosis as
 $St$
increases from 0.

We should note that the grid resolution study in Yeung et al. (Reference Yeung, Pope, Lamorgese and Donzis2006) suggests that the acceleration moments from our DNS may be underpredicted. Yeung et al. (Reference Yeung, Pope, Lamorgese and Donzis2006) showed that at
 $R_{{\it\lambda}}\approx 140$
, increasing the grid resolution
 $k_{\mathit{max}}{\it\eta}$
from 1.5 to 12 led to a 10 % increase in the fluid acceleration variance and a 30 % increase in the fluid acceleration kurtosis. It is unclear how these trends will change at higher
 $R_{{\it\lambda}}$
, but it suggests that the quantitative results reported here should be interpreted with caution. (The velocity gradients presented earlier are likely reliable, however, since Yeung et al. (Reference Yeung, Pope, Lamorgese and Donzis2006) found that such statistics are less dependent on the grid resolution.)
4 Two-particle statistics
We now consider two-particle statistics relevant for predicting inertial particle collisions. We analyse particle relative velocities in § 4.1, clustering in § 4.2 and use these data to compute the collision kernel in § 4.3. (The mean-squared separation of inertial particle pairs was also studied from these data and is the topic of a separate publication (Bragg, Ireland & Collins Reference Bragg, Ireland and Collins2016).)
4.1 Particle relative velocities
We study particle relative velocities as a function of both
 $St$
and
 $R_{{\it\lambda}}$
. The relative velocities for inertial particles are defined by the relation
 $$\begin{eqnarray}w_{\Vert ,\bot }^{p}(t)\equiv [\boldsymbol{v}_{2}^{p}(t)-\boldsymbol{v}_{1}^{p}(t)]\boldsymbol{\cdot }\boldsymbol{e}_{\Vert ,\bot }^{p}(t).\end{eqnarray}$$
Here,
 $\boldsymbol{v}_{1}^{p}$
and
 $\boldsymbol{v}_{2}^{p}$
indicate the velocities of particles 1 and 2, respectively, which are separated from each other by a distance
 $r^{p}(t)=|\boldsymbol{r}^{p}(t)|$
. The subscripts
 $\Vert$
and
 $\bot$
indicate directions parallel (longitudinal) to the separation vector or perpendicular (transverse) to the separation vector, respectively, and
 $\boldsymbol{e}_{\Vert ,\bot }^{p}$
denotes the unit vector in the corresponding direction. (We use the method discussed in Pan & Padoan (Reference Pan and Padoan2013) to compute the transverse components. Pan & Padoan (Reference Pan and Padoan2013) set up a local coordinate system for each particle pair, and choose one unit vector of the coordinate system to align with the separation vector between the particles. They then apply two successive rotations to this unit vector to define two transverse unit vectors, which are used to compute two statistically equivalent transverse relative velocity components.)
We will also examine the velocity differences of the fluid at the particle locations, defined as
 $$\begin{eqnarray}{\rm\Delta}u_{\Vert ,\bot }^{p}(t)\equiv [\boldsymbol{u}_{2}^{p}(t)-\boldsymbol{u}_{1}^{p}(t)]\boldsymbol{\cdot }\boldsymbol{e}_{\Vert ,\bot }^{p}(t),\end{eqnarray}$$
where
 $\boldsymbol{u}_{1}^{p}$
and
 $\boldsymbol{u}_{2}^{p}$
are the velocities of the fluid underlying particles 1 and 2, respectively. Note that for uniformly distributed fluid (
 $St=0$
) particles, the particle velocity statistics are equivalent to the underlying fluid velocity statistics.
Following the nomenclature in Bragg & Collins (Reference Bragg and Collins2014a
,Reference Bragg and Collins
b
), we denote particle relative velocity moments of order
 $n$
as
 $$\begin{eqnarray}S_{n\Vert }^{p}(r)\equiv \langle [w_{\Vert }^{p}(t)]^{n}\rangle _{r},\end{eqnarray}$$
for the components parallel to the separation vector, and as
 $$\begin{eqnarray}S_{n\bot }^{p}(r)\equiv \langle [w_{\bot }^{p}(t)]^{n}\rangle _{r},\end{eqnarray}$$
for components perpendicular to the separation vector. In these expressions
 $\langle \cdot \rangle _{r}$
denotes an ensemble average conditioned on
 $r^{p}(t)=r$
.
For the purposes of computing the collision kernel (see § 4.3), we are also interested in the mean inward relative velocity parallel to the separation vector, defined as
 $$\begin{eqnarray}S_{-\Vert }^{p}(r)\equiv -\int _{-\infty }^{0}w_{\Vert }p(w_{\Vert }|r)\,\text{d}w_{\Vert },\end{eqnarray}$$
where
 $p(w_{\Vert }|r)=\langle {\it\delta}(w_{\Vert }^{p}(t)-w_{\Vert })\rangle _{r}$
is the PDF for the longitudinal particle relative velocity conditioned on
 $r^{p}(t)=r$
.
Finally, in some cases we are also interested in moments of the fluid velocity differences. We use a superscript
 $fp$
to denote the moments of fluid velocity differences at the particle locations, and a superscript
 $f$
to denote the moments of fluid velocity differences at fixed points with separation
 $r$
. We therefore have
 $$\begin{eqnarray}S_{n\Vert }^{fp}(r)\equiv \langle [{\rm\Delta}u_{\Vert }(r^{p}(t),t)]^{n}\rangle _{r},\end{eqnarray}$$
and
 $$\begin{eqnarray}S_{n\Vert }^{f}(r)\equiv \langle [{\rm\Delta}u_{\Vert }(r,t)]^{n}\rangle .\end{eqnarray}$$
The components perpendicular to the separation vector are defined analogously.
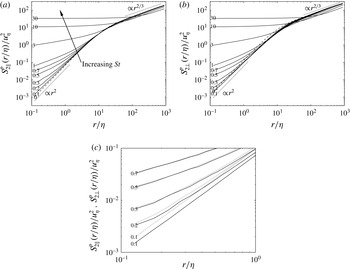
In figure 12, we plot the relative velocity variances
 $S_{2\Vert }^{p}$
and
 $S_{2\bot }^{p}$
versus
 $r/{\it\eta}$
at
 $R_{{\it\lambda}}=597$
. The mean inward relative velocity (not shown) has the same qualitative trends and will be considered later in this section. For the purposes of the following discussion, we define the dissipation range as the region over which the fluid velocity variances follow
 $r^{2}$
-scaling, which is seen to be
 $0\leqslant r/{\it\eta}\lesssim 10$
in figure 12, in agreement with Ishihara et al. (Reference Ishihara, Gotoh and Kaneda2009).
The particle relative velocity variances parallel to the separation vector (a) and perpendicular to the separation vector (b), plotted as a function of the separation
 $r/{\it\eta}$
for
 $R_{{\it\lambda}}=597$
. The Stokes numbers are indicated by the line labels, and the
 $St=0$
curves are shown with dashed lines for clarity. The expected dissipation and inertial range scalings (based on Kolmogorov Reference Kolmogorov1941) are included for reference. In (c), we have included parallel and perpendicular relative velocities at small
 $St$
and small separations to highlight the behaviour in this regime.
 $S_{2\Vert }^{p}$
values are plotted with solid lines, and
 $S_{2\bot }^{p}$
values with dotted lines. The Stokes numbers are indicated by the line labels.

At small separations, the relative velocity variances parallel to the separation vector (figure 12
a) increase monotonically with
 $St$
and deviate from
 $r^{2}$
-scaling, while the relative velocity variances perpendicular to the separation vector decrease for
 $St\lesssim 0.1$
and then increase monotonically with
 $St$
for
 $St\gtrsim 0.1$
(figure 12
b). We expect that the trends at small separations and small
 $St$
are primarily due to preferential sampling of the underlying flow, which also dictates much of the single-particle dynamics for small
 $St$
(refer to § 3).
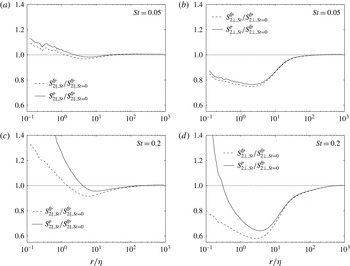
To test this expectation, we compare the particle relative velocity variances to those of the fluid sampled by the particles in figure 13. In all cases, the velocity variances are normalized by those of
 $St=0$
particles. At
 $St=0.05$
(figure 13
a,b), the effect of preferential sampling is dominant at all separations, as evidenced by the fact that
 $S_{2\Vert }^{fp}$
and
 $S_{2\bot }^{fp}$
are close to
 $S_{2\Vert }^{p}$
and
 $S_{2\bot }^{p}$
, respectively. We note that for small
 $St$
and small
 $r/{\it\eta}$
, preferential sampling leads to an increase in
 $S_{2\Vert }^{fp}$
with increasing
 $St$
and to a decrease in
 $S_{2\bot }^{fp}$
with increasing
 $St$
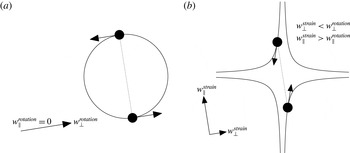
. This is consistent with the trends observed in figure 12 and with our argument (§ 3.1) that inertia causes particles to be ejected from high rotation regions of the flow. We expect that two particles in a high rotation region will experience small relative velocities parallel to the particle separation vector and large relative velocities perpendicular to the particle separation vector, as suggested by figure 14(a). We also expect that the parallel relative velocities will increase as particles accumulate in straining regions of the flow as a result of their inertia, while the perpendicular relative velocities will decrease, as shown in figure 14(b). Interestingly, we observe an opposite trend in the parallel relative velocities at
 $r/{\it\eta}\sim 10$
. We notice that
 $S_{2\Vert ,St}^{p}/S_{2\Vert ,St=0}^{fp}$
is slightly below 1, indicating that inertial particles have smaller parallel relative velocities than fluid particles. While the reason for this trend is unclear, since
 $S_{2\Vert ,St}^{p}/S_{2\Vert ,St=0}^{fp}$
and
 $S_{2\Vert ,St}^{fp}/S_{2\Vert ,St=0}^{fp}$
are approximately equal here, it must be related in some way to preferential sampling effects. At the largest separations, the relative velocities for inertial and fluid particles become equivalent, as expected, indicating that preferential sampling effects vanish in this limit.
The parallel (a,c) and perpendicular (b,d) relative velocity variances of inertial particles (
 $S_{2\Vert }^{p}$
and
 $S_{2\bot }^{p}$
, solid lines) and of the fluid at inertial particle positions (
 $S_{2\Vert }^{fp}$
and
 $S_{2\bot }^{fp}$
, dashed lines) for
 $R_{{\it\lambda}}=597$
. All quantities are normalized by the relative velocity variances of
 $St=0$
particles.
 $St=0.05$
results are shown in (a,b), and
 $St=0.2$
results are shown in (c,d).

For
 $St=0.2$
, the particle relative velocities are much larger than the underlying fluid velocity differences at small separations, as is evident in figure 13(c,d). This difference is due to path-history effects (see Bragg & Collins Reference Bragg and Collins2014a
,Reference Bragg and Collins
b
). That is, as inertial particles approach each other, they retain a memory of more energetic turbulence scales along their path histories, leading to relative velocities that exceed the local fluid velocity difference. These path-history effects imply that inertial particles can come together from different regions in the flow, occupy the same position in the flow at the same time and yet have different velocities due to their differing path histories. This effect is referred to as ‘caustics’, ‘crossing trajectories’ or ‘the sling effect’, causes a departure from
 $r^{2}$
-scaling in the second-order structure functions at small separations and can lead to large relative velocities (Yudine Reference Yudine1959; Falkovich et al.
Reference Falkovich, Fouxon and Stepanov2002; Wilkinson & Mehlig Reference Wilkinson and Mehlig2005; Wilkinson et al.
Reference Wilkinson, Mehlig and Bezuglyy2006; Falkovich & Pumir Reference Falkovich and Pumir2007). (Also note that while caustics are instantaneous events, the statistical manifestation of caustics is known as ‘random, uncorrelated motion’ and is discussed in IJzermans, Meneguz & Reeks (Reference IJzermans, Meneguz and Reeks2010).) Since the time scale over which the particles retain a memory of their interactions with turbulence increases with increasing inertia, caustics become more prevalent as
 $St$
increases.
An illustration of the effect of preferential sampling on the parallel relative velocity
 $w_{\Vert }$
and the perpendicular relative velocity
 $w_{\bot }$
. In (a), two particles are in a rotating region of the flow. In this case,
 $w_{\Vert }$
is small and
 $w_{\bot }$
is large. In (b), the particles have been ejected from the rotating region as a result of their inertia and are in a straining region of flow. The two particles have a small value of
 $w_{\bot }$
and a large value of
 $w_{\Vert }$
.

One effect of caustics is to make the parallel and perpendicular relative velocity components nearly the same in the dissipation range, as can be seen in figure 12(c) for
 $St\gtrsim 0.3$
. (Note that fluid particles do not experience caustics and have
 $2S_{2\Vert }^{p}=S_{2\bot }^{p}$
for
 $r/{\it\eta}\ll 1$
as a result of continuity (e.g. see Pope Reference Pope2000).) For
 $St\geqslant 10$
, the relative velocities are almost unaffected by the underlying turbulence in the dissipation range. As a result, the relative velocities are nearly independent of
 $r/{\it\eta}$
in this range.
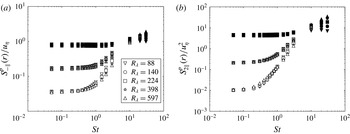
The effect of caustics can also be clearly seen in figure 15, where we plot the parallel relative velocities at a given separation as a function of
 $St$
. From this figure, it is evident that the particle relative velocities at the smallest separation sharply increase as
 $St$
exceeds approximately 0.2. The rapid increase in the particle relative velocities with
 $St$
is consistent with the notion that caustics take an activated form (Wilkinson et al.
Reference Wilkinson, Mehlig and Bezuglyy2006) and that they are negligible below a critical value of
 $St$
(IJzermans et al.
Reference IJzermans, Meneguz and Reeks2010; Salazar & Collins Reference Salazar and Collins2012b
). Our data suggest a critical Stokes number for caustics of approximately 0.2–0.3, in agreement with Falkovich & Pumir (Reference Falkovich and Pumir2007) and Salazar & Collins (Reference Salazar and Collins2012b
). The increase in the relative velocities occurs at higher values of
 $St$
as the separation increases. In this case, the particles are subjected to larger-scale turbulence, and hence the particles must have more inertia for their motion to deviate significantly from that of the underlying flow.
(a) The mean inward relative velocities and (b) the relative velocity variances, plotted as a function of
 $St$
for small separations and different values of
 $R_{{\it\lambda}}$
. Open symbols denote
 $r=0.25{\it\eta}$
, grey filled symbols denote
 $r=1.75{\it\eta}$
and black filled symbols denote
 $r=9.75{\it\eta}$
.

We now examine the Reynolds-number dependence of the relative velocities, restricting our attention to the component parallel to the separation vector. From figure 15, we see that the relative velocities of the largest particles (
 $St\gtrsim 10$
) increase strongly with increasing
 $R_{{\it\lambda}}$
. There are two reasons for this trend. The first is that the effect of filtering on the larger turbulence scales decreases as
 $R_{{\it\lambda}}$
is increased (see § 3.2). The second is that
 $u^{\prime }/u_{{\it\eta}}$
increases with increasing
 $R_{{\it\lambda}}$
, indicating that large-
 $St$
particles in the dissipation range carry a memory of increasingly energetic turbulence (relative to the Kolmogorov scales) in their path history as
 $R_{{\it\lambda}}$
is increased.
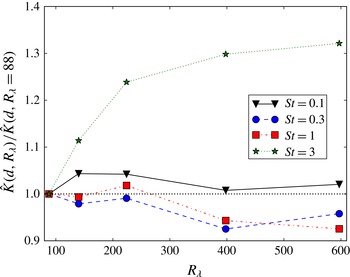
For smaller values of
 $St$
(
 $St\leqslant 3$
), the relative velocities in figure 15 are only weakly dependent on
 $R_{{\it\lambda}}$
, in agreement with previous DNS studies (Wang et al.
Reference Wang, Wexler and Zhou2000; Bec et al.
Reference Bec, Biferale, Cencini, Lanotte and Toschi2010a
; Onishi, Takahashi & Vassilicos Reference Onishi, Takahashi and Vassilicos2013; Rosa et al.
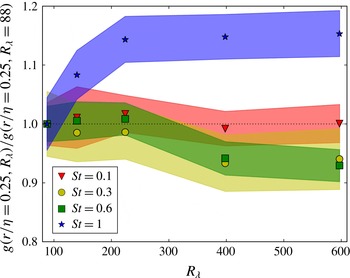
Reference Rosa, Parishani, Ayala, Grabowski and Wang2013; Onishi & Vassilicos Reference Onishi and Vassilicos2014) and the model of Pan & Padoan (Reference Pan and Padoan2010). To highlight any small Reynolds-number effects in this range, we therefore divide the relative velocities at
 $r=0.25{\it\eta}$
and a certain
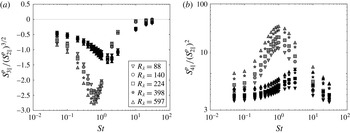
 $R_{{\it\lambda}}$
by their value at
 $R_{{\it\lambda}}=88$
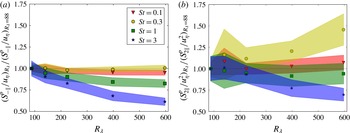
and plot the results in figure 16. We have included 95 % confidence intervals about the predicted values to provide an indication of the statistical significance of these weak Reynolds-number effects.
(a) The mean inward relative velocities and (b) the relative velocity variances, plotted as function of
 $R_{{\it\lambda}}$
. The relative velocities are shown at
 $r/{\it\eta}=0.25$
, and the quantities at a given Reynolds number are divided by their corresponding value at
 $R_{{\it\lambda}}=88$
. Shaded contours denote 95 % confidence intervals about the sample mean.

For
 $St=0.3$
, the relative velocity variances increase weakly with increasing
 $R_{{\it\lambda}}$
(see figure 16
b). As
 $R_{{\it\lambda}}$
increases, the range of velocity scales
 $u^{\prime }/u_{{\it\eta}}$
increases, allowing some particle pairs in this Stokes-number range to sample more energetic turbulence as they converge to small separations, and causing the relative velocity variances to increase with increasing Reynolds number. Furthermore, turbulence intermittency, which also increases with increasing Reynolds number, may also contribute to the trend in the relative velocity statistics. We note that the mean inward velocities (figure 16
a) are less affected by changes in Reynolds number, presumably because the mean inward velocity is a lower-order statistic that is less influenced by the relatively rare events described above.
For
 $St=3$
, we also expect the increased scale separation, the increased intermittency of the turbulence or both to act to increase the relative velocities. However, we observe an overall decrease in the relative velocities with increasing
 $R_{{\it\lambda}}$
here, in agreement with Bec et al. (Reference Bec, Biferale, Cencini, Lanotte and Toschi2010a
), Rosa et al. (Reference Rosa, Parishani, Ayala, Grabowski and Wang2013). These reduced relative velocities are likely linked to the decrease in the Lagrangian rotation time scales
 $T_{\unicode[STIX]{x1D619}\unicode[STIX]{x1D619}}^{p}/{\it\tau}_{{\it\eta}}$
with increasing
 $R_{{\it\lambda}}$
observed in § 3.1. That is, as
 $T_{\unicode[STIX]{x1D619}\unicode[STIX]{x1D619}}^{p}/{\it\tau}_{{\it\eta}}$
decreases with increasing
 $R_{{\it\lambda}}$
, the particles have a shorter memory of fluid velocity differences along their path histories, which in turn causes the relative velocities to decrease.
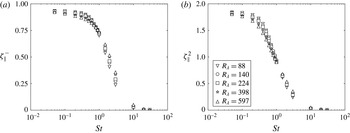
We now examine the behaviour of the scaling exponents of
 $S_{-\Vert }^{p}\propto r^{{\it\zeta}_{\Vert }^{-}}$
and
 $S_{2\Vert }^{p}\propto r^{{\it\zeta}_{\Vert }^{2}}$
at small separations. (These scaling exponents will also be used in § 4.2 to understand and predict the trends in the particle clustering.) We compute
 ${\it\zeta}_{\Vert }^{-}$
and
 ${\it\zeta}_{\Vert }^{2}$
using a linear least-squares regression for
 $0.75\leqslant r/{\it\eta}\leqslant 2.75$
at different values of
 $St$
and
 $R_{{\it\lambda}}$
. Note that while using such a large range of
 $r/{\it\eta}$
will necessarily introduce finite-separation effects, there is generally too much noise in the data to accurately compute the scaling exponents over smaller separations.
The scaling exponents are plotted in figure 17. We note that the scaling exponents are below those predicted by Kolmogorov (Reference Kolmogorov1941) (hereafter ‘K41’) for fluid (
 $St=0$
) particles (
 ${\it\zeta}_{\Vert }^{-}=1$
and
 ${\it\zeta}_{\Vert }^{2}=2$
) and, like the relative velocities themselves, vary only slightly as
 $R_{{\it\lambda}}$
changes.
Dissipation range scaling exponents for
 $S_{-\Vert }^{p}$
(a) and
 $S_{2\Vert }^{p}$
(b) for various values of
 $St$
and
 $R_{{\it\lambda}}$
. The exponents are computed from linear least-squares regression for
 $0.75\leqslant r/{\it\eta}\leqslant 2.75$
.

For
 $St\geqslant 10$
, the scaling exponents are approximately zero, indicating that the relative velocities are generally independent of
 $r$
, as explained above. The scaling exponents for
 $1\lesssim St\lesssim 3$
generally increase with increasing
 $R_{{\it\lambda}}$
, since path-history interactions (which generally decrease the scaling exponents) become less important, as explained above. Finally, we note that
 ${\it\zeta}_{\Vert }^{2}$
decreases with increasing
 $R_{{\it\lambda}}$
for
 $St\lesssim 1$
, since intermittent path-history effects are expected to be more important here.
We next consider the PDFs of the relative velocities in the dissipation range. Figure 18 shows the PDFs for
 $0\leqslant r/{\it\eta}\leqslant 2$
and
 $R_{{\it\lambda}}=597$
. In figure 18(a), we see that as
 $St$
increases, the tails of the PDF of
 $w_{\Vert }^{p}/u_{{\it\eta}}$
become more pronounced, indicating that larger relative velocities become more frequent, in agreement with our observations above.
PDFs of the particle relative velocities
 $w_{\Vert }^{p}$
for separations
 $0\leqslant r/{\it\eta}\leqslant 2$
and
 $R_{{\it\lambda}}=597$
. The relative velocities are normalized by both
 $u_{{\it\eta}}$
(a) and
 $(S_{2\Vert }^{p})^{1/2}$
(b). The solid lines denote the relative velocity PDFs for
 $St=0$
particles, and the dotted line in (b) indicates a standard normal distribution.

We show PDFs in standardized form in figure 18(b) to analyse the extent to which they deviate from that of a Gaussian distribution. It is evident that the degree of non-Gaussianity peaks for
 $St\sim 1$
and becomes smaller as
 $St$
increases. The physical explanation for this intermittency at
 $St\sim 1$
is that the motion of these particles is affected by both the small-scale underlying turbulence and by the particles’ memory of large-scale turbulent events in their path histories. This combination of contributions from both large- and small-scale events leads to strong intermittency. We also see that the underlying fluid is itself quite intermittent at this small separation, as expected (e.g. see Gotoh, Fukayama & Nakano Reference Gotoh, Fukayama and Nakano2002).
We now use three statistical measures to quantify the shape of the PDFs. The first is the ratio between the mean inward relative velocities and the standard deviation of the relative velocities,
 $S_{-\Vert }^{p}/(S_{2\Vert }^{p})^{1/2}$
; the second is the skewness of the relative velocities,
 $S_{3\Vert }^{p}/(S_{2\Vert }^{p})^{3/2}$
; and the third is the kurtosis of the relative velocities,
 $S_{4\Vert }^{p}/(S_{2\Vert }^{p})^{2}$
. (Due to insufficient statistics, we will not consider data from these latter two quantities for
 $r/{\it\eta}<1.75$
.)
We show the ratio
 $S_{-\Vert }^{p}/(S_{2\Vert }^{p})^{1/2}$
in figure 19. One motivation for looking at this ratio is that existing theories (e.g. see Zaichik et al.
Reference Zaichik, Simonin and Alipchenkov2003; Pan & Padoan Reference Pan and Padoan2010) only predict the relative velocity variance, and by assuming the relative velocities have a Gaussian distribution, relate this variance to the mean inward relative velocity. For a Gaussian distribution, this ratio is approximately 0.4. At all values of
 $St$
,
 $R_{{\it\lambda}}$
and
 $r/{\it\eta}$
, our data indicate that the ratio is below 0.4 and thus that the particle relative velocities are intermittent (see also Wang et al.
Reference Wang, Wexler and Zhou2000; Pan & Padoan Reference Pan and Padoan2013). The degree of intermittency peaks for order unity
 $St$
, high
 $R_{{\it\lambda}}$
and small
 $r/{\it\eta}$
, and using a Gaussian prediction in this regime would lead to predictions of the mean inward velocity which are in error by more than a factor of 2.
The ratio between mean inward relative velocities and the standard deviation of the relative velocities as a function of
 $St$
for small separations and different values of
 $R_{{\it\lambda}}$
. Open symbols denote
 $r=0.25{\it\eta}$
, grey filled symbols denote
 $r=1.75{\it\eta}$
, and black filled symbols denote
 $r=9.75{\it\eta}$
. The horizontal dotted line indicates that value of this quantity for a Gaussian distribution.

We next consider the skewness,
 $S_{3\Vert }^{p}/(S_{2\Vert }^{p})^{3/2}$
, to provide information about the asymmetry of the relative velocities. Figure 20(a) indicates that the relative velocities are negatively skewed (Wang et al.
Reference Wang, Wexler and Zhou2000; Ray & Collins Reference Ray and Collins2011). This skewness is a result of two contributions. First, the velocity derivatives of the underlying turbulence are negatively skewed, a consequence of the energy cascade (Tavoularis, Bennett & Corrsin Reference Tavoularis, Bennett and Corrsin1978). Second, additional skewness arises from the path-history effect described earlier (see also Bragg & Collins Reference Bragg and Collins2014b
). Figure 20(a) shows by implication that at
 $St\sim 1$
it is the latter effect that dominates the skewness behaviour. At even larger values of
 $St$
, the effect of both mechanisms decreases because, with increasing Stokes number, the particle velocity dynamics becomes increasingly decoupled from the small-scale fluid velocity field and their motion becomes increasingly ballistic in the dissipation range.
The (a) skewness and (b) kurtosis of the relative velocities as a function of
 $St$
for separations in the dissipation range and different values of
 $R_{{\it\lambda}}$
. Grey filled symbols denote
 $r=1.75{\it\eta}$
, and black filled symbols denote
 $r=9.75{\it\eta}$
.

Finally, we consider the kurtosis of the relative velocities,
 $S_{4\Vert }^{p}/(S_{2\Vert }^{p})^{2}$
, in figure 20(b) to quantify the contributions from intermittent events in the tails of the PDFs. The trends are similar to those in
 $S_{-\Vert }^{p}/(S_{2\Vert }^{p})^{1/2}$
, as expected, indicating that contributions from intermittent events become strongest for intermediate
 $St$
, the smallest separations and the highest Reynolds numbers. In all cases, the kurtosis is above that for a Gaussian distribution (
 $S_{4\Vert }^{p}/(S_{2\Vert }^{p})^{2}=3$
).
Finally we close this section with two comments. We first note that the recent study by Saw et al. (Reference Saw, Bewley, Bodenschatz, Ray and Bec2014) that compares experimentally measured relative velocities of inertial particles with DNS found that while the Stokes drag model is able to capture all of the qualitative trends observed in the experiments, it is unable to provide quantitative predictions for the tails of the relative velocity PDFs, suggesting that some of the neglected terms in the Maxey & Riley (Reference Maxey and Riley1983) particle equation of motion may be required to yield quantitatively correct higher-order relative velocity statistics.
The second comment is related to the inertial range structure functions. It is a common practice to report the power-law exponents of higher-order velocity structure functions for fluid particles (e.g. see Kerr, Meneguzzi & Gotoh Reference Kerr, Meneguzzi and Gotoh2001; Gotoh et al.
Reference Gotoh, Fukayama and Nakano2002; Shen & Warhaft Reference Shen and Warhaft2002; Ishihara et al.
Reference Ishihara, Gotoh and Kaneda2009). Salazar & Collins (Reference Salazar and Collins2012b
) reported the corresponding exponents for inertial particles. However, as shown by Bragg, Ireland & Collins (Reference Bragg, Ireland and Collins2015), in a turbulent flow with infinite Reynolds number, and
 $r/{\it\eta}\gg St^{3/2}$
, the inertial particle structure functions reduce to those of fluid particles. Yet for those same particles in the range
 $1\ll r/{\it\eta}\ll St^{3/2}$
, inertial effects cause systematic deviations between inertial particle and fluid particle structure functions. The existence of two scaling regions for inertial particles in high-Reynolds-number turbulence implies that no single exponent can capture the entire inertial range. Thus, the results reported in Salazar & Collins (Reference Salazar and Collins2012b
) are most likely an artefact of the relatively low Reynolds number of the study (
 $R_{{\it\lambda}}\leqslant 120$
).
4.2 Particle clustering
As discussed in § 1, inertial particles form clusters when placed in a turbulent flow. We first consider a theoretical framework for understanding this clustering (§ 4.2.1), and then analyse the clustering using DNS (§ 4.2.2).
4.2.1 Theoretical framework for particle clustering
A variety of measures have been proposed to study particle clustering, including Voronoï diagrams (Monchaux et al. Reference Monchaux, Bourgoin and Cartellier2010), Lyapunov exponents (Bec et al. Reference Bec, Biferale, Boffetta, Cencini, Musacchio and Toschi2006b ), Minkowski functionals (Calzavarini et al. Reference Calzavarini, Kerscher, Lohse and Toschi2008) and radial distribution functions (RDFs) (McQuarrie Reference McQuarrie1976). These methods provide insight into particle clustering in a variety of different ways. As pointed out by a referee, Minkowski functionals and Voronoï diagrams provide information about nearest-neighbour particles, while Lyanunov exponents are capable of providing information about the entire small-scale distribution of particles. The RDF has distinct advantages over these other methods for our purposes. The RDF, unlike both Minkowski functionals (Calzavarini et al. Reference Calzavarini, Kerscher, Lohse and Toschi2008) and Voronoï diagrams (Tagawa et al. Reference Tagawa, Mercado, Prakash, Calzavarini, Sun and Lohse2012), is not biased by the number of particles simulated. Also, as Bec et al. (Reference Bec, Biferale, Boffetta, Cencini, Musacchio and Toschi2006b ) noted, the accurate computation of Lyapunov exponents is numerically infeasible for high-Reynolds-number simulations, while computation of the RDF is relatively straightforward. Finally, the RDF, unlike the other measures, has a direct relevance to particle collisions, since it precisely corrects the collision kernel for particle clustering (Sundaram & Collins Reference Sundaram and Collins1997) in the limit of vanishing particle concentration. Since our simulations are performed with very dilute particle seedings, we neglect higher-order corrections to the collision kernel that result from particle collision histories and triple correlations.
The RDF
 $g(r)$
is defined as the ratio of the number of particle pairs at a given separation
 $r$
to the expected number of particle pairs in a uniformly distributed particle field,
 $$\begin{eqnarray}g(r)\equiv \frac{N_{i}/V_{i}}{N/V}.\end{eqnarray}$$
Here,
 $N_{i}$
is the number of particle pairs that lie within a shell with an average radius
 $r$
and a radial width
 ${\rm\Delta}r$
,
 $V_{i}$
is the volume of the shell and
 $N$
is the total number of particle pairs located in the total volume
 $V$
. An RDF of unity corresponds to uniformly distributed particles, while an RDF in excess of one indicates a clustered particle field.
Based on the findings of Bragg & Collins (Reference Bragg and Collins2014a
), we use the model of Zaichik & Alipchenkov (Reference Zaichik and Alipchenkov2009) as a framework for understanding the physical mechanisms governing particle clustering. We will validate this model against DNS data in § 4.2.2. In the following discussion, we non-dimensionalize all variables by Kolmogorov units and use
 ${\hat{Y}}$
to denote the non-dimensionalized form of a variable
 $Y$
.
From Zaichik & Alipchenkov (Reference Zaichik and Alipchenkov2009), the equation describing
 $g(\hat{r})$
at steady state for an isotropic system is
 $$\begin{eqnarray}0=-St({\hat{S}}_{2\Vert }^{p}+\hat{{\it\lambda}}_{\Vert })\boldsymbol{{\rm\nabla}}_{\hat{r}}g-Stg(\boldsymbol{{\rm\nabla}}_{\hat{r}}{\hat{S}}_{2\Vert }^{p}+2\hat{r}^{-1}[{\hat{S}}_{2\Vert }^{p}-{\hat{S}}_{2\bot }^{p}]),\end{eqnarray}$$
where
 $\hat{{\it\lambda}}_{\Vert }$
is a diffusion coefficient describing the effect of the turbulence on the dispersion of the particle pairs (e.g. see Bragg & Collins Reference Bragg and Collins2014a
). We now consider (4.9) in different
 $St$
-regimes to consider the effect of changes in
 $R_{{\it\lambda}}$
within these regimes.
In the limit
 $St\ll 1$
, (4.9) can be reduced to (see Bragg & Collins Reference Bragg and Collins2014a
),
 $$\begin{eqnarray}0=-\hat{r}^{2}B_{nl}\boldsymbol{{\rm\nabla}}_{\hat{r}}g-\frac{St}{3}\hat{r}g(\langle \hat{\unicode[STIX]{x1D61A}}^{2}\rangle ^{p}-\langle \hat{\unicode[STIX]{x1D619}}^{2}\rangle ^{p}),\end{eqnarray}$$
where
 $B_{nl}$
is a
 $St$
-independent, non-local diffusion coefficient (see Chun et al.
Reference Chun, Koch, Rani, Ahluwalia and Collins2005; Bragg & Collins Reference Bragg and Collins2014a
). The first term on the right-hand side is associated with an outward particle diffusion which reduces clustering, while the second term on the right-hand side is responsible for an inward particle drift which increases clustering.
We therefore see that if
 $B_{nl}$
is independent of
 $R_{{\it\lambda}}$
, the diffusion will be independent of
 $R_{{\it\lambda}}$
. The drift is dependent on
 ${\it\tau}_{{\it\eta}}^{2}\langle \unicode[STIX]{x1D61A}^{2}\rangle ^{p}-{\it\tau}_{{\it\eta}}^{2}\langle \unicode[STIX]{x1D619}^{2}\rangle ^{p}$
, and we see from § 3.1 that
 ${\it\tau}_{{\it\eta}}^{2}\langle \unicode[STIX]{x1D61A}^{2}\rangle ^{p}-{\it\tau}_{{\it\eta}}^{2}\langle \unicode[STIX]{x1D619}^{2}\rangle ^{p}$
increases weakly with
 $R_{{\it\lambda}}$
for
 $St\ll 1$
. We therefore expect the degree of clustering at low
 $St$
to increase weakly as
 $R_{{\it\lambda}}$
increases. We will test this expectation against DNS data in § 4.2.2.
For particles with intermediate values of
 $St$
, we are generally unable to simplify (4.9), since all terms are of comparable magnitude, and the clustering in this range is due to both preferential sampling and path-history effects. Bragg & Collins (Reference Bragg and Collins2014a
) showed that path-history effects induce an asymmetry in the particle inward and outward motions, causing particles to come together more rapidly than they separate, generating a net inward drift and increased clustering. The precise range of
 $St$
over which path-history effects increase clustering will likely vary with
 $R_{{\it\lambda}}$
, but a rough guideline (based on Bragg & Collins Reference Bragg and Collins2014a
) is
 $0.2\lesssim St\lesssim 0.7$
. Below this range, path-history effects have a negligible impact on particle clustering, and above this range, the path-history mechanism acts to diminish clustering. For the upper end of this
 $St$
range, path-history effects are the dominant particle clustering mechanism (Bragg & Collins Reference Bragg and Collins2014a
).
We next simplify (4.9) when
 $St\gtrsim 1$
. As noted in § 4.1, at sufficiently large
 $St$
and small
 $r/{\it\eta}$
, the relative particle velocities are dominated by path-history effects and
 $S_{2\Vert }^{p}\approx S_{2\bot }^{p}$
. Furthermore,
 ${\it\lambda}_{\Vert }\ll S_{2\Vert }^{p}$
in this regime (see Bragg & Collins Reference Bragg and Collins2014b
). Using these results we can simplify (4.9) in the dissipation range to the form,
 $$\begin{eqnarray}0\approx -St{\hat{S}}_{2\Vert }^{p}\boldsymbol{{\rm\nabla}}_{\hat{r}}g-Stg\boldsymbol{{\rm\nabla}}_{\hat{r}}{\hat{S}}_{2\Vert }^{p}.\end{eqnarray}$$
The overall changes in the particle clustering at high
 $St$
will therefore be determined by the extent to which the drift coefficient (
 $\boldsymbol{{\rm\nabla}}_{\hat{r}}{\hat{S}}_{2\Vert }^{p}$
) and the diffusion coefficient (
 ${\hat{S}}_{2\Vert }^{p}$
) are influenced by changes in
 $R_{{\it\lambda}}$
. That is, if the ratio between the drift and diffusion coefficients increases (decreases) with increasing
 $R_{{\it\lambda}}$
, the RDFs are expected to increase (decrease).
We therefore take the ratio between the drift and diffusion coefficients in the dissipation range and obtain
 $$\begin{eqnarray}\frac{\boldsymbol{{\rm\nabla}}_{\hat{r}}{\hat{S}}_{2\Vert }^{p}}{{\hat{S}}_{2\Vert }^{p}}=\frac{{\it\zeta}_{\Vert }^{2}}{\hat{r}},\end{eqnarray}$$
where
 ${\it\zeta}_{\Vert }^{2}$
is the scaling exponent of the longitudinal relative velocity variance. Equation (4.12) implies that increases (decreases) in
 ${\it\zeta}_{\Vert }^{2}$
are fundamentally linked to increases (decreases) in the RDFs at high
 $St$
. From § 4.1, we see that
 ${\it\zeta}_{\Vert }^{2}$
increases with increasing
 $R_{{\it\lambda}}$
for
 $1\lesssim St\lesssim 3$
, which suggests that
 $g(r/{\it\eta})$
will increase with increasing
 $R_{{\it\lambda}}$
here.
We also note that (4.12) can only be used to predict the trends in clustering for particles with finite
 ${\it\zeta}_{\Vert }^{2}$
. Particles with sufficiently large
 $St$
have
 ${\it\zeta}_{\Vert }^{2}=0$
, and for such particles the effect of
 $R_{{\it\lambda}}$
on the RDFs in the dissipation range is controlled exclusively by the boundary condition for
 $g$
at the edge of the dissipation range. This boundary condition depends upon the inertial range clustering of particles and cannot be inferred from the behaviour of
 ${\it\zeta}_{\Vert }^{2}$
. We will examine the RDFs for
 $St>3$
from DNS data in § 4.2.2.
In summary, at small
 $St$
, clustering may increase with increasing
 $R_{{\it\lambda}}$
depending upon whether
 $B_{nl}$
varies with
 $R_{{\it\lambda}}$
. Clustering at intermediate values of
 $St$
will be due to both preferential sampling and path-history effects, though it is unclear the degree to which
 $g(r/{\it\eta})$
will change with
 $R_{{\it\lambda}}$
. At high
 $St$
, the degree of clustering is determined by the influence of path-history effects on the scaling of the relative velocity variances, which in turn affects the relative strengths of the drift and diffusion mechanisms. Based on our relative velocity data in § 4.1, we expect that clustering will increase with increasing
 $R_{{\it\lambda}}$
here. We next consider DNS data to test these predictions.
4.2.2 Particle clustering results
In figure 21, we plot the RDFs for the different values of
 $St$
considered at three different Reynolds numbers. Note that as the size of the simulation (and thus
 $R_{{\it\lambda}}$
) increases, we are able to calculate
 $g(r/{\it\eta})$
statistics accurately at progressively smaller values of
 $r/{\it\eta}$
.
RDFs for (a) low-
 $St$
particles and (b) high-
 $St$
particles at three different values of
 $R_{{\it\lambda}}$
, plotted as a function of the radial separation
 $r/{\it\eta}$
. The Stokes numbers are indicated by the line labels.

In agreement with past studies (e.g. see Wang & Maxey Reference Wang and Maxey1993; Sundaram & Collins Reference Sundaram and Collins1997; Balachandar & Eaton Reference Balachandar and Eaton2010), we see that particle clustering peaks for
 $St\sim 1$
at all Reynolds numbers shown. Figure 21 also indicates that the largest particles (
 $St\geqslant 10$
) exhibit clustering outside of the dissipation range of turbulence and that the degree of clustering is independent of separation in the dissipation range. This is because large-
 $St$
particles are unresponsive to the dissipative range scales and so move almost ballistically at these separations. The clustering that is observed for these particles is due almost entirely to eddies in the inertial range with time scales similar to the particle response time (Goto & Vassilicos Reference Goto and Vassilicos2006; Bec et al.
Reference Bec, Biferale, Lanotte, Scagliarini and Toschi2010b
). If we make that assumption, along with the standard K41 approximations for the inertial range, we expect the clustering will depend only on
 ${\it\epsilon}$
and
 $r$
and will occur at length scales of the order of
 ${\it\eta}St^{3/2}$
(ElMaihy & Nicolleau Reference ElMaihy and Nicolleau2005; Bec et al.
Reference Bec, Biferale, Lanotte, Scagliarini and Toschi2010b
). We test this in figure 22 by plotting the RDFs for
 $St=20$
and
 $St=30$
particles as a function of
 $r/({\it\eta}St^{3/2})$
at the three highest Reynolds numbers. (The two lower Reynolds numbers do not have a well-defined inertial range, as noted in § 2.1, and hence the above argument would not hold.) We see that the RDFs decrease rapidly near
 $r/({\it\eta}St^{3/2})\sim 1$
, suggesting that the particles are indeed clustering due to the influence of turbulent eddies in the inertial range with a time scale of the order of
 ${\it\tau}_{p}$
. Refer to Bragg et al. (Reference Bragg, Ireland and Collins2015) for a recent theoretical and computational analysis of particle clustering in the inertial range of turbulence.
RDFs for
 $St=20$
and
 $St=30$
particles at the three highest values of
 $R_{{\it\lambda}}$
. The separations are scaled by
 ${\it\eta}St^{3/2}$
to test for inertial range scaling. The Stokes numbers are indicated by the line labels.

The normalized RDFs at
 $r/{\it\eta}=0.25$
, plotted as a function of
 $R_{{\it\lambda}}$
. The RDFs at a given Reynolds number are normalized by their corresponding value at
 $R_{{\it\lambda}}=88$
to highlight any slight Reynolds-number effects. Shaded contours denote 95 % confidence intervals for the RDFs.

We now discuss how the RDFs change with the Reynolds number. For
 $St\gtrsim 1$
, the RDFs increase with increasing
 $R_{{\it\lambda}}$
, as is clearly evident in figures 21(b) and 22. This is in agreement with our expectations in § 4.2.1. At lower values of
 $St$
, however, the trends with
 $R_{{\it\lambda}}$
are at most weak and are not obvious from figure 21(a). We therefore plot the RDFs at
 $r/{\it\eta}=0.25$
as a function of
 $R_{{\it\lambda}}$
in figure 23 and normalize the RDFs at a given Reynolds number by their corresponding value at
 $R_{{\it\lambda}}=88$
. We have included 95 % confidence intervals for the RDFs to provide an indication of the statistical significance of any weak Reynolds-number effects.
In § 4.2.1, we argued that
 $g(r/{\it\eta})$
might increase weakly with
 $R_{{\it\lambda}}$
for
 $St\ll 1$
, since
 ${\it\tau}_{{\it\eta}}^{2}\langle \unicode[STIX]{x1D61A}^{2}\rangle ^{p}-{\it\tau}_{{\it\eta}}^{2}\langle \unicode[STIX]{x1D619}^{2}\rangle ^{p}$
increases with
 $R_{{\it\lambda}}$
in this limit. In figure 23, however, we observe that
 $g(r/{\it\eta})$
is essentially independent of
 $R_{{\it\lambda}}$
for
 $St<1$
, which implies that the non-local correction coefficient
 $B_{nl}$
in (4.10) must increase weakly with
 $R_{{\it\lambda}}$
in a compensating way. Several authors have also found the level of particle clustering to be independent of
 $R_{{\it\lambda}}$
at small
 $St$
(without gravity), including Collins & Keswani (Reference Collins and Keswani2004) (from data at
 $65\leqslant R_{{\it\lambda}}\leqslant 152$
), Bec et al. (Reference Bec, Biferale, Cencini, Lanotte, Musacchio and Toschi2007) (
 $65\leqslant R_{{\it\lambda}}\leqslant 185$
), Bec et al. (Reference Bec, Biferale, Cencini, Lanotte and Toschi2010a
) (
 $185\leqslant R_{{\it\lambda}}\leqslant 400$
), Ray & Collins (Reference Ray and Collins2011) (
 $95\leqslant R_{{\it\lambda}}\leqslant 227$
) and Rosa et al. (Reference Rosa, Parishani, Ayala, Grabowski and Wang2013) (
 $28\leqslant R_{{\it\lambda}}\leqslant 304$
). Our data confirms this point up to
 $R_{{\it\lambda}}=597$
. The fact that
 $g(r/{\it\eta})$
is independent of
 $R_{{\it\lambda}}$
for small Stokes numbers implies that the clustering mechanism is driven almost entirely by the small-scale turbulence, independent of any intermittency in the turbulence that occurs at higher Reynolds numbers. From figure 23, we notice that the RDFs increase weakly with
 $R_{{\it\lambda}}$
for
 $St\gtrsim 1$
, with Reynolds-number effects saturating at the higher Reynolds numbers. Our findings confirm the hypothesis of Collins & Keswani (Reference Collins and Keswani2004) that the degree of clustering saturates as the Reynolds number increases.
Power-law fits for
 $g(r/{\it\eta})$
from (4.13): (a) shows the coefficient
 $c_{0}$
, and (b) shows the exponent
 $c_{1}$
. DNS data are shown with symbols, and the theoretical predictions from Zaichik & Alipchenkov (Reference Zaichik and Alipchenkov2009) (‘ZT’ and ‘ZT
 $+$
DNS’), Chun et al. (Reference Chun, Koch, Rani, Ahluwalia and Collins2005) (‘CT1’ and ‘CT2’) and Gustavsson & Mehlig (Reference Gustavsson and Mehlig2011) (‘GT’) at
 $R_{{\it\lambda}}=597$
are shown with lines and plus signs. The details of each of the theoretical models are discussed in the text.

We note that two recent studies (Onishi et al.
Reference Onishi, Takahashi and Vassilicos2013; Onishi & Vassilicos Reference Onishi and Vassilicos2014) found that
 $g(r/{\it\eta})$
decreases weakly with increasing
 $R_{{\it\lambda}}$
over the range
 $81\leqslant R_{{\it\lambda}}\leqslant 527$
at
 $St=0.4$
and
 $St=0.6$
. Our results at
 $St=0.6$
in figure 23 are consistent with this trend, but it should be emphasized that the Reynolds-number dependencies here are extremely weak (in comparison with the statistical deviations) and should be viewed with caution.
It is important to note, however, that just because
 $g(r/{\it\eta})$
is almost entirely invariant with
 $R_{{\it\lambda}}$
for low-
 $St$
particles does not necessarily imply that higher-order moments of clustering are also independent of
 $R_{{\it\lambda}}$
. For example,
 $g(r/{\it\eta})$
is related to the variance of the particle density field (Shaw, Kostinski & Larsen Reference Shaw, Kostinski and Larsen2002). Higher-order moments or PDFs of the particle density field (e.g. see Pan et al.
Reference Pan, Padoan, Scalo, Kritsuk and Norman2011) could also be compared at different values of
 $R_{{\it\lambda}}$
. However, we found that the number of particles in our simulations was insufficient to compute such statistics accurately at small separations. We would likely need about an order of magnitude more particles to test the Reynolds-number dependence of these higher-order clustering moments. Refer to Yoshimoto & Goto (Reference Yoshimoto and Goto2007) for a more complete discussion on the number of particles necessary for accurate higher-order clustering statistics.
Following Reade & Collins (Reference Reade and Collins2000a ), we fit the RDFs by a power law of the form
 $$\begin{eqnarray}g(r/{\it\eta})\approx c_{0}\left(\frac{{\it\eta}}{r}\right)^{c_{1}}.\end{eqnarray}$$
(Note that
 $c_{1}$
is related to the correlation dimension
 $\mathscr{D}_{2}$
(Bec et al.
Reference Bec, Biferale, Cencini, Lanotte, Musacchio and Toschi2007) by the relation
 $c_{1}=3-\mathscr{D}_{2}$
.) This allows us to compare the DNS data to several theoretical predictions in figure 24. For each value of
 $R_{{\it\lambda}}$
, we computed
 $c_{0}$
and
 $c_{1}$
by fitting
 $g(r/{\it\eta})$
in the range
 $0.75\leqslant r/{\it\eta}\leqslant 2.75$
using linear least-squares regression. For
 $St\geqslant 10$
, we do not observe power-law scaling for the RDF, and thus no values of
 $c_{0}$
and
 $c_{1}$
are plotted here.
To verify the arguments presented in § 4.2.1, we compare the DNS values of
 $c_{0}$
and
 $c_{1}$
to the predicted values from Zaichik & Alipchenkov (Reference Zaichik and Alipchenkov2009) at
 $R_{{\it\lambda}}=597$
. The comparisons are performed in two ways. In the first way (which we denote as ‘ZT’), we use the model of Zaichik & Alipchenkov (Reference Zaichik and Alipchenkov2009) to compute the relative velocities and then use these predicted relative velocities in (4.9) to solve for the RDFs. In this manner, we can test the quantitative predictions of the model when no additional inputs are used. In the second approach (which we denote as ‘ZT
 $+$
DNS’), we solve (4.9) with the particle velocities and the strain rate time scales along particle trajectories specified using DNS data. (The strain rate time scales are used in evaluating the dispersion tensor
 ${\bf\lambda}$
. To maintain consistency in the model, we also adjusted the inertial range time scales through (18) in Zaichik & Alipchenkov (Reference Zaichik and Alipchenkov2003).) In both cases, we used the non-local diffusion correction discussed in Bragg & Collins (Reference Bragg and Collins2014a
), with
 $B_{nl}=0.056$
.
As expected, ‘ZT’ is only able to provide a reasonable prediction for
 $c_{0}$
and
 $c_{1}$
for
 $St\lesssim 0.3$
. Above this point, inaccuracies in the predicted relative velocities lead to inaccurate clustering predictions, as discussed in Bragg & Collins (Reference Bragg and Collins2014a
). However, ‘ZT
 $+$
DNS’ predicts
 $c_{1}$
almost perfectly, with only slight discrepancies at
 $St\sim 1$
, in agreement with the findings of Bragg & Collins (Reference Bragg and Collins2014a
) at a lower Reynolds number. We expect that these discrepancies are due to an additional drift term that was omitted in Zaichik & Alipchenkov (Reference Zaichik and Alipchenkov2009), as discussed in Bragg & Collins (Reference Bragg and Collins2014a
). ‘ZT
 $+$
DNS’ also provides reasonable predictions for
 $c_{0}$
, though the agreement is not as good as that for
 $c_{1}$
, possibly because
 $c_{0}$
is influenced by the inertial range scales, which are generally more difficult to model. From these comparisons, we see that the model presented in § 4.2.1 is accurate, validating its use in interpreting the physical mechanisms responsible for particle clustering.
We next compare our results for
 $c_{1}$
against two relations derived in Chun et al. (Reference Chun, Koch, Rani, Ahluwalia and Collins2005) in the limit of small
 $St$
. The first (which we denote as ‘CT1’) uses DNS data for the strain and rotation rates sampled along inertial particle trajectories to compute
 $c_{1}$
, giving
 $$\begin{eqnarray}c_{1}=\frac{St{\it\tau}_{{\it\eta}}^{2}}{3B_{nl}}(\langle \unicode[STIX]{x1D61A}^{2}\rangle ^{p}-\langle \unicode[STIX]{x1D619}^{2}\rangle ^{p}).\end{eqnarray}$$
The second (which we denote as ‘CT2’) requires only DNS data for quantities sampled along fluid particle trajectories and predicts,
 $$\begin{eqnarray}\displaystyle c_{1}=\frac{St^{2}}{12B_{nl}}\!\left[\frac{({\it\sigma}_{\unicode[STIX]{x1D61A}^{2}}^{p})^{2}}{(\langle \unicode[STIX]{x1D61A}^{2}\rangle ^{p})^{2}}\frac{T_{\unicode[STIX]{x1D61A}^{2}\unicode[STIX]{x1D61A}^{2}}^{p}}{{\it\tau}_{{\it\eta}}}-\!{\it\rho}_{\unicode[STIX]{x1D61A}^{2}\unicode[STIX]{x1D619}^{2}}^{p}\frac{{\it\sigma}_{\unicode[STIX]{x1D61A}^{2}}^{p}}{\langle \unicode[STIX]{x1D61A}^{2}\rangle ^{p}}\frac{{\it\sigma}_{\unicode[STIX]{x1D619}^{2}}^{p}}{\langle \unicode[STIX]{x1D619}^{2}\rangle ^{p}}\!\left(\frac{T_{\unicode[STIX]{x1D61A}^{2}\unicode[STIX]{x1D619}^{2}}^{p}}{{\it\tau}_{{\it\eta}}}+\frac{T_{\unicode[STIX]{x1D619}^{2}\unicode[STIX]{x1D61A}^{2}}^{p}}{{\it\tau}_{{\it\eta}}}\right)\!+\frac{({\it\sigma}_{\unicode[STIX]{x1D619}^{2}}^{p})^{2}}{(\langle \unicode[STIX]{x1D619}^{2}\rangle ^{p})^{2}}\frac{T_{\unicode[STIX]{x1D619}^{2}\unicode[STIX]{x1D619}^{2}}^{p}}{{\it\tau}_{{\it\eta}}}\right]\!\!.\qquad & & \displaystyle\end{eqnarray}$$
‘CT1’ agrees well with the DNS up to
 $St\approx 0.5$
, while ‘CT2’ only agrees well for
 $St=0.05$
, in agreement with Chun et al. (Reference Chun, Koch, Rani, Ahluwalia and Collins2005), Bragg & Collins (Reference Bragg and Collins2014a
). At higher values of
 $St$
, both models from Chun et al. (Reference Chun, Koch, Rani, Ahluwalia and Collins2005) overpredict
 $c_{1}$
. As explained in Bragg & Collins (Reference Bragg and Collins2014a
), this overprediction is because the theory of Chun et al. (Reference Chun, Koch, Rani, Ahluwalia and Collins2005) fails to account for the contribution of the path-history effects on the drift and diffusion mechanisms that govern the clustering.
Finally, we compare our DNS values for
 $c_{1}$
against the theory from Gustavsson & Mehlig (Reference Gustavsson and Mehlig2011), here denoted as ‘GT.’ The theory in Gustavsson & Mehlig (Reference Gustavsson and Mehlig2011) predicts that in the limit of small
 $r/{\it\eta}$
,
 $$\begin{eqnarray}S_{n\Vert }^{p}\propto r^{c_{1}},\end{eqnarray}$$
for
 $n>c_{1}$
. (Note that the predictions of Zaichik & Alipchenkov (Reference Zaichik and Alipchenkov2009) and Gustavsson & Mehlig (Reference Gustavsson and Mehlig2011) are equivalent when
 $St$
is large, as explained in Bragg & Collins (Reference Bragg and Collins2014a
).) It therefore follows that for sufficiently small
 $r/{\it\eta}$
,
 $c_{1}={\it\zeta}_{\Vert }^{2}$
, where
 ${\it\zeta}_{\Vert }^{2}$
is the scaling exponent of the relative velocity variance in the dissipation range, as computed in § 4.1.
We include the prediction
 $c_{1}={\it\zeta}_{2}^{\Vert }$
in figure 24, and see that while ‘GT’ is in excellent agreement with the DNS for
 $St=2,3$
, significant discrepancies exist at low
 $St$
, as explained in Bragg & Collins (Reference Bragg and Collins2014a
).
4.3 Collision kernel
We now consider the kinematic collision kernel
 $K$
for inertial particles, which has been shown to depend on both the radial distribution function and the radial relative velocities,
 $$\begin{eqnarray}K(d)=4{\rm\pi}d^{2}S_{-\Vert }^{p}(r=d)g(r=d),\end{eqnarray}$$
where
 $d$
is the particle diameter (see Sundaram & Collins Reference Sundaram and Collins1997; Wang, Wexler & Zhou Reference Wang, Wexler and Zhou1998). While we simulate only point particles (refer to § 2.2), we compute
 $d$
from
 $St$
by assuming a given
 ${\it\rho}_{p}/{\it\rho}_{f}$
. To study the dependence of
 $K(d)$
on
 ${\it\rho}_{p}/{\it\rho}_{f}$
, we consider three different values for this parameter: 250, 1000 and 4000. (Note that for droplets in atmospheric clouds,
 ${\it\rho}_{p}/{\it\rho}_{f}\approx 1000$
.)
In general, we do not have adequate statistics to calculate
 $g(r)$
or
 $S_{-\Vert }^{p}(r)$
at
 $r=d$
at low values of
 $St$
(
 $St\leqslant 3$
for
 ${\it\rho}_{p}/{\it\rho}_{f}=250$
and 1000 and
 $St\leqslant 10$
for
 ${\it\rho}_{p}/{\it\rho}_{f}=4000$
) and so we extrapolate from the power-law fits in §§ 4.1 and 4.2.2 down to these separations, as was also done in Rosa et al. (Reference Rosa, Parishani, Ayala, Grabowski and Wang2013). For larger
 $St$
(
 $St\geqslant 10$
for
 ${\it\rho}_{p}/{\it\rho}_{f}=250$
and 1000 and
 $St\geqslant 20$
for
 ${\it\rho}_{p}/{\it\rho}_{f}=4000$
), the particle diameters are sufficiently large such that we can compute
 $g(d)$
and
 $S_{-\Vert }^{p}(d)$
by interpolating between data at smaller and larger separations.
Following Voßkuhle et al. (Reference Voßkuhle, Pumir, Lévêque and Wilkinson2014), we compute the non-dimensional collision kernel
 $\hat{K}(d)\equiv K(d)/(d^{2}u_{{\it\eta}})=4{\rm\pi}g(d)S_{-\Vert }^{p}(d)/u_{{\it\eta}}$
. Figure 25 shows
 $\hat{K}(d)$
for different values of
 ${\it\rho}_{p}/{\it\rho}_{f}$
. Results from Rosa et al. (Reference Rosa, Parishani, Ayala, Grabowski and Wang2013) (deterministic forcing scheme, no gravity,
 ${\it\rho}_{p}/{\it\rho}_{f}=1000$
) are included in the inset to figure 25.
The non-dimensional collision kernel
 $\hat{K}(d)$
as a function of
 $St$
for different values of
 $R_{{\it\lambda}}$
. Data are shown for
 ${\it\rho}_{p}/{\it\rho}_{f}=250$
(filled black symbols),
 ${\it\rho}_{p}/{\it\rho}_{f}=1000$
(open symbols) and
 ${\it\rho}_{p}/{\it\rho}_{f}=4000$
(filled grey symbols). Legend entries marked with
 $\dagger$
indicate data taken from Rosa et al. (Reference Rosa, Parishani, Ayala, Grabowski and Wang2013) (deterministic forcing scheme, no gravity) at
 ${\it\rho}_{p}/{\it\rho}_{f}=1000$
. These data are only included in the inset, where they are compared with our results at
 ${\it\rho}_{p}/{\it\rho}_{f}=1000$
.

For
 $St\geqslant 10$
, the collision kernels increase strongly with increasing
 $R_{{\it\lambda}}$
, since both the relative velocities and the RDFs increase with
 $R_{{\it\lambda}}$
here (see §§ 4.1 and 4.2.2).
 $\hat{K}(d)$
is also independent of
 ${\it\rho}_{p}/{\it\rho}_{f}$
here. The physical explanation is that while changes in
 ${\it\rho}_{p}/{\it\rho}_{f}$
lead to changes in
 $d$
,
 $S_{-\Vert }^{p}(d)/u_{{\it\eta}}$
and
 $g(d)$
are largely independent of
 $d$
here (see §§ 4.1 and 4.2.2).
Such particles, however, are generally above the size range of droplets in atmospheric clouds (e.g. see Ayala et al.
Reference Ayala, Rosa, Wang and Grabowski2008), and thus our primary focus is on the collision rates of smaller (
 $St\lesssim 3$
) particles.
 $\hat{K}(d)$
is independent of
 ${\it\rho}_{p}/{\it\rho}_{f}$
for
 $1\lesssim St\leqslant 3$
, in agreement with the findings of Voßkuhle et al. (Reference Voßkuhle, Pumir, Lévêque and Wilkinson2014). In this case, while both
 $g(d)$
and
 $S_{-\Vert }^{p}/u_{{\it\eta}}$
are dependent on
 $d$
, these two quantities have opposite scalings (see § 4.2.2), causing their product to be independent of
 $d$
(and thus of
 ${\it\rho}_{p}/{\it\rho}_{f}$
).
For
 $St\lesssim 3$
, our data show very little effect of
 $R_{{\it\lambda}}$
on the collision rates, and are in good agreement with the collision statistics from Rosa et al. (Reference Rosa, Parishani, Ayala, Grabowski and Wang2013) at
 ${\it\rho}_{p}/{\it\rho}_{f}=1000$
(shown in the inset to figure 25). However, since the Reynolds numbers in clouds (
 $R_{{\it\lambda}}\sim 10\,000$
) are at least an order of magnitude larger than those in the DNS, it is important to discern even weak trends in the collision kernel with the Reynolds number. We therefore plot the ratio of
 $\hat{K}(d)$
at a given Reynolds number to that at
 $R_{{\it\lambda}}=88$
for
 $St\leqslant 3$
in figure 26.
The ratio between
 $\hat{K}(d)$
at a given value of
 $R_{{\it\lambda}}$
to that at
 $R_{{\it\lambda}}=88$
, to highlight any Reynolds-number effects for
 $St\leqslant 3$
. All data correspond to
 ${\it\rho}_{p}/{\it\rho}_{f}=1000$
.

For
 $St\leqslant 1$
, the collision statistics are almost completely independent of
 $R_{{\it\lambda}}$
. This Reynolds-number independence is expected at
 $St=0.1$
and
 $St=0.3$
, since both
 $S_{-\Vert }^{p}/u_{{\it\eta}}$
and
 $g$
are independent of
 $R_{{\it\lambda}}$
here (refer to §§ 4.1 and 4.2.2). For
 $St=1$
,
 $S_{-\Vert }^{p}/u_{{\it\eta}}$
decreases with increasing
 $R_{{\it\lambda}}$
(see § 4.1), while
 $g$
increases with increasing
 $R_{{\it\lambda}}$
(see § 4.2.2). These two trends apparently offset each other, causing the collision kernel to be essentially independent of Reynolds number at
 $St=1$
. Finally, for
 $St=3$
, the collision kernel increases weakly as
 $R_{{\it\lambda}}$
increases. In this case, the increase in the RDFs with increasing
 $R_{{\it\lambda}}$
(§ 4.2.2) more than compensates for the decrease in the relative velocities (§ 4.1), causing the collision kernel to increase weakly.
These findings suggest that lower-Reynolds-number studies may in fact capture the essential physics responsible for droplet collisions in highly turbulent clouds. However, the results must be interpreted with caution for two reasons. First, the collision rates for
 $St\leqslant 3$
were computed by extrapolating power-law fits to very small separations, and it is not known if the functional form of the relative velocities and the RDFs remains the same at these separations. Second, even the highest Reynolds numbers in this study are still at least an order of magnitude smaller than those in atmospheric clouds. It is thus possible that the turbulence could exhibit different characteristics at much higher Reynolds numbers, or that the above trends in the Reynolds number, though weak, could lead to substantially different collision rates when
 $R_{{\it\lambda}}$
is increased by another order of magnitude.
5 Conclusions
We have studied the effect of particle inertia and the flow Reynolds number on particle dynamics at the highest Reynolds number (
 $R_{{\it\lambda}}\approx 600$
) and largest number of particles (
 ${\sim}2.5$
billion) to date. These simulations have provided new insights into both single- and two-particle statistics in homogeneous isotropic turbulence.
We first analysed the statistics of individual inertial particles. At large
 $St$
, the particle motions were seen to be influenced primarily by inertial filtering. The theoretical models of Abrahamson (Reference Abrahamson1975) and Zaichik & Alipchenkov (Reference Zaichik and Alipchenkov2008) were able to quantify the effect of filtering on kinetic energies and particle accelerations, respectively, in this limit, and provided us with a clear physical understanding of the effect of Reynolds number on these quantities.
In the opposite limit (
 $St\ll 1$
), the particle motions were influenced primarily by preferential sampling, and we used the theoretical model of Chun et al. (Reference Chun, Koch, Rani, Ahluwalia and Collins2005) to understand and predict the statistics here. For
 $St\ll 1$
, the mean rotation rate sampled by the particles decreased with increasing
 $St$
and
 $R_{{\it\lambda}}$
, since intense rotation regions became more prevalent and more efficient at ejecting particles (see Collins & Keswani Reference Collins and Keswani2004). As
 $R_{{\it\lambda}}$
increased, intense rotation regions tended to occur together with intense strain regions in ‘vortex sheets’, in agreement with Yeung et al. (Reference Yeung, Donzis and Sreenivasan2012), and particles were also ejected from these regions, decreasing the mean strain rate sampled by the particles. In agreement with Salazar & Collins (Reference Salazar and Collins2012b
), the particle kinetic energy increased with
 $St$
for
 $St\ll 1$
due to preferential sampling of the flow field. However, since ejections from vortex sheets tend to reduce the particle kinetic energy, this trend was reduced as the Reynolds number was increased. Fluid particle accelerations were seen to be extremely intermittent at high
 $R_{{\it\lambda}}$
, and the trends in the acceleration variance were well captured by the model of Sawford et al. (Reference Sawford, Yeung, Borgas, La Porta, Crawford and Bodenschatz2003). The particle acceleration variances decreased rapidly with increasing
 $St$
, as inertial particles tended to be ejected from vortex tubes and vortex sheets, which were both characterized by very high fluid accelerations.
We then studied the relative velocity, clustering and collision statistics of inertial particles. For
 $St\ll 1$
, preferential sampling led to an increase in the longitudinal relative velocities and to a decrease in the transverse relative velocities, and the relative velocities were generally independent of
 $R_{{\it\lambda}}$
for
 $St\lesssim 0.1$
. At higher values of
 $St$
, the particle motions were influenced more by path-history interactions, leading to a sharp increase in the relative velocities with increasing
 $St$
. While the mean inward relative velocities were generally independent of
 $R_{{\it\lambda}}$
for
 $St=0.3$
, the relative velocity variances increased weakly with increasing
 $R_{{\it\lambda}}$
here, a trend we attributed to either the increased scale separation at higher Reynolds numbers, the increased intermittency of the turbulence at higher Reynolds numbers or some combination of the two. For
 $St=3$
, the relative velocities decreased with increasing
 $R_{{\it\lambda}}$
, which we argued was related to the decrease in the Lagrangian rotation time scales with increasing
 $R_{{\it\lambda}}$
. We observed that the relative velocities of particles with
 $St\gtrsim 10$
increased with increasing
 $R_{{\it\lambda}}$
, since inertial filtering effects diminish and
 $u^{\prime }/u_{{\it\eta}}$
increases as the Reynolds number increases.
We also analysed the dissipation range scaling exponents of the relative velocities, and found that particles with higher relative velocities generally had lower scaling exponents, since the particles were more influenced by path-history effects. Relative velocities in the dissipation range were seen to be strongly non-Gaussian, with the degree of non-Gaussianity being largest for
 $St\sim 1$
,
 $r/{\it\eta}\rightarrow 0$
, and high
 $R_{{\it\lambda}}$
, suggesting that theories which assume a Gaussian distribution to relate the velocity variances to the mean inward velocities provide poor predictions for the mean inward relative velocities at particle contact. Higher-order inertial range structure functions were also examined and were observed to follow similar trends to those reported in Salazar & Collins (Reference Salazar and Collins2012b
).
We then used these trends in the relative velocities to predict the degree of clustering through the model of Zaichik & Alipchenkov (Reference Zaichik and Alipchenkov2009), and compared the results to DNS data. The trends in the RDFs at low
 $St$
were tied to preferential sampling effects, which increased the inward particle drift, as was found in Chun et al. (Reference Chun, Koch, Rani, Ahluwalia and Collins2005). The RDFs were independent of
 $R_{{\it\lambda}}$
here, in agreement with Collins & Keswani (Reference Collins and Keswani2004), Ray & Collins (Reference Ray and Collins2011), Rosa et al. (Reference Rosa, Parishani, Ayala, Grabowski and Wang2013), suggesting that the non-local coefficient
 $B_{nl}$
(see Chun et al.
Reference Chun, Koch, Rani, Ahluwalia and Collins2005; Bragg & Collins Reference Bragg and Collins2014a
) must weakly increase as
 $R_{{\it\lambda}}$
increases. (We were unable to test higher-order measures of clustering to determine if they were affected by changes in
 $R_{{\it\lambda}}$
due to the limitations in the number of particles that could be simulated.)
At high
 $St$
, the degree of clustering was tied to the influence of path-history effects on the particle drift and diffusion, as explained in Bragg & Collins (Reference Bragg and Collins2014a
). By simplifying the model of Zaichik & Alipchenkov (Reference Zaichik and Alipchenkov2009) in this limit, we showed that changes in the scaling exponents of the relative velocity variances directly affected the drift and diffusion mechanisms, which in turn altered the clustering. The scaling exponents generally increased with increasing
 $R_{{\it\lambda}}$
(suggesting that path-history effects became less important), which in turn led to increased levels of clustering. For
 $St\geqslant 10$
and
 $R_{{\it\lambda}}\geqslant 224$
, particles were seen to cluster in the inertial range of turbulence and the separation at which clustering decreased was predicted accurately by inertial range scaling arguments.
For
 $St\lesssim 3$
, the RDFs exhibited power-law scaling, consistent with Reade & Collins (Reference Reade and Collins2000a
). The full model of Zaichik & Alipchenkov (Reference Zaichik and Alipchenkov2009) (without any inputs from the DNS) was able to predict the power-law coefficient
 $c_{0}$
and power-law exponent
 $c_{1}$
accurately only for
 $St\lesssim 0.4$
due to errors in the predicted relative velocities. However, when these relative velocities (and the associated Lagrangian time scales) were specified from the DNS, the model in Zaichik & Alipchenkov (Reference Zaichik and Alipchenkov2009) provided excellent predictions for
 $c_{1}$
and reasonable predictions for
 $c_{0}$
, as was also found in Bragg & Collins (Reference Bragg and Collins2014a
) at a lower Reynolds number. We also tested the DNS against two model predictions from Chun et al. (Reference Chun, Koch, Rani, Ahluwalia and Collins2005), one which required only fluid particle statistics from the DNS and one which required strain and rotation statistics along particle trajectories. The former prediction was in acceptable agreement with the DNS only for
 $St=0.05$
, while the latter prediction was in good agreement up to
 $St\approx 0.5$
, in agreement with Chun et al. (Reference Chun, Koch, Rani, Ahluwalia and Collins2005), Bragg & Collins (Reference Bragg and Collins2014a
). Finally, we found that the theory of Gustavsson & Mehlig (Reference Gustavsson and Mehlig2011) was able to predict
 $c_{1}$
well for
 $St=2$
and
 $St=3$
.
We used the relative velocity and RDF data to compute the kinematic collision kernel for inertial particles (Sundaram & Collins Reference Sundaram and Collins1997), and found that this quantity varied only slightly with Reynolds number (under 35 % when
 $R_{{\it\lambda}}$
changed by a factor of 7) for
 $0<St\leqslant 3$
. Our collision kernels were in good agreement with those computed by Rosa et al. (Reference Rosa, Parishani, Ayala, Grabowski and Wang2013).
As mentioned in § 1, one of the primary motivations for this study was to determine the extent to which turbulence-induced collisions are responsible to the rapid growth rate of droplets observed in warm, cumulus clouds. Our observations indicate that the collision rates of like particles are generally unaffected by changes in the Reynolds number, which suggests that relatively low-Reynolds-number simulations may allow us to study the essential physics of droplet collisions in highly turbulent atmospheric clouds. One promising avenue of future work would be to determine the droplet growth rates predicted by these collision kernels, either by solving an associated kinetic equation (Xue, Wang & Grabowski Reference Xue, Wang and Grabowski2008; Wang & Grabowski Reference Wang and Grabowski2009) or by simulating the particle collision and coalescence process directly (Reade & Collins Reference Reade and Collins2000b ).
Experimental data to support these findings would also be very useful. Experimental data on particle clustering, relative velocity and collision statistics is not yet available over a wide range of Reynolds number under tightly controlled experimental conditions. Future work could be undertaken to produce such data in order to test the validity of the conclusions drawn herein.
Finally, we note that it is unclear to what extent these conclusions would be altered if gravity were incorporated in the particle dynamics, since the introduction of gravity will likely cause particles to preferentially sample certain regions of the flow, and will alter the residence time of particles around certain flow features (e.g. see Wang & Maxey Reference Wang and Maxey1993; Dávila & Hunt Reference Dávila and Hunt2001; Good et al. Reference Good, Ireland, Bewley, Bodenschatz, Collins and Warhaft2014). We will analyse the effect of gravity on inertial particle motion in turbulence in Part 2 (Ireland et al. Reference Ireland, Bragg and Collins2016).
Acknowledgements
The authors gratefully acknowledge P. Sukheswalla for helpful discussions regarding this work. This work was supported by the National Science Foundation through CBET grants 0756510 and 0967349, and through a graduate research fellowship awarded to P.J.I. Additional funding was provided by Cornell University. We would also like to acknowledge high-performance computing support from Yellowstone (ark:/85065/d7wd3xhc) provided by NCAR’s Computational and Information Systems Laboratory through grants ACOR0001 and P35091057, sponsored by the National Science Foundation.