



1. Why we need to rethink visual attention
Much of vision science attempts to explain a narrow aspect of visual perception; one might study perceptual grouping, or face perception, but not attempt to understand both simultaneously. The study of visual attention provides one significant departure from this trend. Visual attention theory proposes a critical factor in vision: human vision is faced with more information than it can process at once. If correct, understanding this limited capacity and the mechanisms for dealing with it could allow us to predict performance on a wide range of visual tasks.
In particular, attention theory presumes that vision must deal with limited access to higher-level visual processing. To do so, it employs a selective attention mechanism, which in its simplest form selects one thing at a time for access, effectively serving as a gate. Selection can be covert, attending away from the point of gaze, or overt if pointing one’s eyes at the target. If attention gates access, this immediately raises several questions: At what stage does attention act? What processing requires attention, and what happens preattentively and automatically?
Researchers have developed various methods to answer these questions. In their seminal paper, Treisman and Gelade (Reference Treisman and Gelade1980) employed tasks in which an observer must search for a target among other, distractor items. If search displays overwhelm the observer with more items than they can process at once, then easy and difficult search tasks would distinguish between the discriminations possible with preattentive processing, as opposed to those that require attention, respectively. Their results formed the foundation of feature integration theory. According to this theory, selection occurs early in visual processing. Preattentively the visual system only has access to simple feature maps, allowing one to easily find a salient target defined by a unique basic feature such as orientation (θ), color, or motion (v). These features underlie bottom-up processing. On the other hand, tasks such as searching for a T among Ls, or for a target defined by a conjunction of features (white AND vertical) require selective attention (Treisman & Gelade, Reference Treisman and Gelade1980). Binding features together, perceiving details, and most object recognition tasks require selective attention. This theory appeared consistent with demonstrations of change blindness, in which observers have difficulty finding the difference between two similar images; if perceiving details requires selective attention, then detecting a difference in those details will rely on moving attention from one location to another until it happens to land on the change, a relatively slow process (Rensink, O’Regan, & Clark, Reference Rensink, O’Regan and Clark1997).
However, this attention theory has obvious issues. Most notably, observers can quickly and easily get the gist of a scene or a set of similar items (Loftus & Ginn, Reference Loftus and Ginn1984; Potter, Reference Potter1975; Rousselet, Joubert, & Fabre-Thorpe, Reference Rousselet, Joubert and Fabre-Thorpe2005; Greene & Oliva, Reference Greene and Oliva2009; Ariely, Reference Ariely2001; Chong & Treisman, Reference Chong and Treisman2003; Chong & Treisman, Reference Chong and Treisman2005; Haberman & Whitney, Reference Haberman and Whitney2009). The gist can include information such as the category or layout of a scene, the mean size of a collection of circles, or the mean emotion of a set of faces. These results appear incompatible with the idea that serial selective attention is necessary merely to combine color and shape or detect a corner. Faced with this issue, researchers proposed a mechanism that distributes or diffuses attention across an entire scene or set, allowing one to extract information about the stimulus as a whole (Treisman, Reference Treisman2006), or a separate, non-selective pathway for scene and set perception (Rensink, Reference Rensink2000; Wolfe, Vo, Evans, & Greene, Reference Wolfe, Vo, Evans and Greene2011). Other empirical results led to additional complications in the theory (Figure 1). One might distribute attention to select a feature across space, for example selecting everything red (see Maunsell & Treue, Reference Maunsell and Treue2006, for a review). One might divide attention across multiple tasks (VanRullen, Reddy, & Koch, Reference VanRullen, Reddy and Koch2004), if at the cost of reduced performance, or deploy a few spotlights of attention to track a small number of moving objects (Pylyshyn & Storm, Reference Pylyshyn and Storm1988; Alvarez & Franconeri, Reference Alvarez and Franconeri2007). Attention can be bottom-up or top-down; transient or sustained; directed voluntarily or captured involuntarily; and can modulate both the percept and neuronal firing rates (Chun, Golumb, & Turk-Browne, Reference Chun, Golumb and Turk-Browne2011). Researchers have criticized this proliferation of attentional mechanisms and uses of the word (Anderson, Reference Anderson2011; Hommel, et al., Reference Hommel, Chapman, Cisek, Neyedli, Song and Welsh2019; Zivony & Eimer, Reference Zivony and Eimer2021; Chun, Golumb, & Turk-Browne, Reference Chun, Golumb and Turk-Browne2011). However, this might merely reflect reality; visual attention might involve a sizeable set of largely separate mechanisms. As Wu (Reference Wu2023) has argued, attention can refer to a “shared functional structure” in the mind even if implemented in different ways.
A subset of the mechanisms in attention theory (boxes, and green text), along with phenomena supposedly explained by those mechanisms (blue text). See, e.g. Chun et al. (Reference Chun, Golumb and Turk-Browne2011) for a fuller account.

I argue that the science of visual attention is in crisis, and in need of a paradigm shift. In making this claim, I borrow terminology from philosopher of science Thomas Kuhn, in his seminal The Structure of Scientific Revolutions (Kuhn, Reference Kuhn1962). Kuhn says that most of the time a given scientific field operates within a dominant paradigm. A paradigm includes agreed-upon theory, methods, and puzzles to solve. Operating within this paradigm is what Kuhn calls normal science. In normal science the paradigm’s adherents productively solve its puzzles with the prescribed methods. However, at some point, normal science uncovers significant anomalies, results that one cannot easily explain using the dominant paradigm. The field enters a crisis, which persists until a new paradigm emerges, i.e., a paradigm shift occurs.
Kuhn gives as a canonical example the shift from the Ptolemaic earth-centric view of the solar system to the Copernican heliocentric view. The classic story demonstrates the difficulty of recognizing a crisis from within its midst. Observations of planetary motions, driven by the earth-centric paradigm, uncovered a number of anomalies. Mars appeared at times to move backwards! To account for these observations, scientists modified circular orbits around the earth by adding dozens of epicycles, additional circles moving on circles. For the earth-centric scientists, this was normal science; the paradigm allowed the addition of epicycles to gain better predictions. Ultimately, the paradigm shifted to heliocentrism, and this and other significant changes led to the modern view of planetary motions. (This story is oversimplified in many ways but nonetheless will serve as a useful analogy at several points in this paper. See Heliocentrism, 2023).
Kuhn describes several main signs of a crisis (Kuhn, Reference Kuhn1962): 1. Significant anomalies that must be explained; 2. Methods no longer leading to the answers promised by the paradigm; and 3. Increasing complexity of the theory, without a corresponding increase in the ability to make accurate predictions. Here I point to a few pieces of evidence for a crisis, with additional signs described in later sections and my full list enumerated in Section 3.
First, consider the increased complexity of the theory. A proliferation of attentional mechanisms, per se, does not necessarily indicate a crisis. New phenomena led to proposals of diverse types of attention – diffuse, feature-based, multiple spotlights, etc. In that sense, these additional mechanisms provide predictive value. Epicycles improved quantitative predictions. However, the added attentional mechanisms lack specificity and integration into a coherent theory, leaving many questions unanswered. What information does diffuse attention make available? Which scene tasks does it enable, and which tasks require focal attention? Do diffuse and focal attention face the same capacity limit? If focal and diffuse attention utilize different resources, then can one deploy both at the same time? If not, what is the common capacity limit? This lack of specificity and integration suggests that the theory has added additional mechanisms without a commensurate increase in predictive value.
Second, while vision science readers may have adapted to explaining easy scene and set perception in terms of diffuse attention or a separate non-selective pathway, I argue that one should think of these phenomena as anomalies. Virtually every visual attention theory added a distinct component to account for these results. The puzzle for these theories is how to add a mechanism capable of getting the gist of a scene or set, while still predicting things like difficult search and change blindness.
Intriguingly, researchers starting with fairly different theories proposed a similar-sounding solution: summary statistics. Summary statistics concisely summarize a large number of observations, for instance in terms of their mean or variance, or the correlation between two different measurements. Rensink (Reference Rensink2000) suggested that the gist of a scene might be extracted in a non-attentional pathway, based on “statistics of low-level structures such as proto-objects”. Oliva and Torralba (Reference Oliva and Torralba2001) developed a summary statistic model for scene perception based on local power spectrum computed over sizeable regions of the image. Treisman (Reference Treisman2006) suggested that the visual system might distribute attention across an entire display, making available a statistical description pooled over feature maps. Wolfe et al. (Reference Wolfe, Vo, Evans and Greene2011), like Rensink (Reference Rensink2000), suggested an additional non-selective pathway with statistical processing abilities.
Summary statistics pooled over sizable image regions provide a form of data compression. One can think of this compression as an alternative means of dealing with limited capacity, instead of serially selecting one object at a time to feed through the bottleneck (Rosenholtz, Huang, & Ehinger, Reference Rosenholtz, Huang and Ehinger2012). Selection and compression lead to different losses of information, with very different implications for task performance.
One of the most well-specified and tested proposals for a summary statistic encoding in vision came neither from studying attention nor scene perception, but rather from the study of peripheral vision, i.e. vision away from the point of gaze. The next subsection reviews the suggestion that peripheral vision encodes its inputs using a rich set of summary statistics. This proposal makes sense of some anomalies but also reveals additional signs of crisis. I will argue that one should view a summary statistic encoding as a paradigm shift, but that a crisis remains.
1.1. A summary statistic encoding in peripheral vision
A significant loss of information occurs in peripheral vision, particularly due to visual crowding. Crowding refers to phenomena in which peripheral vision degrades in the presence of clutter. In a common example, an observer views a peripheral word, in which each letter is closely flanked by others. Observers might perceive the letters in the wrong order, or a confusing jumble of shapes made up of parts from multiple letters (Lettvin, Reference Lettvin1976). Lettvin (Reference Lettvin1976) suggested that the crowded letters “only [seem] to have a ‘statistical’ existence.” Move the letters farther apart, and at some critical spacing letter identification improves (Bouma, Reference Bouma1970). Building on these observations, several researchers have suggested that crowding occurs due to the representation of peripheral information in terms of statistics summarized over sizable pooling regions (Parkes, Lund, Angelucci, Solomon, & Morgan, Reference Parkes, Lund, Angelucci, Solomon and Morgan2001; Balas, Nakano, & Rosenholtz, Reference Balas, Nakano and Rosenholtz2009; Freeman & Simoncelli, Reference Freeman and Simoncelli2011). These pooling regions grow linearly with eccentricity, overlap, and sparsely tile the visual field (Freeman & Simoncelli, Reference Freeman and Simoncelli2011; Rosenholtz, Huang, & Ehinger, Reference Rosenholtz, Huang and Ehinger2012; Chaney, Fischer, & Whitney, Reference Chaney, Fischer and Whitney2014). Based on these intuitions, my lab has developed and tested a computational model of peripheral crowding, known as the Texture Tiling Model (TTM). The model measures a rich set of summary statistics derived from the texture perception model of Portilla and Simoncelli (Reference Portilla and Simoncelli2000), with a first stage computing V1-like responses to oriented, multiscale feature detectors, and the second stage measuring a large set of primarily second-order correlations of the responses of the first stage, computed over local pooling regions (Balas et al., Reference Balas, Nakano and Rosenholtz2009; Rosenholtz, Huang, Raj, Balas, & Ilie, Reference Rosenholtz, Huang, Raj, Balas and Ilie2012; see also Freeman & Simoncelli, Reference Freeman and Simoncelli2011). Figures 2 and 4 show model outputs to provide intuitions about predictions of the model.
(A) Original image, fixation at center. (B) Two visualizations of the information available at a glance, according to our model of peripheral vision.

Example stimulus patches from three classic search conditions (top row, target specified at top). Akin to the demonstration in Figure 2, here one can use the texture analysis/synthesis model of Portilla and Simoncelli to visualize the information encoded by the model summary statistics (bottom two rows). The summary statistics capture the presence (column 1, row 2) or absence (row 3) of a uniquely tilted line. However, the information is insufficient to correctly represent the conjunction of color and orientation, producing an illusory white vertical from a target absent patch (column 2, row 3). For T among L search, no clear T appears in the target-present synthesis (column 3, row 2), whereas several appear in the target absent (row 3); this ambiguity predicts difficult search.

TTM can in fact predict performance getting the gist of a scene. Given a stimulus and a fixation, TTM generates random images with the same pooled summary statistics as the original (Figure 2). These images provide visualizations of the consequences of encoding an image in this way. Aspects of the scene that one can consistently discern in these images will be readily available when fixating the specified location. Conversely, details not consistently apparent will be less available to peripheral vision. A summary statistic encoding in peripheral vision preserves a great deal of useful information for getting the gist of a scene. In Figure 2, the encoding suffices to identify a street scene, most likely a bus stop, people waiting, cars on the road, trees, and a building in the background. Ehinger and Rosenholtz (Reference Ehinger and Rosenholtz2016) demonstrated that this encoding quantitatively predicts performance on a range of scene perception tasks. Though not yet well studied, the model also seems promising for predicting the ease with which one can get the gist of a set, relative to reporting individual items of that set (Rosenholtz, Yu, & Keshvari, Reference Rosenholtz, Yu and Keshvari2019; though see Balas, Reference Balas2016).
A summary statistic encoding in peripheral vision also provides insight into a second anomaly: that different methods for distinguishing between automatic and attention-demanding tasks have not agreed on which tasks require attention. In particular, search and dual-task results have disagreed on this classification, as have attentional capture (Folk, Remington, & Johnston, Reference Folk, Remington and Johnston1992) and inattentional blindness experiments (Mack & Clarke, Reference Mack and Clarke2012; Mack & Rock, Inattentional blindness, Reference Mack and Rock1998). VanRullen et al. (Reference VanRullen, Reddy and Koch2004) provide a particularly useful table of search vs. dual-task results (Figure 3A).
(A) Search and dual-task paradigms give different answers about what tasks do and do not require attention. Understanding peripheral vision resolves this conundrum by more parsimoniously explaining search, and (B) noting that search displays are often more crowded than dual-task displays. Tasks circled in gray (blue) are behaviorally or theoretically easy (hard) for peripheral vision in dual-task displays. Table adapted from VanRullen et al. (Reference VanRullen, Reddy and Koch2004).

Recall that in the traditional interpretation, easy or efficient search implies that observers can discriminate the target from distractors preattentively, automatically, and without selective attention (Treisman & Gelade, Reference Treisman and Gelade1980). Inefficient or difficult search, conversely, indicates that the target-distractor discrimination requires selective attention.
In dual-task experiments, an observer performs either a task in central vision, a task in the periphery, or both. Observers often perform worse when given two tasks instead of one. According to the experimental logic (VanRullen, Reddy, & Koch, Reference VanRullen, Reddy and Koch2004), easy dual tasks do not require selective attention; rather this processing happens automatically. Difficult dual tasks require attention.
Consequently, discriminations that lead to easy (hard) search tasks should also lead to easy (hard) dual tasks (upper left and lower right quadrants, Figure 3A). However, in the two remaining quadrants, the two experiments disagree on whether tasks require attention.
A summary statistic encoding in peripheral vision can make sense of these anomalous results. First, our model of visual crowding provides a more parsimonious account of critical visual search phenomena (Figure 4). Difficulty discriminating a crowded peripheral target from a distractor explains easy feature search, difficult conjunction search, and difficult search for a T among Ls (Rosenholtz, Huang, Raj, Balas, & Ilie, Reference Rosenholtz, Huang, Raj, Balas and Ilie2012); phenomena that originally led to feature integration theory. The model also predicts difficult search for a scene among scenes, and for a green-red bisected disk among red-green ones (Rosenholtz, Huang, & Ehinger, Reference Rosenholtz, Huang and Ehinger2012). In addition, it explains phenomena that defy easy explanation by feature integration theory, such as easy search for a cube among differently lit cubes compared to similar 2D conditions (Zhang, Huang, Yigit-Elliot, & Rosenholtz, Reference Zhang, Huang, Yigit-Elliot and Rosenholtz2015), and effects of subtle changes to the stimuli (Chang & Rosenholtz, Reference Chang and Rosenholtz2016). A summary statistic model of peripheral vision, in other words, collapses the two rows of Table 1; search may probe peripheral discriminability, not what tasks require attention.
Perhaps more surprising, peripheral vision allows us to collapse the columns of the table. A number of the easy (hard) dual tasks are easy (hard) for peripheral vision, based on either behavioral experiments or modeling (Rosenholtz, Huang, & Ehinger, Reference Rosenholtz, Huang and Ehinger2012). Dual task difficulty, then, may also depend more on the strengths and limitations of peripheral vision than on tasks that do or do not require attention.
One must ask why, if search and dual-task difficulty both probe peripheral vision, these tasks disagree on the off-diagonal of the table. Search displays contain considerably more clutter. This would impair scene search relative to the scene dual task (Figure 3B; Rosenholtz, Huang, & Ehinger, Reference Rosenholtz, Huang and Ehinger2012). A less cluttered dual-task display fundamentally changes the conjunction task; the observer only needs to identify the color and orientation of two uncrowded items (Braun & Julesz, Reference Braun and Julesz1998). Clutter in the cube search case had the opposite effect: the dense array of cubes aligned in a way that aided search (Rosenholtz, Huang, & Ehinger, Reference Rosenholtz, Huang and Ehinger2012).
A summary statistic encoding in peripheral vision resolves the anomaly that search and dual-task methods do not agree on what tasks require attention. Supposedly automatic tasks that did not require attention (Treisman, Reference Treisman2006) might simply have been inherently easy given the information available in peripheral vision. Looked at another way, this points to another sign of a Kuhnian crisis: The search and dual-task methods no longer lead to the answers promised by the paradigm. Search and dual-task experiments were seemingly fruitful, agreed-upon methods, with difficulty indicative of important aspects of the attentional mechanisms. Now it seems that one cannot easily interpret the results in that way.
This is not just a problem of methods. Rather, it necessitates rethinking a substantial amount of attention theory (Figure 5). Selection may not be early, and the information available preattentively may include more than basic feature maps. Feature binding may not require attention; the difficulty of both correctly binding features (Rosenholtz, Huang, Raj, Balas, & Ilie, Reference Rosenholtz, Huang, Raj, Balas and Ilie2012) and perceiving the details may arise from losses in peripheral vision rather than from inattention.
Understanding peripheral vision necessitates rethinking a significant amount of attention theory, including preattentive processing and selective attention mechanisms as well as the need for attention for binding and to perceive details (red X’s).

More profoundly, we need to rethink selection itself. In order for the strengths and limitations of peripheral vision to predict search performance, observers must use peripheral vision to search for the target. This leaves room for considerably more parallel processing, albeit with reduced fidelity due to crowding. This does not sound much like selection, as commonly envisioned. Recent work has also called into question supposed physiological signs of sensory selection. When monkeys perform a discrimination task with one of several items in a neuron’s receptive field, the neuron responds as if only the target were present, as one would expect if the neuron selected the cued stimulus at the expense of the others (Desimone & Duncan, Reference Desimone and Duncan1995). However, if one inactivates the superior colliculus, thought to play a critical role in visual attention, the monkey behavior displays attentional deficits, while the attentional modulations in cortex persist, suggesting that the modulations may not demonstrate a causal mechanism for sensory selection (Krauzlis, Bollimunta, Arcizet, & Wang, Reference Krauzlis, Bollimunta, Arcizet and Wang2014).
One should also reconsider automaticity (which one might think of as the dual of selection). Evidence has not supported a distinction between tasks that do and do not require attention, nor “automatic” preattentive processing. Whether one notices a salient item or gets the gist of a scene — two common candidates for automatic processing — depends upon the difficulty of other simultaneous tasks (Joseph, Chun, & Nakayama, Reference Joseph, Chun and Nakayama1997; Rousselet, Thorpe, & Fabre-Thorpe, Reference Rousselet, Thorpe and Fabre-Thorpe2004; Matsukura, Brockmole, Boot, & Henderson, Reference Matsukura, Brockmole, Boot and Henderson2011; Cohen, Alvarez, & Nakayama, Reference Cohen, Alvarez and Nakayama2011; Mack & Clarke, Reference Mack and Clarke2012; Larson, Freeman, Ringer, & Loschky, Reference Larson, Freeman, Ringer and Loschky2014). In other words, these tasks are not automatic.
1.2. A paradigm shift and addressing the remaining crisis
One might reasonably call summary statistic encoding a paradigm shift, both for the science of visual attention and for vision more broadly. Researchers have long suggested that vision might use summary statistics to perform statistical tasks, such as texture discrimination and segmentation (Rosenholtz, Reference Rosenholtz and Wagemans2014). This summary statistic encoding, however, would underlie all visual tasks, including getting the gist of a scene, identifying a peripheral object, or searching for a target. The underlying computations make use of neural operations like those previously described – feature detectors, nonlinearities, and pooling operations. However, pooling over substantially larger areas to compute summary statistics makes available qualitatively different information (Figure 2). Vision looks fundamentally different from within this new paradigm. The encoding captures a great deal of useful information, while lacking the details necessary for certain tasks. This may at least partially explain such diverse phenomena as change blindness (Smith, Sharan, Park, Loschky, & Rosenholtz, under revision) and difficulty noting inconsistencies in an impossible figure. The richness of the information available across the field of view means that eye trackers likely tell us less than we thought about the attentional state of the observer and has led to re-examining the subjective richness of visual perception (Rosenholtz, Reference Rosenholtz2020; Cohen, Dennett, & Kanwisher, Reference Cohen, Dennett and Kanwisher2016). Research on summary statistic encoding has led to new proposals about what visual processing occurs in area V2 (Freeman, Ziemba, Heeger, Simoncelli, & Movshon, Reference Freeman, Ziemba, Heeger, Simoncelli and Movshon2013). It has as-yet-unrealized implications for all later visual processing, as vision scientists must re-envision how the visual system finds perceptually meaningful groups and computes properties such as 3D shape from the information available in the summary statistics. Researchers have even looked for evidence of similar mechanisms in auditory perception (McDermott & Simoncelli, Reference McDermott and Simoncelli2011).
Despite this paradigm shift, the field of attention remains in crisis. Summary statistics have been tacked onto attention theory with little change to old notions of selection, preattentive processing, automaticity, or what tasks require attention. By analogy, the Copernican paradigm shift may have put the sun at the center, but it maintained the ideas of circular orbits and unchanging celestial spheres, and as a result, the new theory needed even more epicycles than the old (Gingerich, Reference Gingerich and Beer1975). Sixty years passed before Kepler introduced elliptical orbits governed by physical laws. The remainder of this paper attempts to gain insights into, essentially, the epicycles, celestial spheres, and elliptical orbits of visual attention.
Kuhn suggested that new and old paradigms are incommensurable, meaning that scientists struggle to hold in their minds both the new and old ideas. This suggests that it helps, when looking for a new theory, to eliminate the old from one’s thinking as much as possible. For visual attention, we need not only rethink the theory. Given that established methods may have probed, for instance, peripheral vision rather than attention, we also need to reexamine the critical set of phenomena. One might better draw an analogy not to Copernicus – who faced general agreement on the relevant phenomena – but to Francis Bacon’s reasoning about the nature of heat (Bacon, Reference Bacon2015).
Bacon gathered “known instances which agree in the same nature… without premature speculation” into three lists: “Instances Agreeing in the Nature of Heat”, “Instances in Proximity Where the Nature of Heat is Absent” – examples like those on the first list, but lacking heat – and a “Table of Degrees of Comparison in Heat” – examples in which heat is present to varying degrees. By analogy, this paper re-examines phenomena attributed to attention, and which therefore seem likely to provide insights into its nature, and creates two lists of critical phenomena: The first contains phenomena that demonstrate clear evidence of additional capacity limits. If we abandoned attention theory, these phenomena would require explanation. The second contains phenomena in which human vision works well, seemingly without the same sorts of limits apparent in the first list. This list enumerates capabilities of the visual system that any viable theory must explain.
It can be difficult to reason about critical phenomena and a new theory when attention is already an overloaded term (Chun et al., Reference Chun, Golumb and Turk-Browne2011; Anderson, Reference Anderson2011; Hommel, et al., Reference Hommel, Chapman, Cisek, Neyedli, Song and Welsh2019), often used gratuitously (Anderson, Reference Anderson2011). Language can stand in the way. To help make a fresh start, for a year I banned the word “attention”. Lab members avoided or attempted to clarify terminology like “selection”, and I encouraged the group to be dissatisfied with explanations that relied on “available resources” without suggesting the nature of those resources. Given the difficulty measuring attention, I advised students not to blithely assume they knew a person’s attentional state.
Banning “attention” provides a couple of additional benefits. Examining whether a given phenomenon demonstrates attention while simultaneously rethinking attention poses a chicken-and-egg problem. Restricting the use of the word suggests instead asking, “If we were frugal in the use of ‘attention’, would we use it here?” Banning “attention” also encourages us to talk about phenomena with minimal assumptions about the nature of capacity limits and the mechanisms for dealing with those limits. Examining phenomena as agnostically as possible helped in developing seeds of alternative theories.
The following section presents vignettes about phenomena that my lab pondered in search of the critical phenomena. Of course, it does not provide an exhaustive literature review, and my lists of critical phenomena are no doubt incomplete. Rather, this paper showcases specific examples that I think provide important insights into the nature of attention and/or demonstrate the process of rethinking the old paradigm. It focuses on behavioral effects rather than physiology (for discussion of additional phenomena see Rosenholtz, Reference Rosenholtz2017; Rosenholtz, Reference Rosenholtz2020). The section “Thoughts and a proposal” asks what the critical phenomena might have in common, and what might be the associated capacity limit(s) and mechanism(s). I will discuss a couple of alternative theories.
First, a brief example: overt attention, in which one directs attention by directing one’s eyes. Terminology already exists for fixation, saccade planning, and so on; if one had to pay money every time one used “attention”, one might not use it here. In deciding what goes on the list of critical phenomena, we should also ask to what degree covert and overt attention point to similar limits and mechanisms.
Humans typically only point our eyes at one location at a time. In contrast, attention theories propose that covert attention can be divided or diffused. Overt and covert attention also seem to have different consequences. Fixating provides excellent information at the point of fixation, but puts much of the visual field in the periphery, subject to crowding, reduced acuity, etc. On the other hand, after many years of studying attention, I still do not feel like I have a clear understanding of the perceptual consequences of focusing covert attention, for either the attended or unattended information. If the limits of covert and overt attention differ, as do their consequences, then what might justify calling them both attention? Perhaps the similarity lies only in how one decides what to focus on next. Common factors likely come into play: bottom-up stimulus factors, top-down task demands, prior probabilities and other contextual knowledge, the information gathered so far, reward, and so on. Several papers rethinking attention point to the importance of studying priority maps (Hommel, et al., Reference Hommel, Chapman, Cisek, Neyedli, Song and Welsh2019) and Bayesian decision processes (Anderson, Reference Anderson2011). I certainly agree with the value of such topics, although I would question whether associating them with the overused “attention” adds clarity.
2. Rethinking attention: Enumerating phenomena in need of explanation
Perhaps some previous work confused attention with peripheral vision because researchers used behavioral paradigms such as visual search that do not explicitly manipulate attention. An explicit manipulation might compare conditions with and without attention, or with attention to one item as opposed to another. This section almost exclusively considers paradigms that manipulate attention through cueing or a change in task. Loosely speaking, attention as task, object-based attention, cued search, and mental marking fall under cueing, with inattentional blindness and multitasking otherwise manipulating the task, though the dividing line between the two is fuzzy.
2.1. Attention as task
Some experiments ask the observer to “pay attention”. For example, one might cue the observer to attend to and make a judgment about a target while ignoring other items, e.g. (Lavie, Hirst, de Fockert, & Viding, Reference Lavie, Hirst, de Fockert and Viding2004). Or one might tell the observer that only non-targets will have a singleton color, so they should ignore those items during visual search (Theeuwes, Reference Theeuwes1992). Nonetheless, the ignored items often distract the observer, although this can come at a cost of as little as 20-40 ms (Theeuwes, Reference Theeuwes1992). Researchers often interpret the results in terms of what captures attention.
Selectively attending is the observer’s task. Experimenters describe a task in natural language, and the brain must convert that description to its internal instruction set, making use of existing mechanisms. The visual system could do its best to perform the nominal task even if it had no mechanism for selecting an individual item. One can imagine similar results even without capacity limits. The observer perceives the entire display. Maybe it takes a few milliseconds to remember that responding based on the distractor gives the wrong answer. Or why not spend 40 ms enjoying an unusual item?
The most interesting thing about attention-as-task experiments is the observer’s failure to process only the target. One might expect distraction by salient stimuli, supposedly preattentively processed. However, results also suggest processing of not-terribly-salient numbers or letters to the extent that their category can cause response conflict (Lavie et al., Reference Lavie, Hirst, de Fockert and Viding2004). Furthermore, researchers have suggested that distraction depends on whether saliency is task-relevant (Folk, Remington, & Johnston, Reference Folk, Remington and Johnston1992), on the perceptual task difficulty, and in a complex way on the difficulty of simultaneous cognitive tasks (Lavie et al., Reference Lavie, Hirst, de Fockert and Viding2004), suggesting that distraction does not merely arise from automatic processing. These results seem puzzling from the point of view of the attention paradigm; the main mechanism for getting around a bottleneck in vision is leaky, allowing other information to pass through? Of course, if selection were perfect, vision would never work, with disastrous consequences; how would you notice the approaching tiger when you were paying attention to picking berries?
To help us rethink attention, we should try to describe phenomena in a more agnostic way that does not rely on earlier concepts of attention or selection. We might say that the experimenter asks the observer to make a judgment about the target, making sure not to respond based on any other item. Nonetheless, the observer perceives, to some degree, the task-irrelevant items, and this can cause a modest degradation in performance at judging the target. Both the modest cost of distraction and the apparent failure to select only the target seem interesting critical phenomena (see also Hommel, et al., Reference Hommel, Chapman, Cisek, Neyedli, Song and Welsh2019).
2.2. Object-based attention
Another set of cueing experiments tests object-based attention (OBA). Figure 6A shows the basic methodology. Observers respond to a target about 10-20 ms faster when it appears on a cued object than when it appears on a different object, despite controlling for the distance between the invalid cue and the target (e.g. Egly, Driver, & Rafal, Reference Egly, Driver and Rafal1994; Francis & Thunell, Reference Francis and Thunell2022). This has been taken as evidence that the observer’s attention automatically spreads from the cue location to the entire cued object. At the time of the earliest OBA experiments, these phenomena required a significant shift in thinking about attention, since many models assumed that attention was directed to a location rather than an object (Kanwisher & Driver, Reference Kanwisher and Driver1992). Complicating this story, the same-object advantage applies more for horizontal objects than vertical (Al-Janabi & Greenberg, Reference Al-Janabi and Greenberg2016; Chen & Cave, Reference Chen and Cave2019; Francis & Thunell, Reference Francis and Thunell2022). Furthermore, when comparing two targets with no precue (Lamy & Egeth, Reference Lamy and Egeth2002), one less often finds a same-object advantage (Chen, Cave, Basu, Suresh, & Wiltshire, Reference Chen, Cave, Basu, Suresh and Wiltshire2020).
Object-based attention. (A) Experimental methodology. The experimenter cues one end of an object. After a delay (here, 100 ms), a target randomly appears either at the same location, the opposite end of the same object, or the equidistant location on the other object. Results often show a small (∼10 ms) same-object benefit in the invalid conditions. (B) Object-based attention with a single object. Observers are faster to make judgments about the target (circle) when the object between it and the cue (+) is simple (left) than when it is complex (right). Based on stimuli from Chen et al., Reference Chen, Cave, Basu, Suresh and Wiltshire2020.

The OBA literature has complex and often seemingly conflicting results, with small effects; later work (Francis & Thunell, Reference Francis and Thunell2022) has called into question much of the literature, due to underpowered studies. (In this paper, any results citing Francis & Thunell, Reference Francis and Thunell2022, indicate OBA effects that replicated in their higher-powered study.) I nonetheless discuss OBA in the hope that it provides insights.
Peripheral vision has already explained several supposedly attentional phenomena; what about OBA? The horizontal-vertical asymmetry in OBA mirrors peripheral vision’s horizontal-vertical asymmetries (Strasburger, Rentschler, & Jüttner, Reference Strasburger, Rentschler and Jüttner2011): both acuity and crowding are worse at a given eccentricity in the vertical direction than in the horizontal direction. In addition, OBA experiments typically have more clutter between the cue and the different-object target than between the cue and the same-object target, which might make judging the latter easier due to crowding. In the two-rectangle stimuli in Figure 6A, for instance, the cue and same-object target have nothing but blank space between them, whereas the region between the cue and different-object target contains the edges of both objects. Crowding might not prohibit identification of the target but rather might necessitate additional time to integrate information from the stimulus, slowing identification.
However, drawing parallels between crowding and object-based attention presumes that the observer fixates on or near the cue. If they fixate the central “+”, as directed, all targets would appear diagonal relative to the fixation, one would not expect a horizontal-vertical asymmetry due to peripheral vision, and the same- and different-object targets would usually be equally crowded. However, the vast majority of object-based attention experiments have not used an eye tracker (including Francis & Thunell, Reference Francis and Thunell2022), so many of the classic results could have had a peripheral confound. Observers need only fixate nearer the cue on a small number of trials for crowding to explain the effects. The experimental design typically allows more than enough time for a saccade, and researchers typically find an OBA effect only under that condition (e.g. Egly et al., Reference Egly, Driver and Rafal1994; Francis & Thunell, Reference Francis and Thunell2022). Furthermore, the observer would benefit from breaking fixation; with cue validity as high as 75-80% (e.g. Egly et al., Reference Egly, Driver and Rafal1994; Francis & Thunell, Reference Francis and Thunell2022), fixating the cued location often means fixating the target, making the task easy. Comparison tasks may less often lead to OBA effects because with two task-relevant locations the observer less obviously benefits from breaking fixation.
More recent work questions object-based attention by putting target and cue on the same object and varying the complexity of the intervening object (Figure 6B; Chen et al., Reference Chen, Cave, Basu, Suresh and Wiltshire2020). Observers perform better when the object between cue and target is simple, and worse when it is complex, in line with a crowding explanation.
Taken together, the so-called object-based attention phenomena may instead derive from peripheral vision, with the small effects occurring because observers break fixation on a small fraction of trials. This is certainly not to say that all processing is location-based rather than object-based. One would expect some object-based effects from the proposal in Section 3.4. Rather, it is not clear at this point that one needs to include amongst the critical phenomena the automatic spread of attention from a cued location to the rest of the object.
2.3. Cued search, object recognition, and ideal observers
The cued search methodology provides another interesting cueing manipulation. The experimenter flags a subset of display items as potential targets. Observers search faster through this subset than through the complete set; performance often appears equivalent to searching through a display containing only the cued items (Grindley & Townsend, Reference Grindley and Townsend1968; Davis, Kramer, & Graham, Reference Davis, Kramer and Graham1983; Palmer, Ames, & Lindsey, Reference Palmer, Ames and Lindsey1993). In cases in which the presence of uncued items negatively impacts performance, researchers have suggested that lateral masking — a term previously used somewhat interchangeably with “crowding” — degrades search in the more cluttered display (Eriksen & Lappin, Reference Eriksen and Lappin1967; Eriksen & Rohrbaugh, Reference Eriksen and Rohrbaugh1970). Nonetheless, because cued search keeps the stimulus constant while varying the cue, the effects cannot be purely sensory.
James (Reference James1890) describes the “taking possession by the mind” of a subset of objects as happening at the expense of perception of others. Because the target always appears within the cued subset, these particular experiments do not provide evidence of any cost of attending to the subset. Nonetheless, Palmer et al. (Reference Palmer, Ames and Lindsey1993) suggest the results provide a clear example of attention: one attends to a subset of the items, as both evidenced by and leading to faster search times. (Zivony and Eimer, Reference Zivony and Eimer2021 have criticized this tendency to use an experimental result to infer both that attention occurred, and that attention was the cause of that result. Hommel et al., Reference Hommel, Chapman, Cisek, Neyedli, Song and Welsh2019, make a similar point.)
Attempting again to describe these results without reference to attention, one might say that cueing changes the priors for likely target locations (i.e. where one expects to find the target before getting any evidence from the stimulus itself), and that that effectively changes the task from “search all items for the target” to “search these items for the target.” Those changes matter: people perform better when they know more about where to search. This rephrasing raises the question of whether cueing affects decisional rather than perceptual processes.
Palmer et al. (Reference Palmer, Ames and Lindsey1993) asked whether better performance searching through a subset of items necessarily implies a limited capacity perceptual mechanism that samples information only from the cued subset. To do this, they utilized ideal observer analysis. An ideal observer is a model that performs a task optimally, given the information available and certain assumptions. Palmer et al. (Reference Palmer, Ames and Lindsey1993) showed that an unlimited capacity ideal observer explains their results, without need for a perceptual attention mechanism like early selection. Knowing which subset contains the target reduces errors by allowing decision processes to ignore false alarms from non-cued distractors, improving performance. Whereas my lab began by examining what phenomena peripheral vision explains, Palmer et al. (Reference Palmer, Ames and Lindsey1993) — and others, e.g., Anderson (Reference Anderson2011) — suggest the important step of examining what phenomena Bayesian decision theory can explain, i.e. to what degree any intelligent system would exhibit the behavior.
Other researchers have used similar experiments and modeling to argue that search results do demonstrate limited capacity (e.g. Palmer, Fencsik, Flusberg, Horowitz & Wolfe, Reference Palmer, Fencsik, Flusberg, Horowitz and Wolfe2011). The question becomes whether one can make sense of the conditions under which this occurs (and occurs without a sensory confound like peripheral crowding). One hint perhaps comes from Palmer et al.’s (Reference Palmer, Ames and Lindsey1993) observers, who complained about the difficulty of searching within a subset of four items. Other research has also pointed to limits to an observer’s ability to respond to an arbitrarily complex cue (e.g. Eriksen & Webb, Reference Eriksen and Webb1989; Gobell, Tseng, & Sperling, Reference Gobell, Tseng and Sperling2004; Franconeri, Alvarez, & Cavanagh, Reference Franconeri, Alvarez and Cavanagh2013). We should consider these limits as some of the critical phenomena when developing a new understanding of limited capacity and the associated mechanisms.
A related issue arises when pondering the role of attention in ordinary object recognition. Does one select dog-like features to recognize a dog? Modern statistical-learning-based classifiers would distinguish a dog from a cat by making an intelligent decision based on both dog-like and cat-like features. Dog-recognition mechanisms fundamentally involve not-dog features. The selection/attention terminology reduces clarity, as it implies particular mechanisms that allow higher-level processing of some features but not others. On the other hand, to the extent that the visual system performs sub-optimally at object recognition, in a way not explainable by purely sensory limits, such phenomena could inform our understanding of capacity limits and attention.
Both of these examples use “attention” to mean something like “use top-down knowledge to perform a task.” While that concept might deserve its own word, our goal here is to collect phenomena that demonstrate capacity limits and in doing so understand the special mechanisms for dealing with those limits. As such, we clearly should not include phenomena explainable by an unlimited-capacity ideal observer. The human visual system must make use of top-down information, and any viable theory of vision would include such a mechanism. There is no need to elevate such a mechanism by calling it “attention”.
2.4. Mental marking
Another set of cueing tasks falls in a category one might call mental marking (Figure 7). Loosely speaking, this refers to tasks in which the observer gives some sort of special status to cued locations, so as to make judgments about those locations. Huang and Pashler (Reference Huang and Pashler2007) enumerate a number of such tasks. Multiple object tracking (MOT) provides a classic example (Figure 7E). The observer views a set of items, with a subset of them cued. The cue disappears, and the observer must track the cued subset as the objects move, ultimately identifying the tracked objects. With no visible cue during the object motion, one might think of the observer as mentally marking the items to track. Many of the classic visual cognition tasks of Ullman (Reference Ullman and Ullman1996) fall into this category, as one can interpret them as asking the observer to mentally trace along a path (Figure 7A-C).
Mental marking tasks. (A) Is there a path between the dot and “x”? (B) Do the two dots appear on the same line? (C) Does the dot lie within the closed curve? (D) What shape do the red dots form? (E) Multiple object tracking. (F) Bistable Necker cube. Reddish glow shows loci of attention described in the text.

Should we consider performance on mental marking tasks in our list of critical attentional phenomena? While most tasks examined in this paper aim to better perceive the details of the attended object(s), mental marking tasks instead typically have the goal of keeping track of a subset of location(s) and making judgments about those locations (Huang and Pashler, Reference Huang and Pashler2007, draw a similar distinction). If these tasks have different goals, they might also probe different limits and mechanisms. To examine this possibility, consider two kinds of evidence for limits in mental marking tasks: changes in the percept and performance limits.
2.4.1. Changes in the percept
A mentally marked object can appear slightly higher in contrast (Carrasco, Reference Carrasco2011), closer or farther (Huang & Pashler, Reference Huang and Pashler2009), or a different size (Anton-Erxleben, Henrich, & Treue, Reference Anton-Erxleben, Henrich and Treue2007), or shape (Fortenbaugh, Prinzmetal, & Robertson, Reference Fortenbaugh, Prinzmetal and Robertson2011). Physiology research finds similar contrast effects (Reynolds, Pasternak, & Desimone, Reference Reynolds, Pasternak and Desimone2000; Martinez-Trujillo & Treue, Reference Martinez-Trujillo and Treue2002). Such perceptual changes might be detrimental when discriminating the features of the cued object but could benefit keeping track of or making judgments about the cued location(s). In addition to these relatively subtle perceptual changes, the locus of spatial attention to a bistable figure (Figure 1F) can strongly bias the percept in favor of one interpretation over the other (e.g. Tsal & Kolbet, Reference Tsal and Kolbet1985; Peterson & Gibson, Reference Peterson and Gibson1991). One must, of course, take care to distinguish attentional effects from fixational; in the Necker cube (Ellis & Stark, Reference Ellis and Stark1978; Kawabata, Yamagami, & Noaki, Reference Kawabata, Yamagami and Noaki1978) and wife/mother-in-law stimuli, among others (Ruggieri & Fernandez, Reference Ruggieri and Fernandez1994), fixation location correlates with the dominant interpretation, suggesting a role for peripheral vision. However, changing the focus of attention (i.e., the mentally marked location) can affect the preferred interpretation of the Necker cube even when the observer cannot change fixation — for example, when the observer changes the marked location within an afterimage (see Piggins, Reference Piggins1979) – and experiments demonstrating physiological effects of attention monitored eye position.
It seems possible that changes in the percept might implicate different mechanisms and limits. In addition to perceiving the stimulus one might imagine the locations of the marked items, leading to subtle perceptual changes to those items. Tasks in which the observer must monitor a subset of items for an extended time might invoke mental imagery mechanisms, to help keep track of the monitored items. Implicating mental imagery might explain why effects on perceived contrast or size tend to be quite small compared to, say, dual-task or inattentional blindness effects. Larger perceptual effects could occur with bistable figures because a slight change in the internal representation might suffice to induce a large shift in the interpretation of an ambiguous figure.
2.4.2. Performance limits
In addition to perceptual effects, mental marking tasks also show performance limits. Observers have difficulty tracking more than a few objects in an MOT task (Pylyshyn & Storm, Reference Pylyshyn and Storm1988). Huang and Pashler (Reference Huang and Pashler2007) review evidence that observers can perceive only one group at a time. Observers might perceive the shape formed by just the red items (Figure 7D), just the blue items, or even by both the red and blue items, but have difficulty, Huang and Pashler argue, simultaneously perceiving both the shape formed by the red items and that formed by the blue items.
In curve-following tasks (Figure 7A-B), the observer must indicate whether a second point lies on the same curve or path as a given starting point. Completion time increases as a function of path length (Jolicoeur, Ullman, & Mackay, Reference Jolicoeur, Ullman and Mackay1986), even when observers are forced to fixate (Houtkamp, Spekreijse, & Roelfsema, Reference Houtkamp, Spekreijse and Roelfsema2003; Jolicoeur et al., Reference Jolicoeur, Ullman and Mackay1986). Furthermore, observers can better report a color lying farther along the path when it appears later in the trial, implying a shift in processing with time (Houtkamp, Spekreijse, & Roelfsema, Reference Houtkamp, Spekreijse and Roelfsema2003). Researchers have concluded that the tasks cannot be solved with parallel processing, and suggested a mechanism in which one places a mental mark at the first point (Figure 7B), then moves it along the path until either encountering the second point or reaching the end of the curve. This sounds a bit like moving a spotlight of attention, though Pooresmaeli and Roelfsema (Reference Pooresmaeli and Roelfsema2014) have instead argued for activation that spreads from the start until it mentally marks the entire perceived contour.
Peripheral vision likely plays a role in these phenomena, as they tend to utilize crowded stimuli. When cueing a subset of items (Figure 7D-E), other items often lie within the critical spacing of crowding. Intriligator and Cavanagh (Reference Intriligator and Cavanagh2001) demonstrate that the critical spacing of crowding predicts spacing limits on their mental marking task.
Ullman (Reference Ullman1984) suggested that difficulty on his visual cognition tasks (Figure 7A-C) might be governed at least in part by crowding. Crowding-related manipulations such as making the paths denser or more complex (e.g., more curved) lead to poorer performance (Jolicoeur, Ullman, & Mackay, Reference Jolicoeur, Ullman and Mackay1991), and results are largely scale-invariant, i.e., independent of viewing distance (Jolicoeur & Ingleton, Reference Jolicoeur and Ingleton1991), as expected for tasks governed by peripheral vision (Van Essen & Anderson, Reference Van Essen, Anderson, Zornetzer, Davis, Lau and McKenna1995; Rosenholtz, Reference Rosenholtz2016).
Even the serial behavior in curve following does not rule out considerable parallel processing during each fixation. Both limited and unlimited capacity models assume that given more time the visual system can integrate more samples of noisy observations to reduce uncertainty (Shaw, Reference Shaw1978). Presumably the crowded periphery induces more uncertain observations and therefore requires more integration time. Tasks that require peripheral information might lead to longer reaction times. Longer paths, being more likely to contain uncertain sections due to crowding, would take longer to process, even with parallel processing (Palmer et al., Reference Palmer, Ames and Lindsey1993 makes a similar argument about serial slopes in search). Accounting for the serial awareness of path color (Houtkamp et al., Reference Houtkamp, Spekreijse and Roelfsema2003) is less obvious, but perhaps awareness results from the completed processing of each path section. If so, the observer might take longer to become aware of later portions of the curve without serial processing, per se. Even if observers do serially follow curves, they might do so as one possible strategy. When forced to fixate, serially moving a mental mark may feel like a natural alternative to moving one’s eyes (or pen) along the path under normal viewing conditions.
On the other hand, curve following encounters a more obvious limit: one cannot follow all curves at once. Ullman (Reference Ullman1984) makes two arguments for why: First, it would be incredibly complex to solve curve-following by classifying all possible curves as passing or not passing through a pair of points, and one would probably not have built-in mechanisms to do this in parallel. Second, a flexible visual system should instead piece together generic components into visual routines that perform fairly arbitrary tasks. Some simple computations would happen in parallel across the field of view, for example estimating local orientation. However, spatially structured processes like curve following would be prime candidates for visual routines. Spatially structured processes require location information to specify the task; to ask about the curve passing through a given location one needs to specify that location. Ullman (Reference Ullman1984) explicitly contrasts these limits with selective attention theory: one must select locations not to get information through the bottleneck, but rather because the locations determine the task.
Similar arguments could perhaps be made for other mental marking tasks. MOT, which one might think of as a sort of curve following, may also be an inherently complex task (Rosenholtz, Reference Rosenholtz2020). Judging the shape specified by the red dots in Figure 7D in some sense requires tracing an imagined curve between neighboring dots. Huang and Pashler (Reference Huang and Pashler2007) also seem to point to a task limit of some sort: they argue that observers cannot perform a task with the red group and simultaneously perform a separate task with the blue group. Perception of bistable figures may demonstrate an interesting version of the same limit: the visual system could theoretically provide us with both possible percepts simultaneously, but tends not to, at least if those percepts conflict in their interpretation of the stimulus (Neisser, Reference Neisser1976). These performance limits on mental marking seem worth considering amongst our critical phenomena.
2.5. Inattentional blindness
Inattentional blindness (IAB) experiments provide another explicit manipulation of attention. The observer performs a nominal task, and then must indicate whether they noticed an unexpected stimulus and/or make judgments about that stimulus. Often the experimenter also tests the observer in a dual-task condition, requiring them to both perform the original task and judge the now-expected stimulus (e.g., Mack and Rock, Reference Mack and Rock1998). Across a variety of stimuli and tasks, observers more easily notice an expected stimulus than an unexpected stimulus.
The usual interpretation (Mack & Rock, Reference Mack and Rock1998) presumes that the observer attends to the features and/or portion of the display relevant for the nominal task, and inattention to the unexpected stimulus renders them unable to perceive it. In the dual-task trials, the observer supposedly divides attention, making possible some perception of both stimuli. Inattentional blindness has been taken as evidence for little processing without attention. However, researchers have suggested other interpretations. Perhaps observers perceive the unexpected stimulus but do not become aware of it, and/or quickly forget (Wolfe, Reference Wolfe and Coltheart1999). This might explain reduced inattentional blindness for meaningful stimuli like one’s own name, as well as priming effects (Mack & Rock, Reference Mack and Rock1998). Some IAB paradigms attempt to overcome these issues by making the unexpected stimulus sufficiently shocking (a gorilla, a unicycling clown, money on a tree) to make forgetting unlikely; nonetheless, observers often fail to become aware of the unexpected stimulus (Simons & Chabris, Reference Simons and Chabris1999; Hyman, Boss, Wise, McKenzie, & Caggiano, Reference Hyman, Boss, Wise, McKenzie and Caggiano2010; Hyman, Sarb, & Wise-Swanson, Reference Hyman, Sarb and Wise-Swanson2014). Interestingly, in some studies, even though observers fail to report the unexpected stimulus, they move to avoid a collision, suggesting that perception occurs (Tractinsky & Shinar, Reference Tractinsky and Shinar2008; Hyman et al., Reference Hyman, Sarb and Wise-Swanson2014). Any viable explanation for IAB also needs to explain this perception without awareness.
Peripheral vision seems unlikely to explain the classic Mack and Rock (Reference Mack and Rock1998) experiments. Their primary task discriminating the lengths of two crossing lines likely encourages center fixation, and dual-task performance suggests the IAB is not purely perceptual. Peripheral vision may be one factor in the invisible gorilla phenomena (Simons & Chabris, Reference Simons and Chabris1999), or blindness to scene cut errors (Levin & Simons, Reference Levin and Simons1997), as examples with real-world stimuli have typically not tracked the observer’s gaze (Rosenholtz, Reference Rosenholtz2020).
In describing these results without reference to attention, one might say that the observer has a nominal task and performs poorly at a surprise task (noticing the unexpected stimulus). When the experimenter later informs the observer about the latter task, the observer can to some degree perform both that and the nominal task. On the other hand, observers can complete tasks such as safely navigating the world – moving to avoid a collision – even when not explicitly informed of those tasks.
Framed this way, inattentional blindness does not appear particularly surprising. Surely one can often perform a task better if one knows the task. Inattentional blindness was surprising in part because observers missed supposedly automatically processed stimuli. If one automatically processes salient items, then one should notice them even when engaged in another task, but this not the case for 25% of observers (Mack & Rock, Reference Mack and Rock1998). However, as previously noted, later evidence has not supported the notion of perception that occurs automatically and without requiring attention.
If no perception occurs automatically, then perhaps we should more usefully think of all perception as resulting from performing a task. If the visual system had no limits on the tasks it could simultaneously perform, then it would perform all tasks, and an observer would have no trouble noticing an unexpected item. It should come as no surprise that the visual system does have task limits. The visual system must constantly choose what task to do next among many options.
2.6. Dual task and multitasking in general
2.6.1. Illusory conjunctions
Another manipulation of task occurs in dual-task experiments. One interesting class of dual-task results concerns illusory conjunctions. Experimenters show a rapidly presented display of different-colored letters and ask observers to report the identity and features (color, location) of as many as they can. Observers often report illusory conjunctions, i.e., the features of one item paired with the identity of another. Early experiments used rapid displays but no explicit attention manipulation (e.g., Snyder, Reference Snyder1972; Treisman & Schmidt, Reference Treisman and Schmidt1982). Some of these experiments used crowded peripheral stimuli (Snyder, Reference Snyder1972; Cohen & Ivry, Reference Cohen and Ivry1989), making it possible that peripheral vision plays a role. Experiments and modeling have shown that peripheral vision can make the pairings of identity, color, and location ambiguous, leading to illusory conjunctions (Poder & Wagemans, Reference Poder and Wagemans2007; Reference Rosenholtz, Huang, Raj, Balas and IlieRosenholtz, Huang, Raj, et al., Reference Rosenholtz, Huang and Ehinger2012; Keshvari & Rosenholtz, Reference Keshvari and Rosenholtz2016). However, illusory conjunctions cannot purely be a peripheral phenomenon. Treisman and Schmidt (Reference Treisman and Schmidt1982) briefly presented foveal, colored letters, flanked by black digits. Observers first had to accurately report the numbers, then the position, color, and identity of as many of the letters as they could. Observers incorrectly paired color and letter identity roughly a third of the time, considerably more often than they reported an absent feature, e.g., a correct letter in a non-present color. Illusory conjunctions occur even in the fovea. Treisman and Schmidt (Reference Treisman and Schmidt1982) conclude that correct feature binding requires attention, consistent with feature integration theory (Treisman & Gelade, Reference Treisman and Gelade1980).
This may, however, be a Goldilocks effect: Experimenters might initially choose a display time that is too long — observers make no errors — and conclude that this did not adequately strain attentional resources. Next, they try a display time that is too short; observers randomly guess letters. Clearly this impairs one’s ability to study the effects of attention. Somewhere in between the display time is just right, and observers make in-between sorts of errors. Illusory conjunctions would likely dominate those errors. This is a variant of asking what an ideal observer would do: would any reasonable theory predict different results? In fact, Treisman and Schmidt (Reference Treisman and Schmidt1982) describe just this sort of situation:
It is worth pointing out a problem… in designing experiments on illusory conjunctions… (1) The theory claims that conjunctions arise when attention is overloaded; we therefore need to… use brief exposures… (2) However, illusory conjunctions can be formed only — from correctly identified features;… the briefer the exposure, the poorer the quality of the sensory information… Thus we were forced to trade off the need to load resources against the risk of introducing data limits… we controlled exposure durations separately for each subject in order to produce a feature error rate of about 10%.
This reasoning suggests caution in interpreting illusory conjunction experiments in terms of the need for attention to bind features.
2.6.2. Dual task
Considering dual-task performance more generally, one can find results more relevant to the present purpose. On the one hand, one cannot interpret easy vs. hard dual-task results in terms of whether the peripheral task does or does not require attention (Section 1.1). Rather, peripheral vision has been surprisingly predictive of dual-task difficulty. A limited-resource account might suggest that hard peripheral tasks require more resources, making performance more impaired in dual-task conditions; a satisfying explanation if only we could make the nature of the limited resources less vague.
On the other hand, peripheral vision cannot explain the more basic effect: that dual-task performance is often worse than single task. Nor would an unlimited-capacity ideal observer predict worse dual-task performance. Two different parts of the brain could do the two different tasks, with no cost to doing both. Dual tasks must encounter some additional limit.
2.6.3. Checking our understanding of multitasking in the real world: Driving
As a preliminary summary of rethinking attention, consider visual perception in the real-world task of driving a car. The literature contains a number of puzzles. Reporting in mainstream media paints a dire portrait of distracted driving, seemingly based on the classic attention paradigm: perception is poor without attention, and inattentional blindness and dual-task difficulty prove the danger of distracted driving. However, much as distracted driving is concerning, this would seem to overstate the case. Driving itself inherently involves a great deal of multitasking: one must stay in one’s lane, navigate turns, avoid collisions, watch out for hazards, and notice road signs and traffic lights. Nonetheless, U.S. driving statistics from recent years indicate on average over 600,000 vehicle-miles driven per reported accident (Stewart, Reference Stewart2022, March), though this likely overestimates driving safety due to underreporting. Furthermore, drivers can safely navigate familiar routes without awareness of doing so – in other words with very minimal amounts of what a lay person would call “paying attention” – a phenomenon referred to as a zombie behavior (Koch & Crick, Reference Koch and Crick2001). Does our re-examination of attention phenomena and theory help resolve these puzzles?
Some of the direst distracted driving predictions rely on the idea of early selection. Our rethinking based on our understanding of peripheral vision suggests that vision has access to considerable information across the field of view, as opposed to the tunnel vision predicted by early selection. Of course, more recent attention theories also allow for parallel computation of the gist of the driving scene. In fact, the notion of tunnel vision remains controversial (Young, Reference Young2012; Gaspar, et al., Reference Gaspar, Ward, Neider, Crowell, Carbonari, Kaczmarski and Loschky2016; Wolfe, Dobres, Rosenholtz, & Reimer, Reference Wolfe, Dobres, Rosenholtz and Reimer2017).
The risk of distractions such as cell phone use may instead arise due to peripheral vision, as the driver fixates away from driving-relevant information. Even a non-visual distraction can lead to a change in fixation patterns (Recarte & Nunes, Reference Recarte and Nunes2003), potentially putting critical information in the periphery. Performance of driving-relevant tasks degrades in the periphery, though drivers perform reasonably well at detecting hazards (Huestegge & Bröcker, Reference Huestegge and Bröcker2016; Wolfe, Seppelt, Mehler, Reimer, & Rosenholtz, Reference Wolfe, Seppelt, Mehler, Reimer and Rosenholtz2019) and following lane markers (Robertshaw & Wilkie, Reference Robertshaw and Wilkie2008). The task-relevant multitasking required by ordinary driving would likely be safer since at least drivers would keep their eyes on the road.
Both inattentional blindness and dual-task results do suggest that perception faces limits beyond sensory encoding losses, and worryingly both phenomena suggest that perception can be limited even at the fovea. This is well known in the driving literature as “looked but failed to see” (see Wolfe, Kosovicheva, & Wolfe, Reference Wolfe, Kosovicheva and Wolfe2022, for a recent review). On the other hand, I have suggested reframing inattentional blindness as occurring because knowing the task matters. Surely even the most distracted driver knows that their main task is to drive safely. In addition, not all dual tasks lead to worse performance than single tasks. Observers perform well at driving-relevant dual tasks such as getting the gist of a scene or identifying a salient item. Furthermore, in-lab semantic tasks may not generalize well to action-oriented dual tasks like lane keeping or braking to avoid a collision.
In summary, there certainly remain reasons to worry about distracted driving, from improper fixations to other losses that can affect performance even of foveal tasks. However, the available information may be consistent with good performance at the multitasking involved in ordinary driving, and with some zombie behaviors.
3. Thoughts and a proposal
This section summarizes the results of reexamining a number of purported attentional phenomena. Reconsidering these phenomena revealed additional signs of crisis. See Box A for the complete list. Box presents the resulting lists of critical phenomena. Rephrasing these phenomena in a more mechanism-agnostic way points to a potentially coherent capacity limit on visual perception, and perhaps on cognition more broadly. I will present some thoughts about the nature of that limit, and possible underlying mechanisms.
Comprehensive list of indicators that visual attention is in crisis

3.1. Is there an additional limit?
I began by being open to the possibility of no additional capacity limit with an attention-like or selection-like mechanism. In examining the need for an additional limit, and the nature of that limit, I have argued against including some supposedly attentional phenomena in our list of critical phenomena, at least to begin with. In some cases, peripheral vision may have been the dominant factor, rather than attention (e.g., search, scene perception, change blindness, and object-based attention). Other phenomena could be at least partially explained by an unlimited-capacity ideal observer (e.g. some cued search), and one need not posit an additional attentional mechanism. In a related point, I have argued against associating attention with mechanisms that any reasonable model of vision would include (use of top-down information and planning eye movements).
However, many phenomena seem to point to a possibly coherent additional limit. Box (left column) shows my conservative list. I have suggested that to synthesize these phenomena it helps to assume that all perception results from doing a task and that there are limits to task performance. If so, knowing the task should often matter (inattentional blindness, cued search), and dual-task performance would often be worse than single-task. Task limits could restrict the pattern of items observers can monitor or mentally mark, or the number of curves they can simultaneously follow. Visual search and change detection are likely subject to such task limits as well. Task limits are compatible with cognitive load phenomenology (e.g. Lavie et al., Reference Lavie, Hirst, de Fockert and Viding2004) meaning that task limits might apply to more than just visual processing. On the other hand, many studies have suggested that attention modestly changes appearance (e.g., increases apparent contrast or size), corresponding to similar changes in physiological response. These results seem harder to think of in terms of task limits and may point to different limits or mechanisms.
Critical visual attention phenomena, including both evidence of additional capacity limits and rich perception in apparent contradiction to such limits.

The reader may be interested in comparing these two lists to those in other recent papers questioning attention (Anderson, Reference Anderson2011; Hommel, et al., Reference Hommel, Chapman, Cisek, Neyedli, Song and Welsh2019; Zivony & Eimer, Reference Zivony and Eimer2021). Can a single additional limit explain both vision’s failures and successes, and if so, what is its nature and associated mechanisms? The following subsections discuss two alternative proposals and indicate my current favorite.
3.2. Is inattention like looking away?
Contemporaneous work proposed that in the absence of attention, vision might only encode summary statistics (Rensink, Reference Rensink2000; Treisman, Reference Treisman2006; Oliva & Torralba, Reference Oliva and Torralba2006; Wolfe et al., Reference Wolfe, Vo, Evans and Greene2011). Arguably this misattributed summary statistic-like effects to inattention rather than peripheral vision. Nonetheless, the idea that covert and overt attentional mechanisms might share more than priority maps (Section 1.2) has a certain appeal, not least because of the success of summary statistics in making sense of diverse phenomena.
How might this work? Attention could narrow the pooling mechanisms that lead to crowding. Summarization would occur over a larger region when not attending. Some behavioral and physiological evidence seems consistent with receptive fields changing size, whether due to attention (Moran & Desimone, Reference Moran and Desimone1985; Desimone & Duncan, Reference Desimone and Duncan1995), or training (Chen, et al., Reference Chen, Shin, Millin, Song, Kwon and Tjan2019). Researchers have even proposed that the pooling mechanisms underlying peripheral crowding might vary depending upon the perceptual organization of the stimulus (Sayim, Westheimer, & Herzog, Reference Sayim, Westheimer and Herzog2010; Manassi, Sayim, & Herzog, Reference Manassi, Sayim and Herzog2012; Manassi, Lonchampt, Clarke, & Herzog, Reference Manassi, Lonchampt, Clarke and Herzog2016). Adjusting the size of the pooling regions need not require rewiring new receptive fields on the fly. Rather, attention could reweight receptive field inputs, or change the effective size through interactions between neighbors. In the latter case, attention might enable use of multiple overlapping receptive fields to better reason about the stimulus. The presence of a cat and a boat within a single receptive field (RF) could prohibit identifying the cat from that RF alone. Another RF might contain only the boat, leading to its identification. Together, the two receptive fields could explain away the boat features, effectively – but not actually – reducing the size of the first receptive field in order to identify the cat. Vision might be limited by the arrangement of receptive fields and the complexity of the computations that combine their information, in line with suggestions from Franconeri et al. (Reference Franconeri, Alvarez and Cavanagh2013).
Despite my early advocacy for this flexible pooling theory (Rosenholtz, Reference Rosenholtz2011; Rosenholtz, Huang, & Ehinger, Reference Rosenholtz, Huang and Ehinger2012), I became disillusioned for two main reasons. First, success of the theory depends greatly on the specifics regarding the size and layout of the pooling regions. Crowding experiments – with observers attending to the peripheral target – presumably probe the minimum pooling size. How much larger would pooling regions grow without attention, and at what cost to performance? Furthermore, Freeman and Simoncelli (Reference Freeman and Simoncelli2011) found that the same set of pooling regions predicted performance at both peripheral letter identification and a scene metamer task. This suggests that employing focused versus diffuse attention has minimal impact on the pooling. What happens to the overlap between neighboring pooling regions as they change size? This affects the available information (Chaney et al., Reference Chaney, Fischer and Whitney2014). The lack of details makes it hard to get intuitions. Inattention would degrade central vision, but otherwise its impact remains unclear.
Second, after a year of rethinking attention from the ground up, this theory felt like epicycles. A flexible pooling mechanism with better encoding at attended locations still essentially treats attention as spatial selection, gating the information available to some other mechanism that actually performs the task. This seems likely, yet again, to require additional mechanisms to address, for example, non-spatial selection of task-relevant features. If attention merely gates access to other processes that perform the task, do those latter processes themselves have capacity limits, as suggested by cognitive load effects?
Research into visual attention has long assumed that attention acts as a gate, but our critical phenomena do not obviously provide evidence for such a mechanism. A significant amount of processing appears to happen in parallel, and outside of the nominal task focus. This would seem surprising if the attention gates access to higher-level processing. Yet a working human visual system likely demands such parallelism and imperfect focus. Dual-task and cognitive load phenomena seem to suggest a gradation of available information rather than a gate. Nonetheless, the view of attention as a gate has persisted, even in papers challenging attention theory (Hommel, et al., Reference Hommel, Chapman, Cisek, Neyedli, Song and Welsh2019; Zivony & Eimer, Reference Zivony and Eimer2021). A flexible pooling theory takes a step away from attention as gate, allowing access to some information across the field of view regardless of task relevance. The pooling mechanisms actually change the encoding of the visual information, rather than merely gating access to higher-level processes. Having pondered this step, perhaps we should consider an attention theory without any gate.
3.3. If not a gate, then what?
Without a gate, one must explain why observers do not perceive all available information, and in what way attention mechanisms address limited capacity. Perhaps perception results from doing a task, and tasks have limits. Gate theories suggest that one chooses a location, object, or feature for further processing by some separate part of the visual system. Instead, perhaps one chooses a task. I find it natural to equate selecting a task and setting up the classifier or mechanism to perform that task. Selection and performing a task might be inseparable. Executive functions, rather than choosing what information to gate based on task demands, rewards, and so on, might instead choose what task to perform. The observer asks a question about the visual world – chooses and performs a task. They receive an answer: the percept.
The limit on tasks cannot simply be on the number of simultaneous tasks, nor the number of items processed, as both numbers depend on the specifics of the stimuli and nominal task (e.g. Alvarez & Franconeri, Reference Alvarez and Franconeri2007; Franconeri et al., Reference Franconeri, Alvarez and Cavanagh2013; VanRullen et al., Reference VanRullen, Reddy and Koch2004). Nor can the limit be on overall task difficulty, as dual-task experiments controlled for difficulty in the component tasks by varying display time (e.g. VanRullen et al., Reference VanRullen, Reddy and Koch2004).
3.4. A limit on decision complexity
Perhaps the limit applies to a specific kind of task difficulty. Easy classification tasks look essentially the same in some high-dimensional feature space. The point clouds corresponding to chairs and rabbits will be well separated, and a simple classifier can discriminate between them with a low error rate. Hard tasks, however, can be hard for different reasons. A simple linear classifier might discriminate between a coffee table and a dining room table but overlap between the point clouds might inherently lead to errors. Such a task is data-limited but simple. At the other extreme, one might perfectly distinguish between two classes, but only if one used a complex — e.g., high-dimensional or wiggly — classification boundary. Perhaps humans are limited in the complexity of our decision boundaries.
This would immediately explain the difficulty of many dual tasks relative to their component single tasks. If each single task is two-alternative forced-choice, the dual task must distinguish between four possibilities. The decision boundary will be inherently more complex, and may often encounter limits, leading to poorer performance.
Earlier papers discuss this proposal in more detail (Rosenholtz, Reference Rosenholtz2017; Rosenholtz, Reference Rosenholtz2020). We can currently only speculate about what might be the nature of a limit on decision complexity. It could be the number of dimensions or neurons used to perform a task; the curvature of the decision boundary; or the number of linear hyperplanes needed to approximate the ideal boundary. If optimal task performance exceeded that limit, one would have to simplify the task, leading to errors. More complexity might also require more effort. However, in many cases, for example without time constraints, one could next perform a different task, thus further probing the available information, and eventually piece together a reasonable approximation of the more complex task.
Unlike the flexible pooling proposal, one can make reasonable qualitative guesses about decision complexity even without nailing down the details. Presumably, the visual system has developed to make many natural, ecologically important tasks simple, such as getting the gist of a scene. Hard tasks simultaneously operating on multiple items might be complex, such as following multiple curves, monitoring a complex set of cued items, or using peripheral vision to find a target in visual search. Due to the unusual nature of the peripheral encoding, hard peripheral tasks might often be complex. Gestalt grouping of stimuli might make tasks simpler, and so on.
Are these ideas merely a repackaging of the concept of “late selection”? While selecting a task based on the output of completed sensory processing does indeed sound “late,” the two theories then diverge. In the classic late selection theory (as exemplified by Deutsch & Deutsch, Reference Deutsch and Deutsch1963), processing proceeds until meaning is extracted, at which point the system selects relevant parts for access to short-term memory and awareness. In contrast, in the theory proposed here, meaning comes from choosing the task. Moreover, classic late selection inefficiently identifies all objects only to discard much of this information. Instead, I propose that the visual system efficiently employs sensory processing to create a general-purpose representation, applicable to multiple tasks, from which it can selectively choose.
The concept of task selection aligns with the idea that the visual system resolves competition among potential interpretations of the current visual state, rather than competing sensory data (Krauzlis, Bollimunta, Arcizet, & Wang, Reference Krauzlis, Bollimunta, Arcizet and Wang2014). Additionally, we can relate this to proposals of attention for action. Neumann (Reference Neumann, Heuer and Sanders1987), for instance, emphasizes physical constraints: humans have a maximum of two hands and two legs, and can only express one word at a time. Consequently, the brain faces limits in generating simultaneous action plans; it must choose “what to do and how to do it.” However, the present theory primarily focuses on decision-making limits and tasks with less physical demand
3.5. Thinking about tasks
If perception always results from doing a task, then we need to rethink the nature of tasks. Tasks must not be limited to discriminations between named categories, like “bee” vs. “fly,” because perception is not. Consider a useful back-pocket task, which one might employ when initially free-viewing a scene: getting the gist. The precise nature of this gist has largely eluded vision science. We should ask what task might correspond to getting the gist or getting subjective awareness of a scene. Perhaps the visual system attempts to discriminate the scene from other possible scenes. Getting the gist might equate to approximately localizing the visual input in a high-dimensional representation space. The results of that gist-localization would provide a rich percept that is difficult to describe in words. When first viewing a scene, or getting the gist without performing any other task, the localization might be fairly precise; the observer would know a great deal about the scene (Figure 8A). That knowledge would suggest new tasks to probe the details. A difficult subsequent task, such as a fine-grained judgment of object pose, performed in conjunction with precise gist-localization might exceed the task-complexity limit. The observer would need to resort to less precise localization in the high dimensional space, leading to less understanding of the scene (Figure 8B), and in extreme cases to inattentional blindness. Back-pocket tasks would not be automatic, per se, but would depend upon the complexity of the rest of the task. Shifting the primary task from moment to moment, while continuing to gather whatever gist information one could, given complexity limits, would provide stability of the percept over time. The notion of more precise localization in a higher dimensional space can be thought of as a generalization of the idea of attention leading to more precise spatial location of receptive fields (Section 3.2).
(A) Perhaps the gist of a scene is defined by the scenes the observer can discriminate from that scene (red) as opposed to those confused with it (gray). (B) When judging whether pedestrians are near (green outline) or far (yellow outline), the visual system might still get the gist, discriminating the current scene (gray) from others (red), albeit more coarsely than in (A).

If we choose to equate choosing and performing a task with attention, then all perception requires attention. The observer may be unaware of the visual system’s task, which may often differ from the nominal or conscious task. The observer may simplify a too-complex nominal task. Conversely, the observer may typically do more than the nominal task because of the benefits of perceiving one’s environment and not only the prioritized object. The brain may well be built to make ignoring everything but a single object more complex, requiring more effort. The percept resulting from performing the task might also be unconscious, for example in zombie behaviors.
4. Conclusions and lessons learned
Our reexamination of visual attention was originally motivated by the disruptive question: might supposedly attentional phenomena instead be explained by peripheral vision? Many of the supposed dichotomies necessitated by early selection theory may instead have arisen from easy vs. hard peripheral tasks. Tasks that utilize information readily available in peripheral vision would appear automatic and parallel, whereas tasks for which peripheral vision lacks information would appear serial and effortful. Given a continuum of difficulty for peripheral tasks, one would not expect a strong dichotomy, in agreement with other work calling these dichotomies into question (e.g. Wolfe, Reference Wolfe1998; Anderson, Reference Anderson2011). At minimum, vision scientists need to worry about where the observer fixates, and what information this makes available across the field of view. Because peripheral vision appears to be a critical factor for many phenomena, we also need to worry about the specifics of the stimuli and tasks, which affect peripheral crowding in a complex way.
Rethinking visual attention from the ground up by asking another disruptive question: is there anything one might want to call “attention”? Though I eventually enumerated phenomena that do seem to show additional limits, asking disruptive questions forces one to rethink one’s assumptions. I hope that by elucidating my process of identifying critical phenomena others are inspired to try it themselves if they disagree with my lists. Readers may also want to examine whether their favorite theory can account for these critical phenomena. The third disruptive question asks whether a single limit can explain these phenomena, with a single — possibly complex and flexible — mechanism. I suggest thinking of all perception as resulting from performing a task and propose new ways of thinking about back-pocket tasks like getting the gist of a scene (see also Rosenholtz, Reference Rosenholtz2020). As an initial proposal, there might exist a unifying limit on task complexity. Though much work needs to be done to flesh out and test this proposal, I hope that thinking of capacity limits and “attention” in this quite different way can help move the field forward.
Acknowledgements
Thanks to several generations of lab members for their patience, efforts, and ideas. Thanks most recently to James DiCarlo and Edward Adelson for helping frame this work within the context of philosophy of science, and to Wayne Wu for many useful conversations in preparation for our phiVis conversation at VSS 2023.
Funding statement
Funded by National Science Foundation Grant BCS-1826757.
Competing interests
The author declares none.
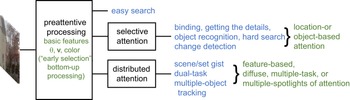
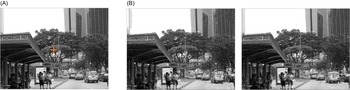

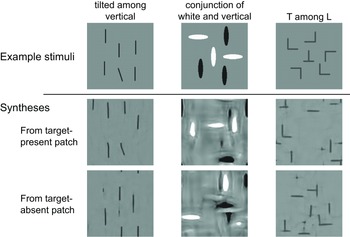
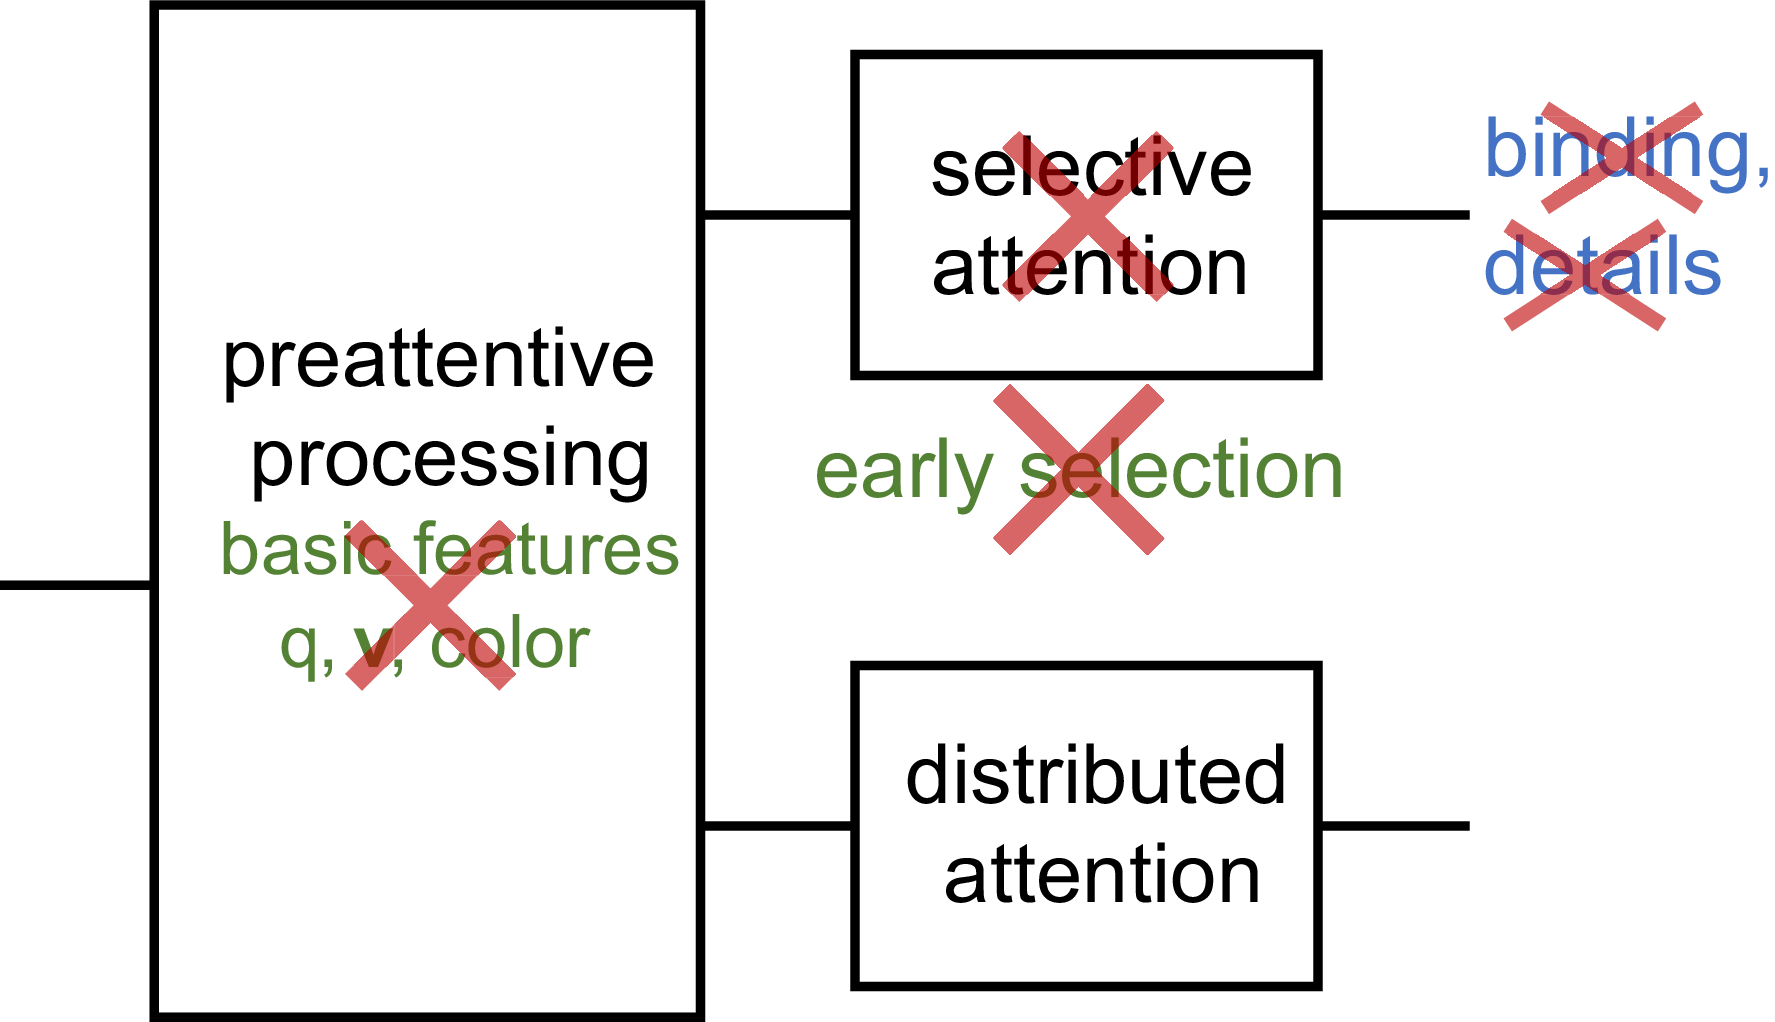
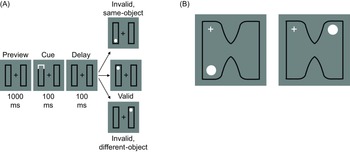
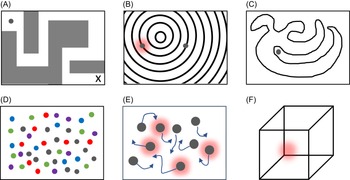




Target article
Visual Attention in Crisis
Related commentaries (30)
(Temporal) Visual Attention NOT in Crisis
40 ms matters
A new algorithm of human attention
Attention and visual search: No crisis here
Attention in evolutionary perspective
Attention is doing just fine! Just don’t take it too seriously
Attention is still a productive framework
Attention, the homunculus, and the Greek theater effect
Banishing “Attention” from the study of temporal attention
Beyond the Blink: How Task Complexity, Temporal Crowding, and Ensemble Perception Reframe the Debate on Attention and Action
Building attention on a firm foundation
Crisis, contextualized: A much broader theoretical shift is needed
Development is a pathway for understanding visual attention and peripheral function
In defense of attention: why perceptual selection cannot be replaced by decision boundaries
Interactions between cortical and subcortical circuits for visual attention
Is allocentric neglect an attentional disorder?
Is attention a theory?
Lossy processing principles in 2D and 3D vision
Low experimental power makes a crisis in visual attention inevitable, but easy to address
Mechanistic disunity as attention in crisis
No crisis when attention is the outcome of selective action
Pay attention to eye movement behavior
Peripheral vision and attention: A longstanding dissociation
Putting effort into task complexity
Seeing attention in inattentional blindness
Spurious crisis versus sustainable science
Starting a revolution with a refuted model?
The (mis)use of the gate metaphor for attention
The interplay between selective attention and summary statistics
Visual attention as an integrated sensorimotor process
Author response
Toward a paradigm shift in visual attention