Over recent decades, human eating habits have undergone significant changes, which have in turn affected public health. Due to complex changes in daily routines and working hours, combined with the advancement of industrialisation of food production, the consumption of ultra-processed, ready-to-eat foods with low nutritional value has steadily risen. This trend has contributed to the growing incidence of various health-related conditions, known as non-communicable chronic diseases (NCDs). According to the World Health Organization (WHO), at least 43 million deaths worldwide in 2021 were associated with NCDs, accounting for 75% of global deaths unrelated to the COVID-19 pandemic (FAO/WHO, 2024). These diseases – including cardiovascular diseases, diabetes, chronic respiratory diseases, and cancer – are influenced by environmental, genetic, behavioural, and physiological factors (FAO/WHO, 2024). To prevent or mitigate these diseases, individuals are encouraged to adopt healthier lifestyles, including increasing physical activity, regular health check-ups, and the more frequent consumption of nutritious foods. Consequently, public interest in minimally processed foods that meet both nutritional and physiological needs – known as functional foods – has grown considerably (Silva and Martins, Reference Silva and Martins2018). To meet this demand, the food industry, in collaboration with the academic community, has invested in research and development of such products.
In addition to the search for healthier foods, another factor that has significantly influenced consumer choice when purchasing food products is the environmental impact of their production. In recent decades, reducing and mitigating the environmental impacts of human activity has gained public attention, prompting many companies to adopt sustainable practices aimed at minimising damage, such as use of recyclable or biodegradable materials, renewable energy sources, and the proper disposal or reuse of waste (Eberle et al., Reference Eberle, Erlo, Milan and Lazzari2019). The food industry has followed this trend, with consumers increasingly favouring organic foods produced with minimal environmental impact, low pesticide use, and enhanced health benefits (Eberle et al., Reference Eberle, Erlo, Milan and Lazzari2019). During food production, however, significant quantities of waste are often generated and discarded, sometimes improperly, creating environmental problems. One notable example is whey, a by-product of cheese manufacturing, which poses a significant environmental risk due to its high nutrient load and biochemical oxygen demand – approximately 100 times greater than that of domestic sewage – that can lead to eutrophication if untreated (Saraiva and Pinto, Reference Saraiva and Pinto2024). Rather than incurring costs to treat and properly discard this waste – which can be considerable for the industry – several studies and research projects have been conducted to assess the potential reuse of these by-products by transforming them into food or incorporating them into the production of food suitable for both animal and human consumption. In the case of whey, for example, its most well-known reuse is in the production of ricotta cheese, which is highly valued for its high concentration of biologically valuable proteins and good digestibility. In addition, other products have been investigated for whey utilisation, such as the development of fermented beverages aimed at promoting the incorporation of probiotic microorganisms and taking advantage of the nutritional properties of whey proteins, including antioxidant and antimicrobial activities, among others (Elkot et al., Reference Elkot, Elmahdy, El-Sawah, Alghamdia, Alhag, Al-Shahari, Al-Farga and Ismail2024). Nevertheless, there is another by-product of the dairy industry that is rarely utilised in Brazil: buttermilk. Obtained from the butter-making process, its composition is similar to that of skimmed milk, except for its phospholipid content, which is about ten times higher (Pereira et al., Reference Pereira, Cardoso, Oliveira, Santos and Pires2024). Owing to its high nutritional value and availability, research into the utilisation of this co-product has been growing, including its incorporation into the production of dairy products, either as an ingredient or base in the formulation of dairy products. Therefore, the objective of this study was to develop a lactose-free fermented dairy beverage using buttermilk as the base, enriched with inulin and whey protein, and to evaluate its physicochemical and microbiological properties in accordance with the standards established by Brazilian legislation for product characterisation.
Materials and methods
Buttermilk
Buttermilk was obtained from Cooperativa Laticínios Macuco (Macuco, RJ, Brazil) after cream churning. It was stored in sanitised 15 L high-density polyethylene containers and transported under refrigeration to the Milk and Dairy Products Laboratory (UFF). Analyses using an Ekomilk M ultrasonic device were conducted to assess fat, solids-not-fat, protein, added water, freezing point, and density, serving as a screening procedure to evaluate buttermilk quality. Calibration was set to the raw milk standard, as the device offers only two options (raw and pasteurised). Cryoscopic analysis (MC 5400) was performed to detect water addition, applying the quality parameters established for skimmed milk due to its compositional similarity to buttermilk. Acidity was determined using a Dornic acidimeter. The product was pasteurised at 80–85°C for 15–20 seconds and cooled to 20°C. Batch pasteurisation was carried out by directly heating approximately 15 L of buttermilk in a stainless-steel tank under continuous agitation to ensure uniform heat distribution and process safety. Temperature was monitored with a dairy-grade thermometer and maintained at ≥ 80 °C (holding time: 15–20 s). Heating was then stopped, and the tank was immediately immersed in an ice bath, with agitation maintained until the buttermilk reached ≤ 20 °C.
Lactose hydrolysis
The enzyme used was β-galactosidase (Chr. Hansen), of microbial origin and produced by a Kluyveromyces lactis strain, with an average activity of 5200 NLU/g. It was added at 0.2% (w/v) and incubated at 4 °C for 12 h to achieve near-complete lactose hydrolysis (≈100%). Hydrolysis was confirmed by cryoscopy after 12 hours of incubation, following the enzymatic kinetics principle described by Ceroni and Vanin (Reference Ceroni and Vanin2021), with minor modifications, and percentage hydrolysis (%GH) was calculated using equation 1:
 \begin{equation}\% GH = 350.877 \times \left( {Cf - Ci} \right)/0.00285\end{equation}
where Cf and Ci are final and initial cryoscopy values, respectively.
Product formulation and fermentation
Hydrolysed buttermilk was divided into four 2 L beakers corresponding to the treatments: T1 (control), T2 (7% inulin), T3 (12.5% whey protein), and T4 (7% inulin + 12.5% whey protein). After homogenisation using a mechanical stirrer, a YoFlex® starter culture (Streptococcus thermophilus and Lactobacillus bulgaricus) was added.Table 1 presents the distribution of the four experimental treatments.
Experimental treatments for the production of fermented dairy beverage based on buttermilk with the addition of inulin and whey protein

All treatments were incubated at 42°C ± 2°C until T1 reached pH 4.7, monitored at one-hour intervals. The target pH was achieved after approximately 5.5 h of fermentation, after which all samples were refrigerated at 4 °C.
Physicochemical analysis
Physicochemical analyses included the determination of pH, titratable acidity, and syneresis, measured on days 1, 9, 18, 27, and 36, following Brazilian regulatory standards (Instrução Normativa n° 30, of June 26, 2018).
Rheological analysis
Rheological analysis followed the protocol described in the work of Morais and collaborators (Morais et al., Reference Morais, Camargo, Colombo and Fortulan2023) with some modifications. Samples were tested at 25 ± 1 °C using a Brookfield DV3TRV rheometer equipped with a Small Sample Adapter (SC4) and SC4-21 spindle (concentric-cylinder type). Ten millilitres of sample were placed into the chamber. Shear stress and viscosity were recorded during a programmed increase-decrease spindle rotation from 0 to 250 rotations per minute (rpm) at a speed of 2 rpm/s. The spindle rotation in rpm was automatically transformed into shear rate (s−1 = reciprocal seconds) based on the spindle geometry. Three flow curves were generated in the process following an up–down–up sequence; the third was selected for analysis to eliminate the thixotropic effect of the fluid and fitted to the power-law model law of fluids (equation 2)
 \begin{align}\sigma = k \cdot \gamma\^{}{n}\end{align}
where:
k = consistency index (mPa · sⁿ); n = flow behaviour index (dimensionless); σ = shear stress (mPa); and γ = shear rate (s−1).
Microbiological analysis
Microbial enumeration was performed using standard plate counts (APHA, 2015). Ten grams of sample were diluted in 0.1% peptone water and serially diluted to 10−5. Plating was performed in duplicate using MRS agar and the pour plate technique. Plates were incubated anaerobically at 42 ±1°C for 72 ± 3 h. Plates with 20–200 colonies were selected for counting; one was used for Gram staining and catalase test.
Microbial viability and activity was assessed by inoculating 1 mL of sample into a test tube containing 9 mL of sterile milk prepared in the laboratory (skimmed milk powder reconstituted to 10% w/v and sterilised by flowing steam autoclaving for 15 min). After cooling, inoculation was performed to prevent thermal inactivation. Tubes were incubated at 42 °C for 24 h, and microbial activity was confirmed by protein coagulation, pH reduction, and increased titratable acidity.
Smear preparation and Gram staining were also performed on the sterile milk samples, as well as the catalase test.
Protein content
Protein content was determined using a modified Kjeldahl method. Two grams of each sample were digested with copper/sodium sulphate (catalytic mixture) and 10 ml of sulphuric acid (96%). Distillation was performed using NaOH (60%), boric acid (4%) with mixed indicators (methyl red and bromocresol green). Titration was performed using 0.1 N HCl.
Statistical analysis
All analyses were performed in triplicate. Data were subjected to ANOVA and Tukey's HSD test at 5% significance (p < 0.05). Two-way ANOVA was applied for pH, acidity, rheology, LAB count, and protein content to assess storage time and treatment effects. No significant interaction was observed (p > 0.05). Syneresis data were analysed by one-way ANOVA.
Results
Lactose hydrolysis
The lactose hydrolysis rate reached approximately 95% in all three experimental replicates, meeting the standards established by RDC No. 135/2017 (Brasil. Agência Nacional de Vigilância Sanitária, 2017). According to this regulation, a product may be labelled as “lactose-free” only if it contains no more than 100 mg of lactose per 100 g or 100 ml of product.
Physicochemical analysis
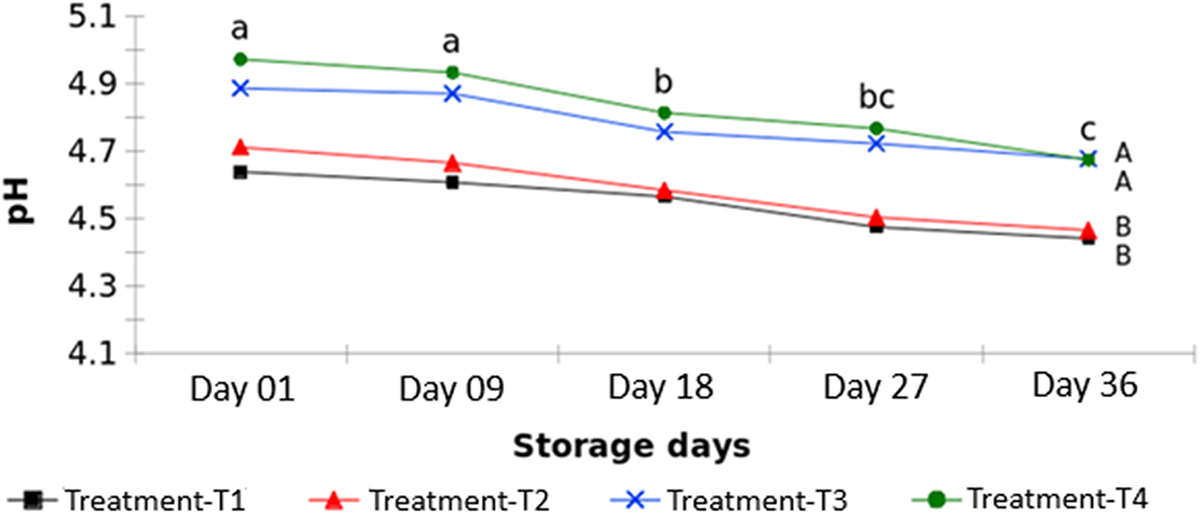
The pH decreased progressively during storage, following a similar pattern across all four treatments, as presented in Table 2.
Comparison of pH values for each treatment during 36 days of storage. Different lowercase letters (a, b, c) indicate significant differences (p < 0.05) among daily means over the analysed period. Different uppercase letters (A, B) indicate significant differences (p < 0.05) among treatments

Titratable acidity showed no significant variation throughout the storage period, increasing at comparable rates among treatments, as shown in Table 3.
Titratable acidity (% lactic acid) of the four treatments over 36 days of storage. Different lowercase letters (a, b, c, d) indicate significant differences (p < 0.05) among daily means over the analysed period. Different uppercase letters (A, B, C, D) indicate significant differences (p < 0.05) among treatments

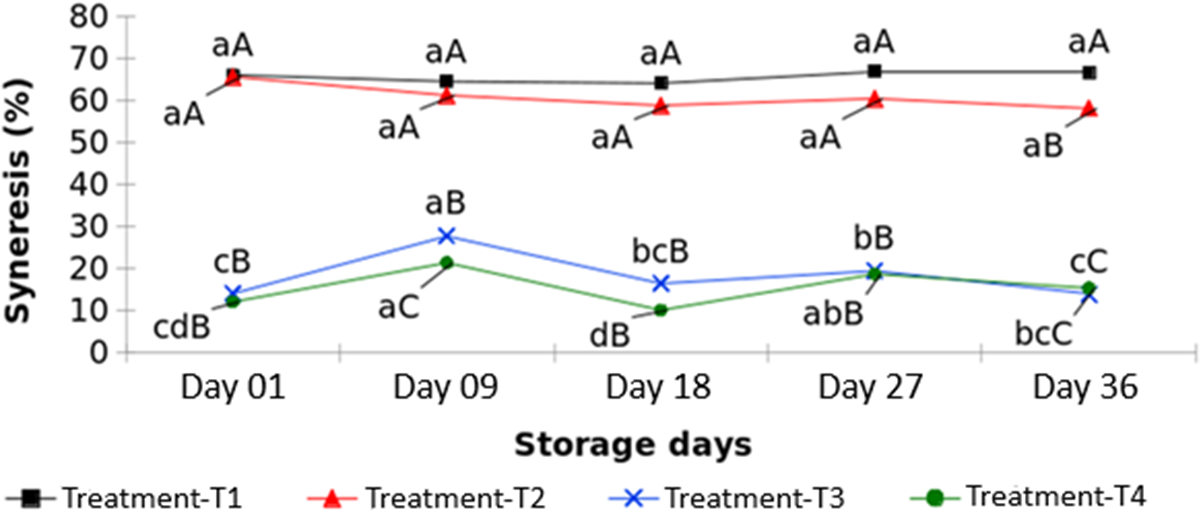
Syneresis analysis revealed a significant interaction between treatment and storage time; therefore, statistical analyses for these factors were performed separately. Treatment T1 showed the highest whey release, reaching values close to 70%, whereas T4 exhibited the lowest syneresis, as shown in Table 4.
Syneresis (%) of the 4 experimental treatments over 36 days of storage. Different lowercase letters (a, b, c, d) indicate significant differences (p < 0.05) among daily means over the analysed period. Different uppercase letters (A, B, C) indicate significant differences (p < 0.05) among treatments

Rheological analysis
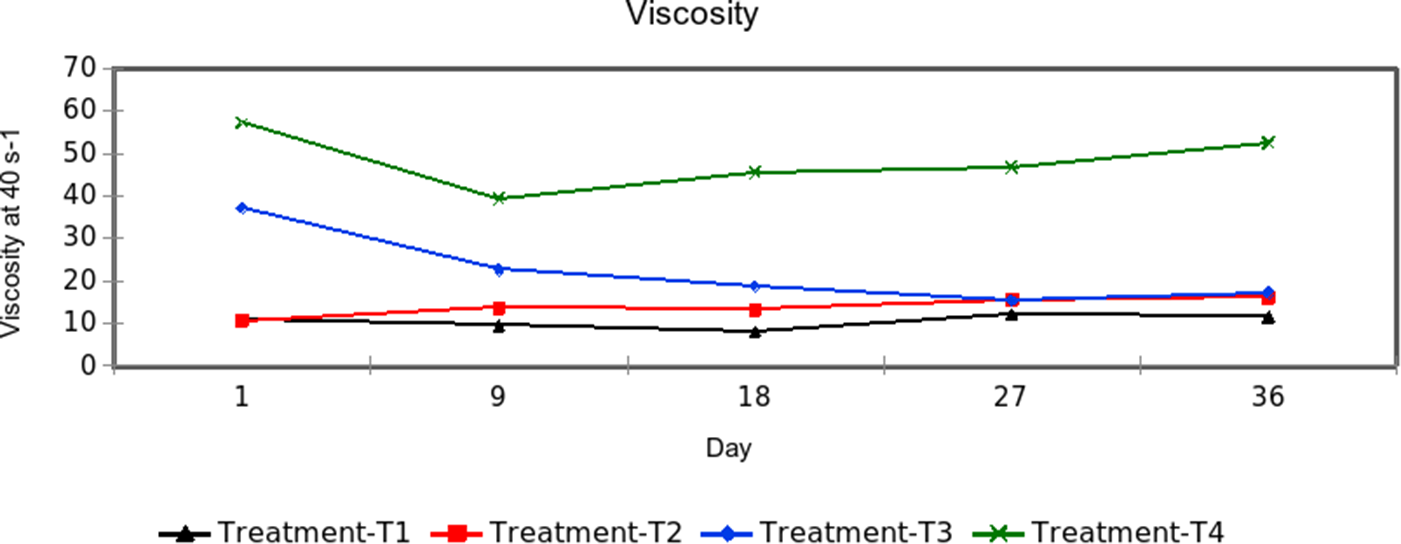
The rheological parameters of the four experimental treatments are presented in Table 5. Treatment T1 was the only sample in which viscosity did not vary significantly during storage, while T3 and T4 exhibited the greatest variation across analysis days.
Rheological parameters of the 4 experimental treatments. Different lowercase letters between treatments for each parameter (column) and within the storage days indicate significant differences (p < 0.05). Different uppercase letters between different storage days, but within the same treatment (rows), for each parameter, indicate significant differences (p < 0.05)

Microbiological analysis
Microbial counts were determined during the 36-day storage period, and the results are presented in Table 6.
Lactic acid bacteria count (Log CFU/g) of the 4 experimental treatments over 36 days of storage. Different lowercase letters (a, b) indicate significant differences (p < 0.05) among daily means over the analysed period. Means with the same uppercase letters in the same column indicate no significant difference

Protein analysis
The protein content of the four treatments was measured over the 36 days of analysis to assess any potential changes. No significant variation was observed between the analysed days within the same treatment, indicating that there was no deterioration of the added protein or the protein already present in the buttermilk. The results are shown in Table 7.
Total Protein Content (%) analysed in the 4 experimental treatments over 36 days of storage. Different lowercase letters (a, b) indicate significant differences (p < 0.05) among daily means over the analysed period. Different uppercase letters (A, B) indicate significant differences (p < 0.05) among treatments

Discussion
During storage, the samples underwent notable physical and biochemical changes, resulting from the complex interactions among microorganisms, the dairy matrix, and the added components (inulin and whey protein).
Physicochemical aspects
Treatments T3 and T4 exhibited higher initial and final pH values due to the addition of whey protein in the formulation, which exerted a buffering effect, increasing the initial pH of the solution. In a study conducted by Moineau-Jean et al. (Reference Moineau-Jean, Champagne, Roy, Raymond and LaPointe2019), it was reported that high-protein dairy products possess a buffering capacity that helps stabilize pH in fermented products, supporting microbial viability when compared to traditional yoghurts. Amino acids act as biological buffers by capturing the H+ ions released during the fermentation process of lactic acid bacteria, thereby regulating the acidic pH produced. However, this did not affect the rate of pH decline during the storage period, as shown in Figure 1.
Decrease in pH over 36 days across the four treatments. Different lowercase letters indicate significant differences (p < 0.05) among storage days. Different uppercase letters indicate significant differences (p < 0.05) among treatments.

The pH reduction observed during the storage period is related to the phenomenon of post-acidification, which commonly occurs in fermented dairy products. This process takes place as lactic acid bacteria continue to produce metabolites even under refrigeration (Silva et al., Reference Paula, Boccia, Sobral, Costa, Moreira, Paiva and Teodoro2021). The addition of inulin (T2 and T4) did not significantly influence the pH reduction, similar to the findings of Lucena (Reference Lucena2019), who evaluated the pH of sheep milk fermented with different fibres and observed no significant difference between the inulin-supplemented milk and the control treatment.
As with pH, titratable acidity also undergoes changes during the storage period due to post-acidification. The continued metabolic activity of microorganisms leads to the production of lactic acid, which increases the titratable acidity of the fermented dairy beverage. Treatments T1 and T2 showed similar values, indicating the minimal influence of inulin on this parameter, as was also observed in the case of pH. In contrast, treatments T3 and T4 exhibited significantly higher values when compared to T1 and T2, primarily due to the addition of whey protein.
Inulin contributed to lower acidification in treatment T2 and resulted in the smallest variation in acidity between day 1 and day 36. Balthazar et al. (Reference Balthazar, Conte Júnior, Moraes, Costa, Raices, Franco, Cruz and Silva2016) conducted a study evaluating the physicochemical changes caused by the addition of different concentrations of inulin in yoghurt and found that when 6% of this fibre was added, titratable acidity was lower than in the control treatment. This reduction in acidity may be considered a positive factor in the sensory evaluation of fermented dairy products, as consumers tend to reject products with a strong acidic taste (Balthazar et al., Reference Balthazar, Conte Júnior, Moraes, Costa, Raices, Franco, Cruz and Silva2016). Nevertheless, no sensory evaluation of the experimental product was undertaken in the present study. It is therefore recommended that such an assessment be conducted in future investigations to determine consumer preference for this dairy beverage.
In the case of syneresis, the difference in the whey release content is related to the solids concentration in each treatment, with T1 having the lowest and T4 the highest, which directly affects the water-holding capacity of the formed curd, as shown in Figure 2.
Variation in syneresis over 36 days of storage across the four treatments. Different lowercase letters indicate significant differences (p < 0.05) among storage days. Different uppercase letters indicate significant differences (p < 0.05) among treatments.

In a study conducted by Canella (Reference Canella2016), it was shown that the addition of inulin to fermented milk, even at the minimum level of 6% required by Brazilian legislation, can positively influence the product's syneresis, as it increases the total solids content and consequently reduces the whey release.
According to Damodaran (Reference Damodaran and Damodaran2017), during the curd formation process, proteins are capable of retaining large amounts of water, with retention rates reaching up to 98% in some cases. The retention rate varies depending on several intrinsic factors, such as the types and concentrations of proteins involved, as well as the size and charge of the protein network formed. Extrinsic factors such as pH, temperature, and the ionic strength of molecules also influence the water-holding capacity.
Rheological behaviour
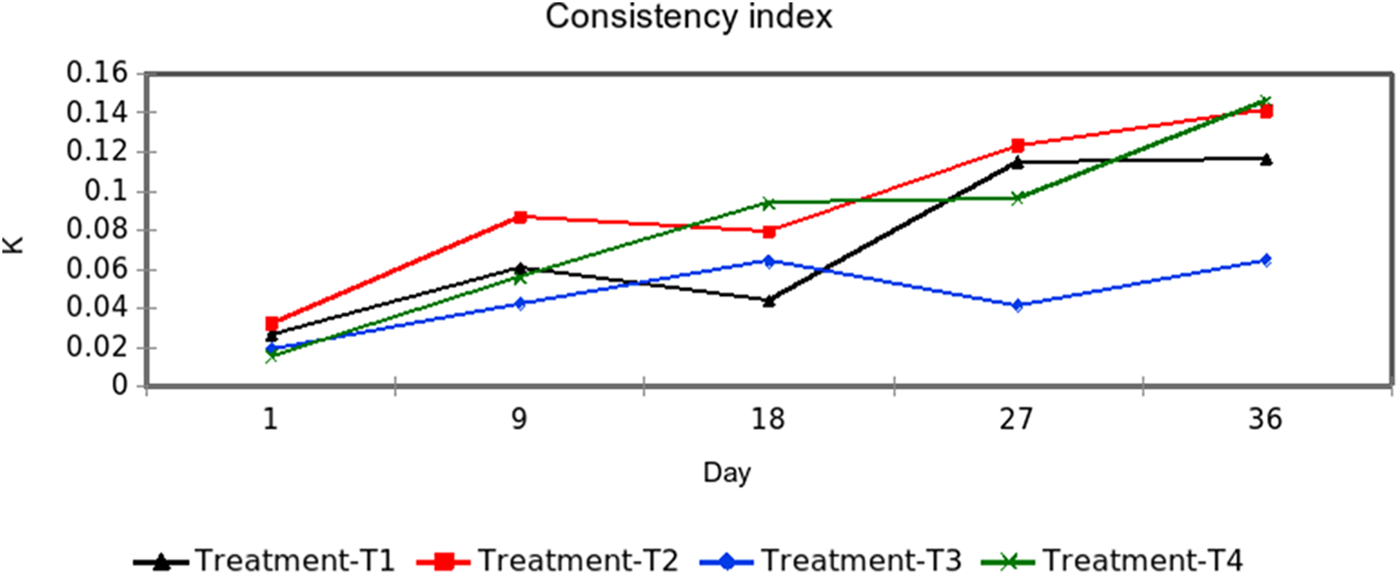
In terms of rheology, treatments T1 and T2 showed little variation in viscosity, demonstrating the product's stability over the storage period. Similar results were found by Paula et al. (Reference Paula, Boccia, Sobral, Costa, Moreira, Paiva and Teodoro2020), where a carbonated ricotta whey-based dairy beverage was produced, and there was also little variation in the viscosity of the product during storage. Although there is little variation, a slight difference can be observed between the viscosity results of T1 and T2, which can be explained by the presence of inulin in the formulation. Silva (Reference Silva2015) conducted a study with a dairy beverage supplemented with fruit pulp, and due to the presence of inulin in the pulp, it was found that this fibre influenced the rheological profile of the beverages. In all four treatments, a gradual increase in the constant k, indicating the product's consistency, was observed, as shown in Figure 3.
Variation in consistency index over 36 days of storage across the four treatments.

Similar results were found by Barukčić et al. (Reference Barukčić, Filipan, Lisak Jakopović, Božanić, Blažić and Repajić2022) in a study that evaluated the effects of adding olive leaf extract to yogurt. This change may be related to greater hydration of macromolecules, which could increase the three-dimensional network of the dairy beverage, as well as the generation of new metabolites and peptides due to the continuous growth of LAB, even under refrigeration (Naibaho et al., Reference Naibaho, Butula, Jonuzi, Korzeniowska, Laaksonen, Föste, Kütt and Yang2022).
Treatment T3 showed a significant decline in viscosity over the 36 days, as shown in Figure 4, despite having a higher solid content compared to the control treatment.
Variation in viscosity over 36 days of storage across the four treatments.

This decline can be explained by the interaction of the phospholipids from the milk fat globule membrane (MFGM) present in the buttermilk with whey protein. In a study by Zhao et al. (Reference Zhao, Feng and Mao2020), where the rheological effects of adding different concentrations of buttermilk to yogurt were evaluated, small additions of buttermilk increased the viscosity of the product, while higher additions caused a decline. The likely cause of this effect is the amphiphilic interaction between phospholipids and proteins, mainly whey proteins, which when present in excess in a product, can lead to viscosity loss rather than an increase.
Regarding the rheological behaviour of the treatments, it was observed that throughout most of the experimental period, all four treatments exhibited characteristics of a pseudoplastic non-Newtonian fluid (n < 1). However, on the first day post-fermentation, the treatments with added whey protein displayed the rheological characteristics of a dilatant fluid (n > 1), as shown in Figure 5, which could be due to a possible saturation of the solution with the addition of the protein concentrate.
Variation in flow behaviour of each treatment on each analysed day.

Nevertheless, with the gradual increase in pH and continued refrigeration storage, the solution's stability tends to decline due to the loss of the casein gel strength in the fermented product (Pang et al., Reference Pang, Xu, Luo, Che, Bansal and Liu2019), which led the saturated protein solutions to exhibit pseudoplastic behaviour as well. However, further studies are needed to effectively confirm this effect.
Lactic acid bacteria count
In the enumeration of lactic acid bacteria, no significant differences were observed between the treatments or throughout the storage period of the product, indicating minimal influence – either positive or negative – of the addition of dietary fibre or protein concentrate on microbial growth. In all treatments, the product achieved the minimum count required by Brazilian legislation of 10⁶ CFU/g to be classified as a fermented dairy beverage (BRASIL, 2024).
Júnior et al. (Reference Júnior, Freitas, Martins, Benevenuto, Gonçalves and Martins2018) conducted a study evaluating the lactic bacteria count in kefir and reported a similar pattern in microorganism viability over storage time. The microorganisms exhibited growth from day one until day 14, and when assessed after day 28, a decline was noted; however, the counts remained above the minimum threshold established by Brazilian regulations. A study by Akalin, Fenderya, and Akbulut (Reference Akalin, Fenderya and Akbulut2004) demonstrated that various factors, such as pH, acidity, levels of lactic and acetic acids, and storage temperature, among others, may influence the viability and survival of microorganisms present in fermented dairy products. Therefore, the decline in microorganism concentration observed in the present study may be attributed to the gradual increase in pH and titratable acidity identified during analysis.
Protein content
The results from the treatments with added whey protein (T3 and T4) were satisfactory with respect to the initial objective of the experiment, which aimed for the final formulation of the product to achieve a minimum protein concentration of 10% in these cases. Similar values were found in an experiment conducted by Coutinho et al. (Reference Coutinho, Pereira, Fernandes, Zambaldi and Fonseca2021), which evaluated the development of a probiotic dairy beverage intended to be classified as a “source of protein”. In a study carried out by Pinheiro (Reference Pinheiro2024), it was noted that high-protein products commonly found on the market often display their protein content in grams; however, when evaluating the total content of the packaging, it becomes evident that the actual protein concentration does not exceed 10% of the product's composition. Accordingly, the experimental product was able to reach values comparable to those commonly found in commercially available products. According to Brazilian legislation, as outlined in Resolution nº 54/2012 (ANVISA, 2012), for a food product to be considered a source of protein, it must contain a minimum of 6 g of protein per 100 g or 100 ml per serving, that is, a minimum content of 6%. Thus, the experimental product met the legal requirements to be classified as a “source of protein” under Brazilian standards.
Conclusion
The use of buttermilk as a base for the production of a fermented dairy beverage proved promising, as satisfactory physicochemical and microbiological results were obtained, similar to those found in milk-based beverages and within the parameters established by Brazilian legislation.
Inulin had little influence on the parameters analysed, indicating that this prebiotic can be added to dairy products without altering the quality of traditional products while ensuring functional ingredients for the consumer. On the other hand, the addition of whey protein significantly influenced almost all parameters of the beverage, except for microbiology, which showed similar results across all four treatments. However, the changes remained within the expected range and were satisfactory, particularly the protein content of 10% and the reduction in product syneresis.
Future research should include sensory analyses to identify potential improvements in the formulation, assess consumer acceptance, and examine the nutritional composition. Additionally, studies on consumer preferences would help determine how such beverages can meet growing market demands and enhance their commercial potential. Furthermore, more precise methods, such as HPLC or enzymatic assays, are recommended to assess lactose hydrolysis efficiency. Although cryoscopy and enzyme kinetics can provide preliminary estimates of hydrolysis, they are not considered standard methods. More robust methods like HPLC are advised to ensure reliable results, particularly for products intended for individuals with dietary restrictions, including those with lactose intolerance.
Acknowledgements
The author gratefully acknowledges the support provided by the professors and technical staff of Fluminense Federal University during the execution of this experiment. Appreciation is also extended to the Coordenação de Aperfeiçoamento de Pessoal de Nível Superior (CAPES) for their institutional support.