Introduction
Instrumented indentation allows the measurement of the mechanical properties of a material by means of applying controlled deformation using a specified indenter tip geometry. The classical indentation hardness tests, e.g., Brinell or Vickers, allowed the measurement of hardness by determining the contact area after the test performed at a set load [Reference Tabor1, Reference Fischer-Cripps2]. This is straightforward to measure at the micro-millimeter scale, but at smaller scales, optical measurements lack the required precision. To allow indentation measurements at smaller scales, instrumented nanoindentation devices were developed. Nanoindentation is now commonly used to measure the mechanical properties of materials and thin films at the nanometer scale. The main difference between instrumented indentation and classical Vickers and Brinell tests is that the contact area is not measured ex situ after the test. Instead, the contact area is directly inferred from load and displacement measurements made during the indentation. This nondestructive technique allows the measurement of both the hardness and the elastic modulus of a material using the following equations [Reference Tabor3, Reference Oliver and Pharr4, Reference Bulychev, Alekhin, Shorshorov, Ternovskii and Shnyrev5, Reference Pharr, Oliver and Brotzen6, Reference Sneddon7]:
 $$H = {P \over {{A_{\rm{c}}}}}\quad ,$$
 $$E = \left( {1 - {\upsilon ^2}} \right){\left( {{1 \over {E_{\rm{c}}^ * }} - {{1 - \nu _i^2} \over {{E_i}}}} \right)^{ - 1}}\quad ,$$
 $$E_{\rm{c}}^* = {S \over {2\beta }}\sqrt {{\pi \over {{A_{\rm{c}}}}}} \quad ,$$
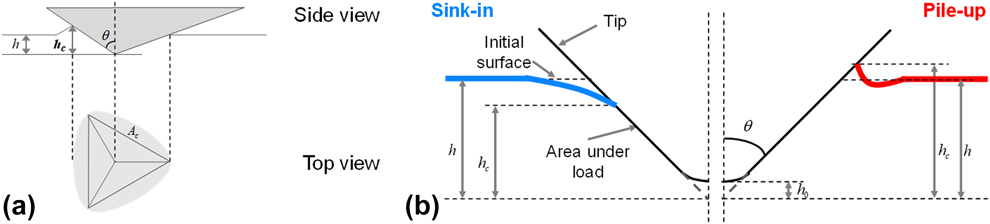
where H is the hardness and E is the Young’s modulus of the material. In these equations, P is the load applied,  $E_{\rm{c}}^ *$ is the reduced contact modulus, ν and νi are the Poisson’s ratio of the sample and the indenter tip, respectively, E i is the Young’s modulus of the indenter tip, β is a constant to account for an indenter tip without axial symmetry [Reference King8, Reference Oliver and Pharr9], and A c is the projected contact area. The mechanical properties can be determined by a monotonic unloading method, i.e., they are obtained from the unloading stiffness from the maximum load [Reference Oliver and Pharr4, Reference Loubet, Georges, Meille, Blau and Lawn10]. An alternative method, known as the continuous stiffness measurement (CSM) method, superimposes a small, oscillating load onto the loading curve to determine the mechanical properties continuously at many intermediate depths as well as at the maximum indentation depth [Reference Asif, Wahl and Colton11]. In Eqs. (1)–(3), all parameters are known or measured except the projected contact area. For a perfect pyramidal tip [Fig. 1(a)], the contact area is related to the contact depth h c by the following equation:
 $${A_{\rm{c}}} = 3\sqrt 3 {\left( {\tan \left( \theta \right){h_{\rm{c}}}} \right)^2}\quad ,$$
where θ is the angle between the face and the vertical axis of the tip. In reality, the indenter tip geometry deviates from this ideal case, and a tip area function is used to take into account deviations from the ideal geometry near the tip apex [Reference Oliver and Pharr9].
(a) Schematic illustration of the geometrical relation between the projected contact area and the indenter tip. (b) Schematic detailing the link between the pile-up/sink-in and the tip displacement.
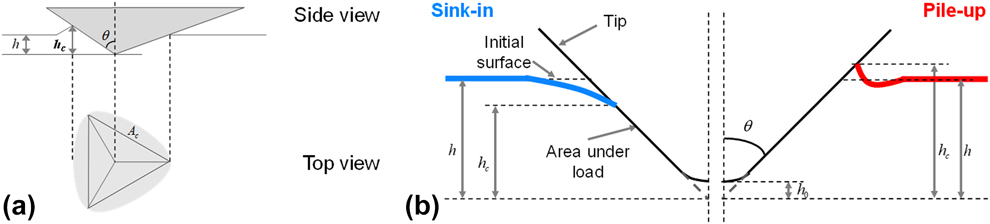
Like the projected contact area, the contact depth is not directly measured during a nanoindentation test. Only the indenter’s displacement is directly measured. The determination of contact depth is not straightforward because it has to take into account the pile-up or sink-in of the material around the tip (Fig. 1) to accurately describe the true contact. To estimate h c using the measured parameters, several models have been developed. The most commonly used of these is the model developed by Oliver and Pharr [Reference Oliver and Pharr9]. Based on the work of Sneddon, who calculated the elastic load and displacement of a flat punch, Oliver, and Pharr determined the contact depth with the following equation [Reference Sneddon7]:
 $${h_{\rm{c}}} = h - \varepsilon {P \over S}\quad ,$$
where ε is a coefficient dependent on the indenter geometry (ε = 0.75 for a pyramidal tip). This model considers very precisely the elastic sink-in of the material around the tip. However, as shown by Eq. (5), the contact depth cannot be higher than the indentation depth. Hence, this equation can underestimate the contact area due to pile-up of the material around the indenter. The resulting error in the contact depth calculation can reach as much as 60%, depending on the sample material. Bolshakov et al. [Reference Bolshakov, Oliver and Pharr12, Reference Bolshakov and Pharr13] explained that the Oliver and Pharr method (O–P) accurately measures A c only if the ratio h f/h max is lower than 0.7, where h f is the remaining depth of the indent after unloading. For a ratio lower than 0.7, the corresponding material exhibits high work hardening and a high H/E ratio, leading to negligible pile-up. For h f/h max greater than 0.7, the material displays both low work hardening and a low H/E ratio resulting in pile-up during indentation.
Loubet et al. [Reference Loubet, Bauer, Tonck, Bec and Gauthier-Manuel14, Reference Hochstetter, Jimenez and Loubet15] proposed a different model to calculate the contact depth and account for pile-up using the following equation:
 $${h_{\rm{c}}} = \alpha \left( {h - {P \over S} + {h_0}} \right)\quad ,$$
where α is a constant depending on the indenter geometry (α = 1.200 for a Berkovich tip, α = 1.067 for a cube-corner tip [Reference Guillonneau16]), and h 0 is a constant for taking into account of the nonperfect geometry of the tip (see Fig. 1, more details for h 0 determination can be found in Ref. Reference Loubet, Georges, Meille, Blau and Lawn10). The coefficient α has been both experimentally determined by atomic force microscopy (AFM) measurements on residual indentations in different materials and theoretically validated by finite element simulations [Reference Guillonneau16, Reference Bec, Tonck, Georges, Georges and Loubet17]. Because α is higher than 1, h c can be higher than h, which means that both pile-up and sink-in can be estimated with the Loubet et al. model. It correctly estimates the contact depth for a large range of materials, but the Loubet model encounters some difficulties with materials with high strain-hardening exponent.
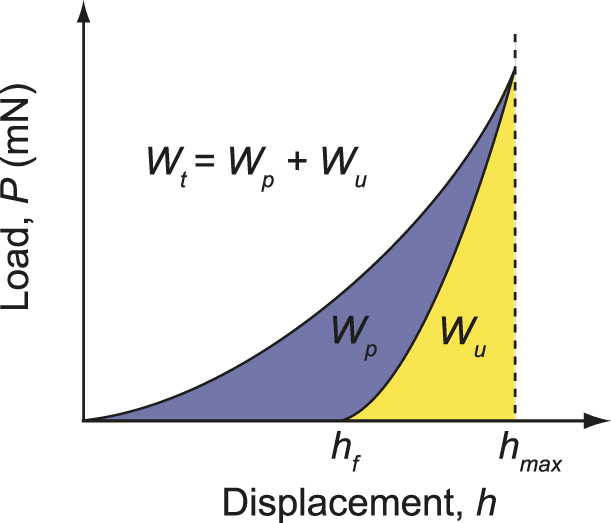
The projected contact area can be calculated using the work of indentation. This is done by integrating the area between the loading and unloading curves as depicted in Fig. 2. This can also be calculated using the following equation [Reference Stilwell and Tabor18, Reference Tuck, Korsunsky, Bull and Davidson19]:
 $${A_{\rm{c}}} = {{9W_{{\rm{p,t}}}^2} \over {kP_{\max }^2}}\quad ,$$
where k is a constant dependent on the tip geometry (k = 0.0408 for a Berkovich tip, k = 0.3850 for a Cube-corner tip), W t is the total work, and W p is the plastic work.
Indentation load–displacement curve for an elastoplastic material, showing the areas under loading and unloading curves and the corresponding work of indentation (elastic, plastic, and total work).

The projected contact area estimated with this method is generally in very good agreement with the Oliver and Pharr model, but, as shown by Cabbibo et al., it also has difficulties precisely determining A c for indentations on samples which display pile-up [Reference Cabibbo and Ricci20].
All of these methods are considered to be direct methods, meaning that the contact area is estimated directly from the indentation curve. Postmortem methods can also be used, in which the imprint is measured after the test using a form of microscopy. For example, A c can be estimated using scanning electron microscopy (SEM) or scanning probe microscopy (SPM) measurements [Reference McElhaney, Vlassak and Nix21, Reference Charleux, Keryvin, Nivard, Guin, Sanglebœuf and Yokoyama22, Reference Howell, Hellmann and Muhlstein23, Reference Kempf, Göken and Vehoff24]. A list of publications pertaining to postmortem contact area measurements is summarized in Ref. Reference Cabibbo and Ricci20. Finally, let us note that numerical simulations were also used to estimate the true projected contact area [Reference Bolshakov and Pharr13, Reference Volz, Schwaiger, Wang and Weygand25].
All the methods discussed above were developed because it was not possible to observe the imprint directly during indentation at the nanoscale. Moreover, the models discussed can estimate the projected contact area, but they can only accurately estimate it for a certain range of materials. Furthermore, they could not be compared directly to the true contact area under load. However, recently several in situ nanoindenters have been developed with suitably small dimensions to be installed inside SEMs. Using an in situ nanoindenter, the material deformation at the microscale or nanoscale can be observed directly. This has allowed direct correlations to be achieved with phenomena observed in the load–displacement curve during testing: pop-ins [Reference Göken, Sakidja, Nix and Perepezko26, Reference ur Rehman, Durst, Neumeier, Parsa, Kostka, Eggeler and Göken27] and crack nucleation/growth [Reference Rabe, Breguet, Schwaller, Stauss, Haug, Patscheider and Michler28]. Some shear band formation phenomena, which are not always visible in the P–h curve [Reference Moser, Kuebler, Meinhard, Muster and Michler29, Reference Moser, Löffler and Michler30], can be observed with in situ SEM imaging. In situ imaging also allows high resolution viewing of the sample surface which permits the indentation location to be very precisely selected; enabling the indentation of very small structures like nanotubes [Reference Maschmann, Zhang, Wheeler, Du, Dai and Baur31]. A list of publications of in situ indentation studies can be found in [Reference Nili, Kalantar-zadeh, Bhaskaran and Sriram32, Reference Legros, Gianola and Motz33]. Finally, in situ imaging of the indentation can allow direct measurement of contact area during loading in the SEM. This allows the in situ projected contact area to be measured and compared to the contact area determined with classical models.
In this article, a simple method to determine the true projected contact area by in situ indentation testing is demonstrated. It consists of imaging the contact area by SEM measurements and quantifying pile-up or sink-in phenomena. In the first part of the article, the instrument and samples tested are described. The results are then presented and discussed in comparison with contact mechanics analysis methods for indentation. The method to calculate the in situ contact area using SEM measurements is presented at the end of the manuscript.
Results
Indentations with cube-corner tip
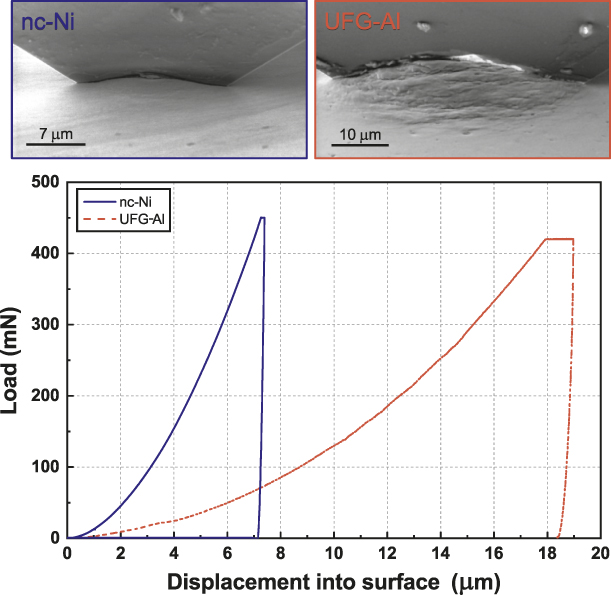
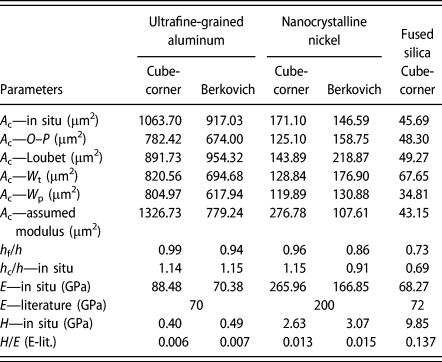
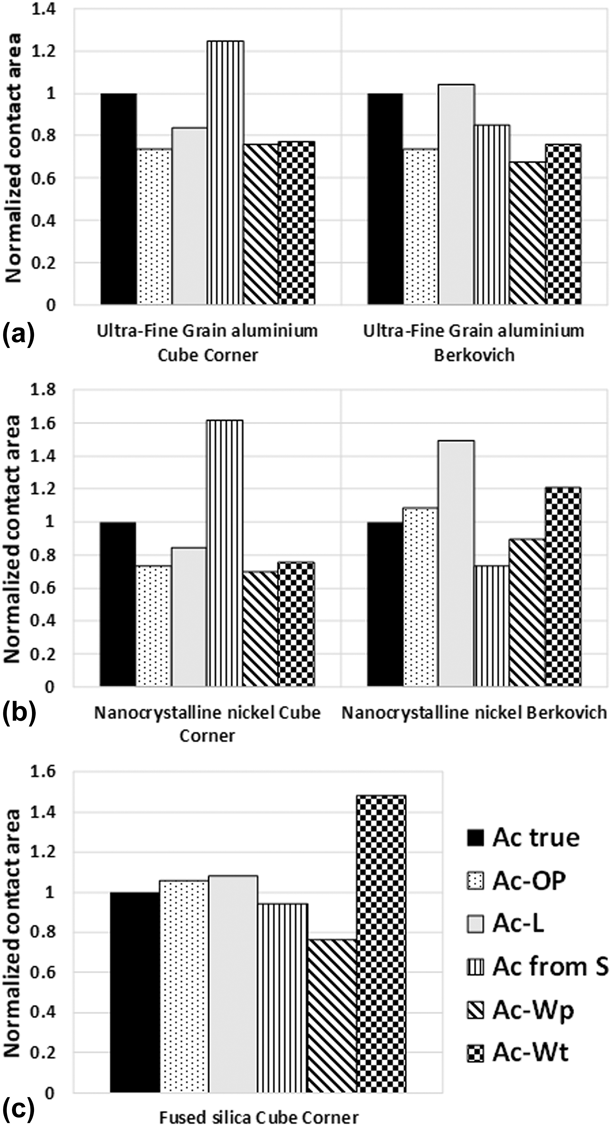
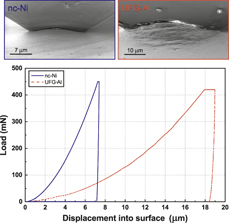
Figure 3 presents the load–displacement curves obtained on UFG-Al and nc-Ni alongside the images collected at the point of maximum load. Significant pile-up is visible in each sample, permitting precise calculation of the in situ projected contact area. One can also observe that the unloading curve is almost vertical for the two samples, suggesting the samples both exhibit nearly perfectly plastic behavior. This is confirmed by the h f/h max ratio recorded in Table I, which is close to unity for both samples. Table I also includes a list of the projected contact areas measured with all of the different methods. A comparison of the contact areas calculated with all models is also presented in Fig. 6 as bar chart. It can be seen in Table I and Fig. 6 that the contact area obtained via in situ measurements on UFG-Al and nc-Ni is underestimated by every model. It is not surprising that the O–P model underestimates the contact area in these cases, because it is only intended to account for sink-in [Reference Kempf, Göken and Vehoff24, Reference Göken, Sakidja, Nix and Perepezko26]. The error is less significant using the work of indentation method than with the O–P models, which is consistent with literature results on samples exhibiting pile-up [Reference Cabibbo and Ricci20]. The contact area obtained with the Loubet et al. model is closest to the in situ contact area. However, with an observed 16% difference between in situ and calculated contact areas, the error is still significant.
Load–displacement curves obtained on nc-Ni and UFG-Al with a cube-corner tip and accompanying SE micrographs showing the indentations at maximum load.

Comparison of the projected contact area measured by the in situ method and A c obtained with classical models. Mechanical properties measured from the in situ contact area are listed for comparison. Literature modulus can be found in Refs. Reference Oliver and Pharr4 and Reference Maier, Durst, Mueller, Backes, Höppel and Göken42.

One point worthy of mention is the highly reduced elastic modulus calculated with the in situ method. Normally, the values should be similar to the reduced modulus obtained by testing with a Berkovich tip (Table I). The reason for this error might be found in the very low elastic recovery on unloading, which makes it difficult to measure precisely the contact stiffness using the Oliver and Pharr method. As shown on Fig. 3, the unloading curve is almost vertical, leading to a lower precision fit of the unloading curve. Another reason for the error could arise from the friction between the cube-corner tip and the samples. At high indenter aspect ratios (small included angles), the contact friction is not negligible, and can modify the mean contact pressure, for an elastic or a plastic contact [Reference Spence38, Reference Bucaille, Stauss, Felder and Michler39, Reference Grunzweig, Longman and Petch40, Reference Chitkara and Butt41]. This can influence the contact stiffness as expressed by the Sneddon equation, causing the overestimation of the reduced elastic modulus. Consequently, the friction could also affect the contact area calculation with the models of Loubet et al. and Oliver and Pharr and with the method using the literature modulus.
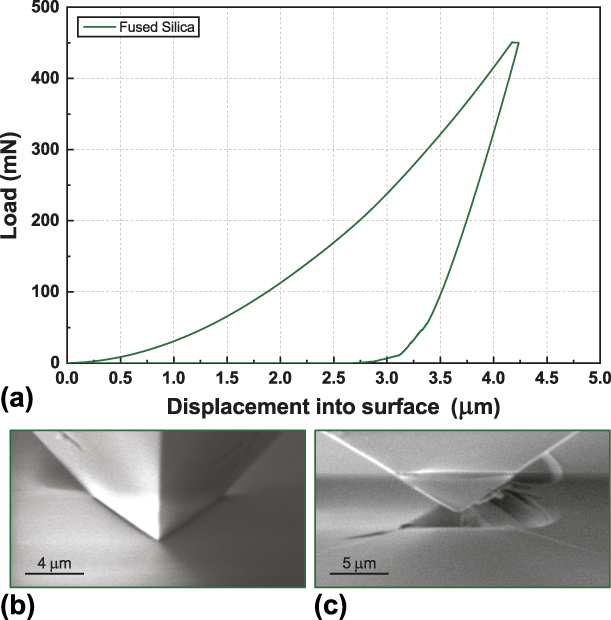
Figure 4 shows the load–displacement curve obtained during indentation of fused silica with the cube-corner tip. In Fig. 4(b), the indentation is shown with two faces visible at maximum load, and shadows can be observed around the faces of the tip. These shadows correspond to sink-in of the material away from the facets of the indenter, which is usually observed for fused silica indentation. These shadows in the image make it impossible to clearly define the point of contact between the sample and the tip directly from the in situ observation. The appearance of the ‘shadows’ arise from the narrow space between the sample and the indenter tip occluding the motion of secondary electrons from escaping from the narrow chasm and reaching the secondary electron detector. To measure the contact area, a secondary method was needed. This is shown in Fig. 4(c) where a trace is visible on the tip after indenting fused silica. For this, a very high unloading rate (100 mN/s) was used to retract the indenter tip immediately after attaining the maximum load. This rapid unloading was performed to avoid any displacement variations, e.g., creep, during unloading. The remaining trace on the indenter demarcates the Frontier between the upper portion of the indenter, which exhibits an amorphous carbon layer from electron beam induced deposition, and the contact zone which was abraded clean during indentation. This trace was used to estimate the sink-in of the fused silica sample using Eq. (11). In Table I and Fig. 6, the in situ projected contact area determined for fused silica is very close to the A c estimated with the Loubet et al. model, the O–P model, and with the literature modulus as expected. However, the work of indentation method is seen to deviate significant from the other methods.
(a) Load–displacement curve obtained on fused silica with a cube-corner tip with secondary electron micrographs showing (b) the indentation at maximum load and (c) the indentation after unloading, showing the trace left by the material on the tip, and used to determine the sink-in.

Indentations with a Berkovich tip
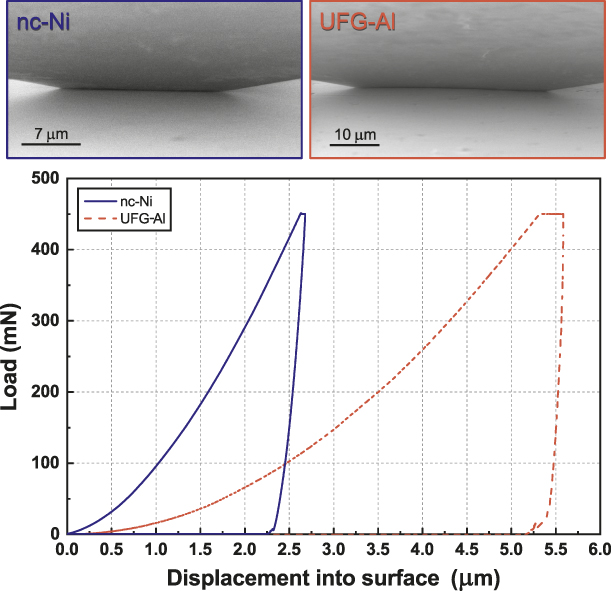
In Fig. 5, the load–displacement curves obtained using the standard Berkovich indenter geometry on the UFG-Al and nc-Ni are presented along with in situ micrographs acquired at maximum load. Using the Berkovich geometry, the pile-up is significantly more difficult to discern due to the narrow field of observation. There is still some pile-up visible on UFG-Al, but no pile-up is discernible on the nc-Ni sample. This demonstrates that the tip geometry has a significant effect on the pile-up height. For this geometry, Table I and Fig. 6 show the in situ contact area determined for UFG-Al is very close to the contact area determined by the Loubet et al. method. This supports the claim that this model can precisely estimate pile-up. However, this is not the case for nc-Ni sample, where the in situ contact area is better estimated by the O–P model rather than the Loubet et al. model.
Load–displacement curves obtained on nc-Ni and UFG-Al with a Berkovich tip and accompanying SE micrographs showing the indentations at maximum load.

Bar charts presenting the difference between the in situ contact area and the contact area determined using literature models. (a) Indentation on UFG-Al using cube-corner and Berkovich tips. (b) Indentation on nc-Ni using cube-corner and Berkovich tips. (c) Indentation on fused silica using a cube-corner tip.

Because no significant pile-up was observed for the Berkovich indentations on nc-Ni, it is not surprising that the Oliver and Pharr model better approximates to the in situ A c. Moreover, from the h c/h ratios obtained from the in situ contact area calculation given in Table I, it can be observed that the h c/h ratio in this case is lower than 1, suggesting sink-in occurred during the indentation of this sample. However, this sink-in is not observed in Fig. 5. This suggests that the sink-in area may not be localized in the near vicinity of the indent, as in fused silica, but in a larger area around the tip, which would explain the difficulty in observing the sink-in in situ.
Discussion
The in situ projected contact area has been measured by SEM images recorded at maximum load. This new method was applied on three different materials: UFG-Al, nc-Ni and fused silica samples. This in situ method allowed precise measurement of A c for materials which exhibited a pile-up around the tip during indentation. For materials exhibiting sink-in behavior, the measurement can be more difficult. A method to determine this during indentation on fused silica with a cube-corner indenter has been demonstrated. This trace method might be expected to extend to other materials with sufficient hardness or chemical reactivity to remove deposited amorphous carbon from the indenter tip during contact. The in situ projected contact area measured by SEM images adds new insight into the indenter geometry dependence of the precision of the contact area calculation with common models.
Using a Berkovich tip, the in situ projected contact area is always close to A c obtained by either models. The in situ projected contact area measured on UFG-Al is closer to the A c calculated with the Loubet et al. model, while the in situ projected contact area measured on nc-Ni is closer to A c calculated with the O–P model and the work of indentation model. It can be also observed that the H/E ratio (and the h f/h m ratio) is different between the two samples, which offers an explanation why the in situ A c is closer to the Loubet et al. model in the case of indentation on UFG-Al sample, or the O–P model in the case of indentation on nc-Ni.
Using the cube-corner geometry, nearly all the models (except the work of indentation method) closely approximate the in situ measured projected contact area of fused silica. This is not too surprising because these methods were all developed and calibrated using this material. However, for cube-corner tests on UFG-Al and nc-Ni, the A c calculated with each model underestimates the in situ contact area. The O–P model fails to calculate the true A c correctly because it does not account the pile-up occurring in these materials. The Loubet and the work of indentation methods do account for the pile-up; however, the A c determined with these models is still far from the in situ value. The results suggest that for materials exhibiting low strain hardening, the projected contact area cannot be calculated for the cube-corner with any of the models.
Another difficulty using the cube-corner geometry on these metallic samples is the contact stiffness measurement. Even with the in situ projected contact area, the determined Young’s modulus is higher than the literature value. On the metallic samples, the unloading curve is almost vertical (high h f/h m ratio), leading to a very low precision fit of the unloading curve due to limited elastic recovery. Another reason could come from the friction between the cube-corner tip and the sample, which is not negligible for this tip geometry and can affect the contact stiffness calculated from the Sneddon equation. On fused silica, where the h f/h m ratio is low, the stiffness measurement is more precise due to the significant elastic recovery. The Young’s modulus is in good agreement between all cases. In general, it is expected that lower aspect ratio indenters (larger included angle), such as the Berkovich geometry, yield higher precision stiffness measurements, while higher aspect ratio indenter geometries yield better in situ observation capabilities. This trade-off limits the feasibility of this technique to higher aspect indenters, but fortuitously, these are also the geometries which are more prone to pile-up and are more likely to require in situ contact area measurements.
Conclusion
In this work, a new method has been described to directly measure the projected contact area during indentation using in situ testing in an SEM. In this method, the indentation testing process is continuously observed in the SEM to monitor the surface deformation around the tip. For perfectly plastic indentations and indentations displaying pile-up, these recorded images were used to directly measure the projected contact area at maximum load using simple geometric formula to account for the indenter geometry and sample inclination for observation. To calculate the projected contact area in materials with sink-in behavior, a fiducial trace left on the indenter tip after unloading was used. This method was successfully applied on three materials with different H/E ratios using both Berkovich and cube-corner indenter geometries. These observations were then used to examine the accuracy of several contact mechanical models for indentation contact area estimation.
It is shown that the in situ projected contact areas measured by SEM varied from contact mechanical models depending on both indenter geometry and on the materials’ hardness/elastic modulus ratio. Using a Berkovich indenter, only one of the models appears to agree with in situ contact area measurements for each range of hardness/elastic modulus ratio. For materials with a low H/E ratio, which are prone to pile-up, the Loubet et al. model is in good agreement with in situ observations. While for materials with a higher H/E ratio, the Oliver and Pharr model was in the best agreement with in situ measurements. Using a cube-corner indenter, classical mechanics models were seen to underestimate the in situ contact area for both metallic materials tested (H/E ratios between 0.006 and 0.013), with the Loubet et al. model giving the closest approximation with error still exceeding 15%. Using the cube-corner indenter on the standard reference material for nanoindentation, fused silica, with an H/E ratio of 0.14, the in situ measured contact area was in good agreement with all of the models.
Method to calculate the in situ contact area
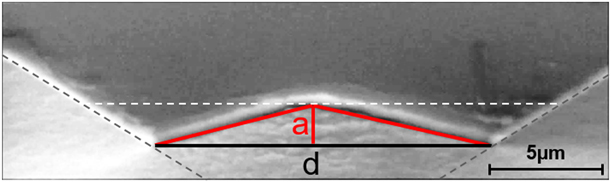
During the test, the load and the indenter tip displacement are measured at regular intervals, producing a load–displacement curve. This allows the contact area to be subsequently inferred using contact mechanics. In this work, the contact area was measured with the monotonic load-unload method, meaning A c is only measured at maximum load. The Oliver and Pharr method was then used to calculate the contact stiffness [Reference Oliver and Pharr9]. During the test, a video of the indentation process is recorded to measure the in situ projected contact area. In the majority of cases, in situ A c measurement was performed from the observation of a single indenter facet. This was done to have the largest possible surface visible in the image, leading to a more precise A c measurement. It assumes symmetric deformation with identical pile-up present on each face of the indenter. This is the case only when both the sample is perfectly flat and the tip is aligned perpendicular to the surface. In this work, the angle of inclination was verified as being less than 0.5°. This was done by detecting three contact points at the perimeter of the indentation area and calculating the angle between this plane and a plane perfectly perpendicular to the indentation axis. Imaging parameters were varied between samples to optimize video quality for each experiment. The load–displacement data were acquired synchronized to the video, enabling the image corresponding to the maximum load to be accurately extracted from the video frames. An example of the in situ contact area measurement method is presented in Fig. 7, which shows a video frame acquired during an in situ indentation on a nanocrystalline nickel sample with a cube-corner tip. The pile-up measured for each sample is assumed to have the form of a triangle, which allows A c to be determined using only the lengths a and d as depicted in Fig. 7. The length d is used to calculate the triangular area corresponding to the projected contact area without pile-up or sink-in. The value of d is determined by plotting lines along the tip edges to detect the edges of the contact (see Fig. 7). The triangular area is calculated by using the following equation:
 $${A_{\rm{t}}} = {{{d^2} \times \tan \left( {60^\circ } \right)} \over 4}\quad .$$
Secondary electron micrograph schematically illustrating the contact area measurement during in situ indentation.
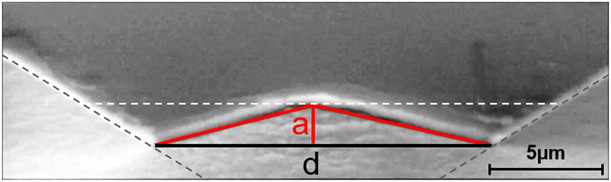
The pile-up or sink-in calculation is more complicated. It must account for both the indenter inclination γ, and the tip semi-angle θ (see Fig. 7). If the sample is inclined, this also has to be taken into account. The height, a, is determined from the same video frame used for measuring d. To determine the pile-up height a, a horizontal segment was plotted and moved until it was tangent to the pile-up top, permitting to calculate a. The contact area corresponding to the pile-up or sink-in formation is then given by the following equation:
 $${A_{{\rm{p,s}}}} = 3{{d \times a \times \sin \;\theta } \over {2\cos \left( {\theta + \gamma } \right)}}\quad .$$
For reference, θ is the angle between the face and the vertical axis of the tip (θ = 35.22° for a cube-corner tip and θ = 65.3° for a Berkovich tip). Further details about A p,s calculation are provided in the Supplementary material file. Finally, the in situ projected contact area can be determined using the following equations:
 $${A_{\rm{c}}} = {A_{\rm{t}}} + {A_{\rm{p}}}\;\left( {{\rm{pile ‐ up}}} \right)\quad ,$$
 $${A_{\rm{c}}} = {A_{\rm{t}}} - {A_{\rm{p}}}\;\left( {{\rm{sink ‐ in}}} \right)\quad .$$
In this case, θ is defined by the indenter geometry and γ is known. The values a and d are measured directly from the extracted in situ video frame taken at maximum load. Consequently, it is possible to calculate the in situ projected contact area with either Eq. (10) or (11). The possible error from measuring the projected contact area with the SEM is discussed in the Supplementary material file.
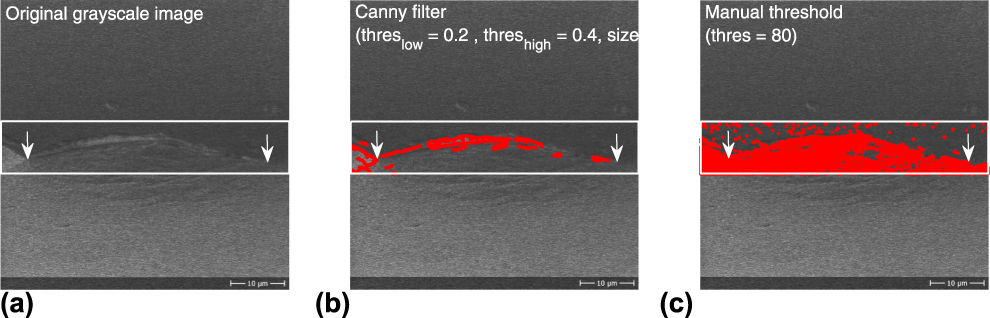
Image analysis could be an alternative way to characterize systematically the contact geometry. However, the usual codes able to highlight geometric features need more contrast than an experienced eye. Figure 8(a) displays an example of UFG-Al in situ image at maximum load. The characterization zone is represented by the white window and the two arrows highlight the contact edges determined geometrically using the method previously presented. Figures 8(b) and 8(c) display the same SEM observation with the contrast detection obtained with a Canny filter and a gray-scale threshold in red.
Contact area measurement using image analysis. (a) SEM image extracted from the video with arrows showing contact edges. (b) Contact area measurement using a Canny filter. (c) Contact area measurement using a gray-scale thresholding.
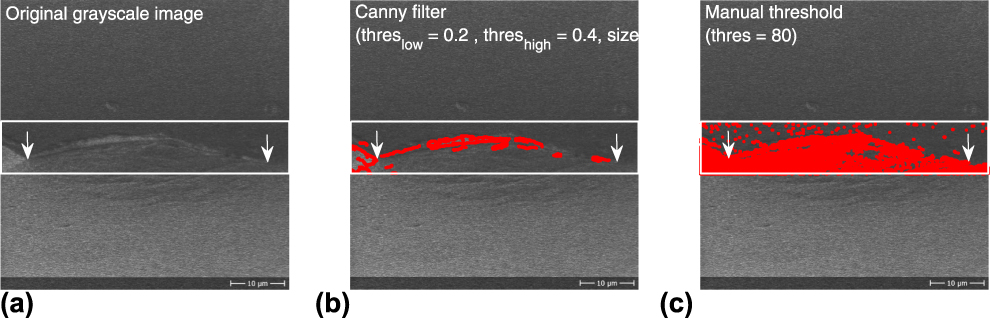
The Canny filter is dedicated to edge detection and is adjusted by three parameters: threslow, threshigh, and sizefilt. If the gradient intensity is lower than threslow then the pixel is rejected and if it is greater than threshigh, it is accepted; if it is between the two, it will be accepted only if it is connected to an already accepted pixel. The sizefilt governs the size of the 2D Gaussian filter used for noise reduction.
The Canny filter gives reasonable result with the set of parameters used, given the limited contrast in the contact zone. Nevertheless, this operation is not sufficient to perform any edge detection subsequently.
In the case of the gray-scale threshold [Fig. 8(c)], a good detection of the pile-up is performed but the contact edges are still difficult to highlight.
Thus, to perform quantitative measurements of the contact geometry by means of image analysis, particular care must be taken to obtain the maximum contrast between the tip and the sample surface.
Experimental
Materials
Three materials were tested: ultrafine-grained (UFG) aluminum (400 nm grain size), nanocrystalline (nc) nickel (70 nm grain size), and fused silica. UFG-Al was fabricated by means of equal channel angular pressing (ECAP) of up to 8 passes using commercially pure aluminum (AA1050A). The details of the processing and properties of the UFG-Al can be found in Ref. Reference May, Höppel and Göken34. The nc-Ni sample was prepared using a LIGA process [Reference Saile, Saile, Wallrabe, Tabata and Korvink35]. UFG-Al and nc-Ni were selected for their ductility and propensity to exhibit pile-up during indentation. Fused silica was selected both for being the standard reference material for indentation testing and for its tendency to exhibit sink-in behavior during indentation. The projected contact area during the indentation of fused silica is also supposed to be precisely calculated by both the Oliver and Pharr model and the Loubet et al. model [Reference Oliver and Pharr4, Reference Bolshakov and Pharr13, Reference Guillonneau, Kermouche, Bec and Loubet36].
Experimental apparatus
The system used for in situ indentation testing consists of a Zeiss DSM 962 SEM (Carl Zeiss Microscopy LLC, White Plains , NY) with an Alemnis in situ Indenter, first developed by Rabe et al. [Reference Rabe, Breguet, Schwaller, Stauss, Haug, Patscheider and Michler28]. This apparatus is intrinsically displacement controlled, but it can be operated in pseudo load control using a PID loop. The dimensions are small, permitting the indenter to be installed inside the SEM chamber. It is inclined with respect to the electron column of the SEM to provide an appropriate observation angle with respect to the sample surface. The inclination has to be changed for different indenter geometries owing to the variation in the tip semi-angle to properly observe the indentation.
Experimental parameters
Both a cube-corner tip and a Berkovich tip were used for the experiments. The cube-corner tip was chosen because its higher aspect ratio allows better observation of the indentation. However, the Berkovich tip was chosen because it is the most commonly used indenter geometry in instrumented indentation. The tip defect height, h 0, calculated with the Loubet model for the indenters is ∼60 nm for the cube-corner and ∼20 nm for the Berkovich tip (determined on fused silica as in Ref. Reference Loubet, Bauer, Tonck, Bec and Gauthier-Manuel14). The inclination angle of the instrument, γ, was 22.1° for the indentations performed using a cube-corner tip and 10.6° for indentations using a Berkovich tip. Indentations were performed in pseudo load control using a constant strain rate of  ${{\dot{P}} / P} = 0.01\;{{\rm{s}}^{ - 1}}$ for each sample (
 $\dot{P}$ is the loading rate). Constant load intervals were held at maximum load to minimize the influence of creep during unloading (240-, 150-, and 10-s holding times for UFG-Al, nc-Ni, and fused silica, respectively), and at 95% of unloading to determine possible thermal drift. The contact area was determined using the Oliver and Pharr method [Reference Oliver and Pharr4], the Loubet et al. method [Reference Loubet, Bauer, Tonck, Bec and Gauthier-Manuel14], the work of indentation method, and by assuming a known sample modulus to calculate the contact area using Eqs. (2) and (3) from the unloading stiffness [Reference Göken, Sakidja, Nix and Perepezko26, Reference Weihs and Pethica37]. The projected contact area at maximum load was measured in situ using the method described in section “Experimental apparatus”. The scanning speed used to register the videos is around 1 frame per second with a resolution of either 250 × 250 pixels or 500 × 500 pixels, depending on the sample. The method to calculate the in situ contact area is presented in part 6. A minimum of 6 tests were performed on each sample. All samples were tested with a cube-corner indenter, while only UFG-Al and nc-Ni were tested with a Berkovich tip. In situ contact area measurement on fused silica with a Berkovich tip was not feasible due to poor imaging conditions from both the sample’s low electrical conductivity and the Berkovich semi-angle being too large to observe the sink-in precisely.
Supplementary material
To view supplementary material for this article, please visit https://doi.org/10.1557/jmr.2019.236.