1. Introduction
Intracranial aneurysms are pathological outgrowths of the walls of intracranial arteries. These ‘berry-like’ growths can be approximated as spherical cavities that develop on the sidewalls of curved arteries that feed oxygenated blood to the brain, due to abnormal remodelling of the vascular wall (Lasheras Reference Lasheras2007). Due to the risk of aneurysm rupture, which results in subarachnoid haemorrhage and haemorrhagic stroke with mortality rates as high as 50 % (Johnston, Selvin & Gress Reference Johnston, Selvin and Gress1998), the pathological flow inside the cavity is treated to produce stagnation and a stable thrombus. One of two key endovascular treatment options consists of placing a low-porosity metal mesh, a flow-diverting stent (FDS), across the cavity opening. In practice, this is done by introducing the metal mesh cylinder through an endovascular catheter and placing it along the wall of the parent vessel covering the aneurysmal neck (the opening that communicates the parent vessel lumen to the cavity of the aneurysm). This treatment is designed to place a hydrodynamic resistance to flow entering the cavity, reducing flow velocity and stresses inside the aneurysm sac, thus encouraging remodelling in the parent vessel that redirects blood flow away from the aneurysm and creates an environment that promotes the development of a stable thrombus inside the aneurysmal sac. Unfortunately, in 20 %–25 % of cerebral aneurysms treated with a FDS, complete stasis inside the aneurysmal sac does not occur, blood flow still enters the aneurysm and thrombotic filling of the cavity is not complete, leaving the patient at risk of rupture (Brinjikji et al. Reference Brinjikji, Cloft, Fiorella, Lanzino and Kallmes2013; Adeeb et al. Reference Adeeb2017; Maragkos et al. Reference Maragkos2020). The fluid mechanics inside the cavity after covering the opening that communicates the parent vessel with the aneurysmal sac with the porous mesh plays a crucial role in treatment success. Understanding and characterizing this fluid mechanical environment is a necessary part of improving the rate of intracranial aneurysm treatment success (Sforza, Putman & Cebral Reference Sforza, Putman and Cebral2009; Cebral & Raschi Reference Cebral and Raschi2013; Meng et al. Reference Meng, Tutino, Xiang and Siddiqui2014).
Investigation into the altered fluid mechanics of FDS-treated cerebral aneurysms started with the work of Lieber, Stancampiano & Wakhloo (Reference Lieber, Stancampiano and Wakhloo1997) and Aenis et al. (Reference Aenis, Stancampiano, Wakhloo and Lieber1997). Using planar laser-induced fluorescence and computational fluid dynamics simulations, respectively, these groups measured a significant reduction in intra-aneurysmal flow vorticity and velocity following FDS deployment, suggesting that flow stasis was enhanced by treatment, and would likely lead to thrombus formation inside the aneurysmal sac. Since then, a number of studies (Cantón et al. Reference Cantón, Levy, Lasheras and Nelson2005a,Reference Cantón, Levy, Lasheras and Nelsonb; Babiker et al. Reference Babiker, Gonzalez, Ryan, Albuquerque, Collins, Elvikis and Frakes2012; Rayepalli et al. Reference Rayepalli, Gupta, Lum, Majid and Koochesfahani2013; Damiano et al. Reference Damiano, Ma, Xiang, Siddiqui, Snyder and Meng2015) have investigated the influence of the stent properties on aneurysmal flow reduction, attempting to determine the ideal porosity, placement location and number of stents for aneurysm flow reduction. Additionally, in recent years, much research has been focused on developing a causal relationship between reduction in aneurysm haemodynamics following FDS deployment and treatment outcome (Kulcsár et al. Reference Kulcsár, Augsburger, Reymond, Pereira, Hirsch, Mallik, Millar, Wetzel, Wanke and Rüfenacht2012; McAuliffe et al. Reference McAuliffe, Wycoco, Rice, Phatouros, Singh and Wenderoth2012; Paliwal et al. Reference Paliwal, Damiano, Davies, Siddiqui and Meng2017; Chen et al. Reference Chen, Zhang, Tian, Li, Zhang, Zhang, Liu and Yang2019; Su et al. Reference Su, Reymond, Brina, Bouillot, Machi, Delattre, Jin, Lövblad and Vargas2020). These studies have all compared changes in pre- and post-treatment aneurysm haemodynamics in patient-specific computational fluid dynamics simulations with a patient's treatment outcome and suggested candidate thresholds in fluid mechanics variables, such as intra-aneurysmal velocity reduction, that could be predictive of successful treatment. This goal has been elusive, however, and both fundamental research and translational research on large patient cohorts are necessary to obtain conclusive fluid mechanics predictors of aneurysmal treatment outcome.
Despite the vast body of work on the mechanics of FDS-treated intracranial aneurysms, a rigorous parametric characterization of this flow environment, comparing it with the flow in a spherical cavity on the side of a curved pipe (a canonical flow representative of untreated aneurysm fluid mechanics) is missing. This is the primary goal of the present paper. In this Part 2, we describe the changes in the flow topologies inside the cavity when it is covered with a porous mesh, comparing them with the flow patterns observed in Part 1 (Chassagne et al. Reference Chassagne, Barbour, Chivukula, Machicoane, Kim, Levitt and Aliseda2021), for the unimpeded flow into the cavity on the side of a curved pipe. We perform stereoscopic particle image velocimetry measurements of the flow in the curved pipe (parent vessel), the cavity opening on the side of the pipe (the aneurysmal neck) and inside the cavity (the aneurysm sac).
This experimental study uses parent vessel curvature,  $\kappa$, parent vessel flow rate,
 $Q$, and the frequency of the flow pulsatility,
 $Wo$, as dimensional parameters that vary in the physical set-up, to explore the influence of the non-dimensional parameters of interest: Dean, Reynolds and Womersley numbers. The velocity fields inside of four geometries with different values of
 $\kappa$, conceived to represent models of idealized in vitro aneurysms, are analysed at increasing mean Reynolds numbers and under both steady and unsteady forcing.
2. Methods
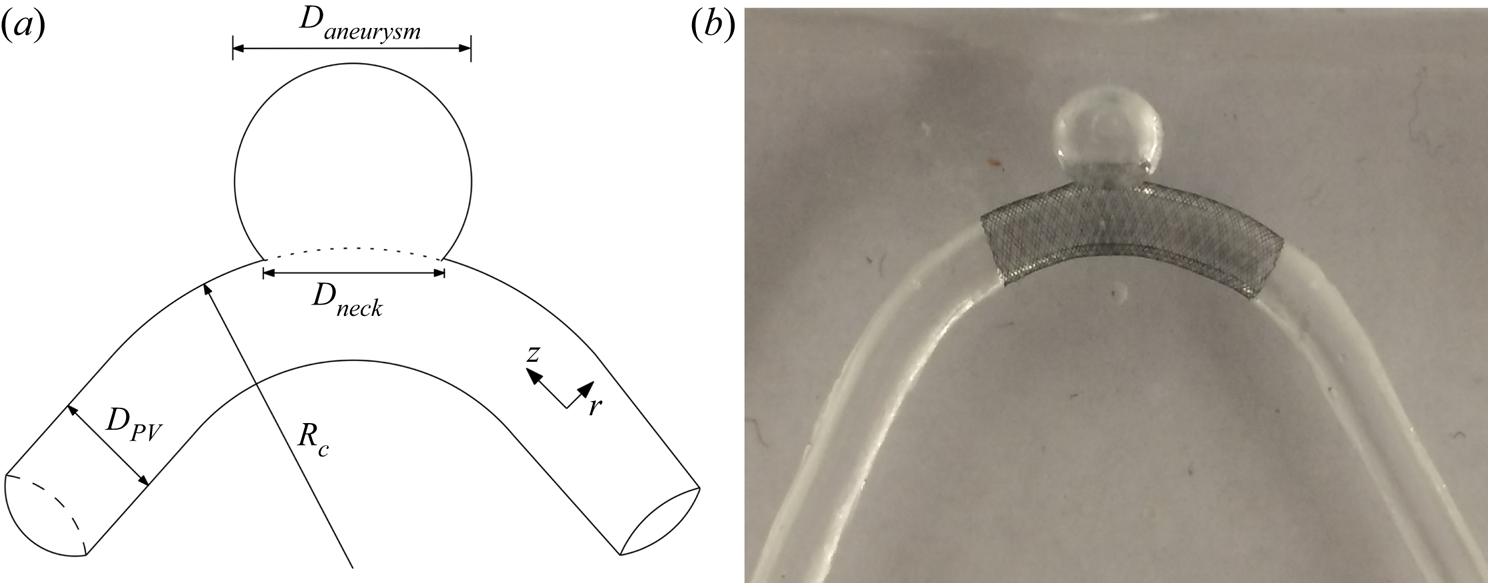
Briefly, the flow field in four idealized aneurysm models treated with a FDS is measured using stereoscopic particle image velocimetry under steady and unsteady flow conditions. The aneurysm diameter,  $D_{aneurysm}$, and parent vessel diameter,
 $D_{PV}$, are 7 and 4 mm, respectively, and the parent vessel curvature,
 $\kappa$, ranges from 0 to 0.22 mm
 $^{-1}$. The flow rates under steady conditions are 100, 200, 300 and 400 ml min
 $^{-1}$ equalling parent vessel Reynolds number,
 $Re$, values of 120, 240, 360 and 480. This provides an effective Dean number range of 0 to 450:
 $De = Re\sqrt {\kappa D_{PV}/2}$. For pulsatile flow conditions, the cycle-averaged flow rate and
 $Re$ are set to match the same four conditions as the steady cases, and two values of Womersley number,
 $Wo$, are investigated: 2.6 and 3.6. The Womersley number is defined as
 $Wo = 0.5D_{PV}\sqrt {2{\rm \pi} / T\nu }$, where
 $T$ is the length of the cardiac cycle and
 $\nu$ is the kinematic viscosity. More details of the experimental set-up and measurement methods can be found in Part 1 (Chassagne et al. Reference Chassagne, Barbour, Chivukula, Machicoane, Kim, Levitt and Aliseda2021).
A FDS is introduced into each aneurysm model by an experienced neurosurgeon who ‘treats’ the physical model with a braided mesh cylinder woven from platinum/tungsten and cobalt–chromium–nickel alloy wires ( $4~\mathrm {mm} \times 20$ mm, PipeLine Embolization Devices, Medtronic, Dublin, Ireland) as shown in figure 1(b). The mesh lies along the pipe length, centred on the region where the cavity opens on the pipe wall, covering it completely. These stents are designed for parent vessels with a diameter of 4 mm and can expand, if unimpeded, to a diameter of 4.25 mm. They are 20 mm long and comprised of 48 braided wires, with half spiraling in a clockwise direction and the other half in a counterclockwise direction. Each wire has a diameter of 33
 $\mathrm {\mu }$m.
(a) Sketch of the idealized cerebral aneurysm with the key geometrical parameters used to define the study. (b) Silicone model of a sidewall cerebral aneurysm treated with a clinically used stent along the parent vessel. The curvature in this case is 0.0625 mm $^{-1}$.

3. Steady free-stream flow
3.1. Aneurysm flow field topology
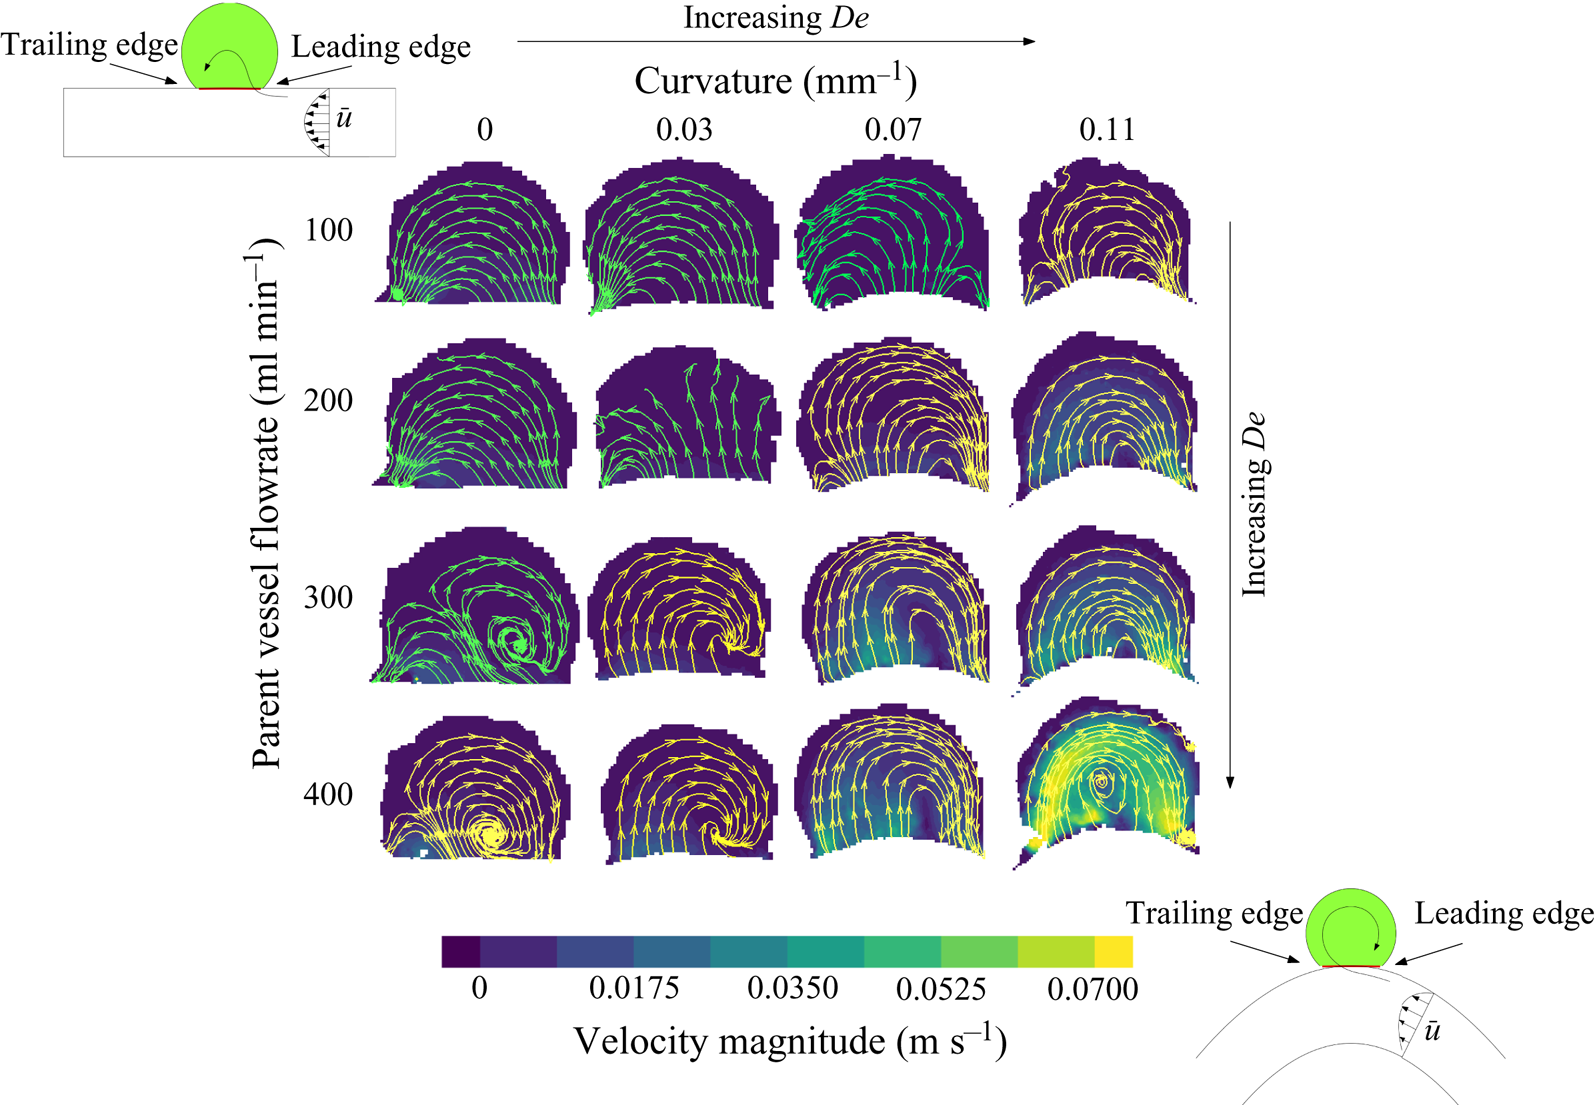
The contours of velocity magnitude at the aneurysm midplane are shown in figure 2 for all parent vessel flow rates and curvatures. Streamlines are used to highlight the direction of the flow inside the aneurysm with flow in the parent vessel (not shown) travelling from right to left. At the lowest  $De$, upper left, the flow expands into the aneurysm at the leading (upstream) edge and exits at the trailing (downstream) edge of the aneurysmal cavity, resulting in counterclockwise rotation (co-rotating with the parent vessel flow) in the aneurysmal dome. This flow topology is similar to low-
 $Re$ expansion flow over a cavity, without the existence of corner recirculation eddies (Moffat eddies) due to the quasi-spherical geometry. In the work done by Higdon (Reference Higdon1985), high-
 $Re$ flow inside of a circular cavity with this level of depression was shown to be comprised of a single counter-rotating vortex. The fact that flow in this aneurysm is attached and co-rotates with the parent vessel flow is the result of the FDS slowing down flow inside the cavity, and subsequently acting as a barrier between the viscous-dominated aneurysm flow and high inertia of the parent vessel flow.
Velocity contours and streamlines at the streamwise midplane of the aneurysm sac. Flow inside the parent vessel (not shown) is from right to left. Parent vessel flow rate (or  $Re$) increases with descending rows and parent vessel curvature increases moving left to right across columns. The value of
 $De$ increases along the diagonal.

As  $De$ increases, however, either by increasing parent vessel flow rate (down the rows) or curvature (left to right, across the columns), the flow inside the aneurysm begins to separate and two recirculation eddies form. At intermediate
 $De$, both clockwise and counter-clockwise rotating eddies exist inside the aneurysm, and the entrance location of flow into the aneurysm shifts downstream. Further increases in
 $De$ (panels along the bottom and right edge of the
 $4 \times 4$ image matrix) result in a single recirculating vortex with the flow entering the aneurysm at the trailing edge and exiting at the leading edge of the cavity.
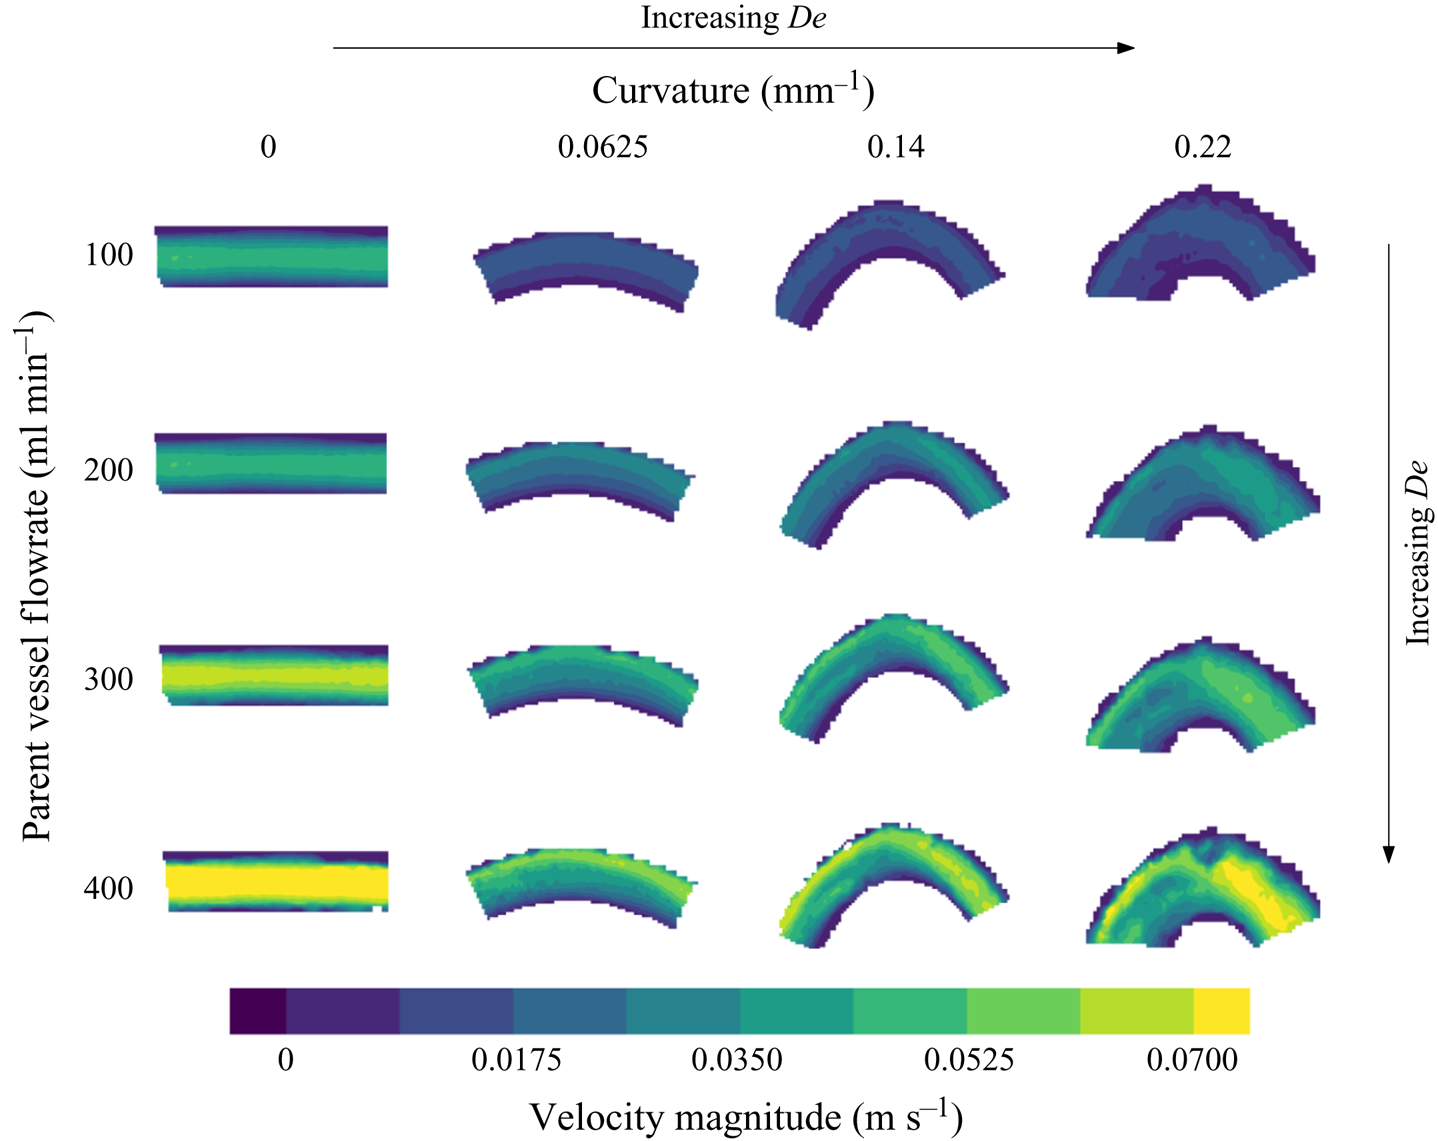
In figure 3, the velocity magnitude is shown at the midplane of the parent vessel for all values of  $Re$ and
 $\kappa$. The location of peak velocity magnitude can be seen to shift towards the outer wall with increasing
 $De$ (which increases with increasing parent vessel curvature and
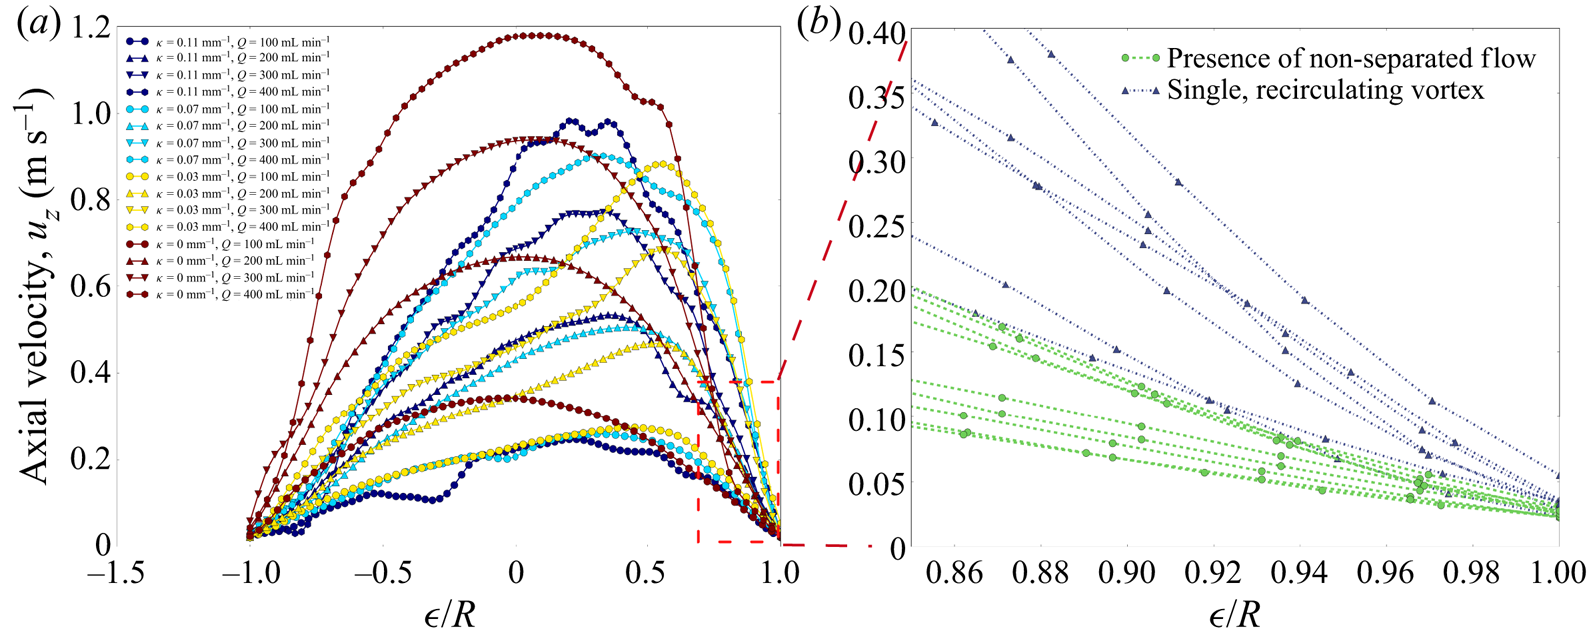
 $Re$). The axial velocity profiles, plotted in figure 4(a), are computed by dotting the three-dimensional velocity measurements with the vector normal to the extraction line. In the straight aneurysm model, the axial velocity profile is parabolic, as expected at this laminar
 $Re$, and increases in magnitude with flow rate. In the curved models, the axial velocity profile begins to shift towards the outer wall. The construction of the aneurysm models is such that the arc length of the model shortens with increasing
 $\kappa$. In figure 4(a), the shift in axial velocity towards the outer wall is less pronounced in the model with
 $\kappa = 0.22$ mm
 $^{-1}$ than it is for the two other models with smaller curvature. This is because the arc length from entrance region to measurement plane is shortest for
 $\kappa = 0.22$ mm
 $^{-1}$, and the flow is still developing, a phenomenon highlighted in Bovendeerd et al. (Reference Bovendeerd, Van Steenhoven, Van De Vosse and Vossers1987).
Contours of velocity magnitude measured at the midplane of the aneurysm parent vessel. Parent vessel flow rate ( $Re$) increases with descending columns and parent vessel curvature increases left to right across columns. The value of
 $De$ increases along the diagonal.

(a) The axial velocity profile extracted from each experimental condition at the midplane of the parent vessel. (b) A zoomed-in view of the axial velocity profile at the leading edge of the aneurysm neck. Velocity profiles are coloured blue if the flow inside the aneurysm has separated and is rotating clockwise and green if any counterclockwise rotation exists inside the aneurysm.

In figure 4(b), the details of axial velocity measurements near the outer wall, at the leading edge of the aneurysm, are highlighted. The velocity field is extracted along a line extending from the leading edge of the aneurysm sac to the centroid of the parent vessel. Each line in the figure is coloured by the flow topology inside the aneurysm (clockwise or counterclockwise vortices) for the corresponding flow and curvature conditions. Inspection of the parent vessel flow field, right at the leading edge, shows that the topology of the flow inside the aneurysm is a function of the streamwise velocity at the aneurysm neck (specifically the shear stress at the cavity leading edge that determines whether flow detaches or remains attached to the cavity wall), which in the case of curved vessels is parameterized by  $De$.
The axial velocity profiles extracted from conditions that resulted in a single recirculating vortex inside the aneurysm are coloured in blue and those with any counterclockwise rotation are highlighted in green. A clear separation is seen in the slope of the axial velocity at the leading edge of the aneurysm cavity (the shear at the wall) for the two flow topologies. The critical  $De$, above which flow at the leading edge separates and the sense of rotation inside the aneurysm is entirely opposite to the bulk flow direction (clockwise), is
 ${\approx }180$.
At a sufficiently low  $\textit {Re}$, the flow inside the aneurysm remains attached to the wall and travels in the same direction as the bulk flow (upper left corner in figure 2). In the straight model, increasing
 $\textit {Re}$ eventually leads to flow separation, recirculation and a downstream shift in the entrance location of parent vessel flow into the aneurysm. As the curvature of the parent vessel increases, this transition from attached, forward-rotating flow to fully counter-rotating circulation flow in the aneurysmal sac happens at lower values of parent vessel
 $\textit {Re}$.
3.2. Aneurysm velocity characterization
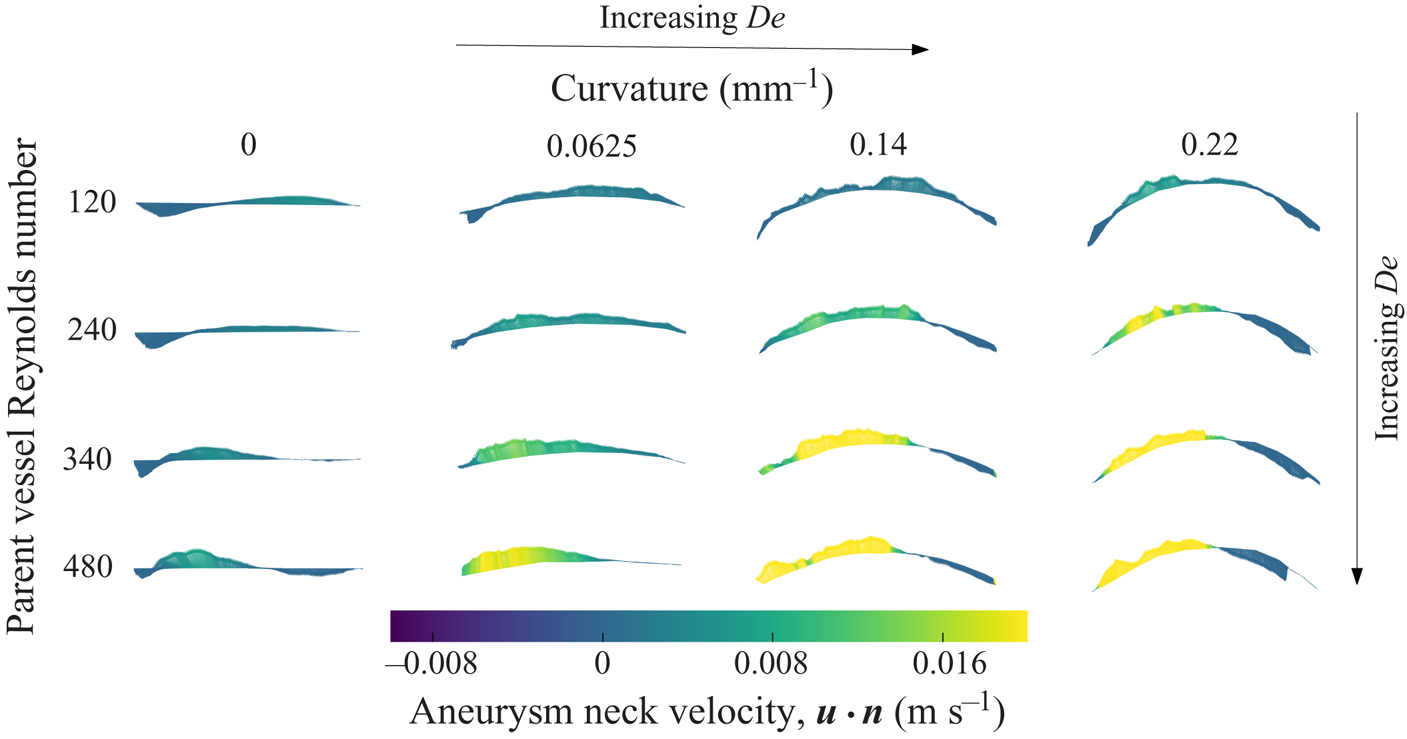
The velocity vectors at the neck of the aneurysm are extracted along curves just above the FDS, at each measurement plane. The vectors extracted from the midplane are shown in figure 5, coloured by the magnitude of the component normal to the aneurysmal neck surface ( ${\boldsymbol {u}}\boldsymbol {\cdot } {\boldsymbol {n}}$). Again, parent vessel
 $\textit {Re}$ increases with descending rows and parent vessel curvature increases across columns from left to right. The direction of the flow entering the aneurysm is highlighted here with non-separated, counterclockwise rotation occurring at the lowest
 $De$ (upper left) and separated, clockwise rotation occurring with increasing
 $De$ (bottom right).
Velocity vectors extracted from the aneurysm neck at the midplane. Vectors are coloured by the magnitude of  $\boldsymbol {u} \boldsymbol {\cdot } \boldsymbol {n}$.

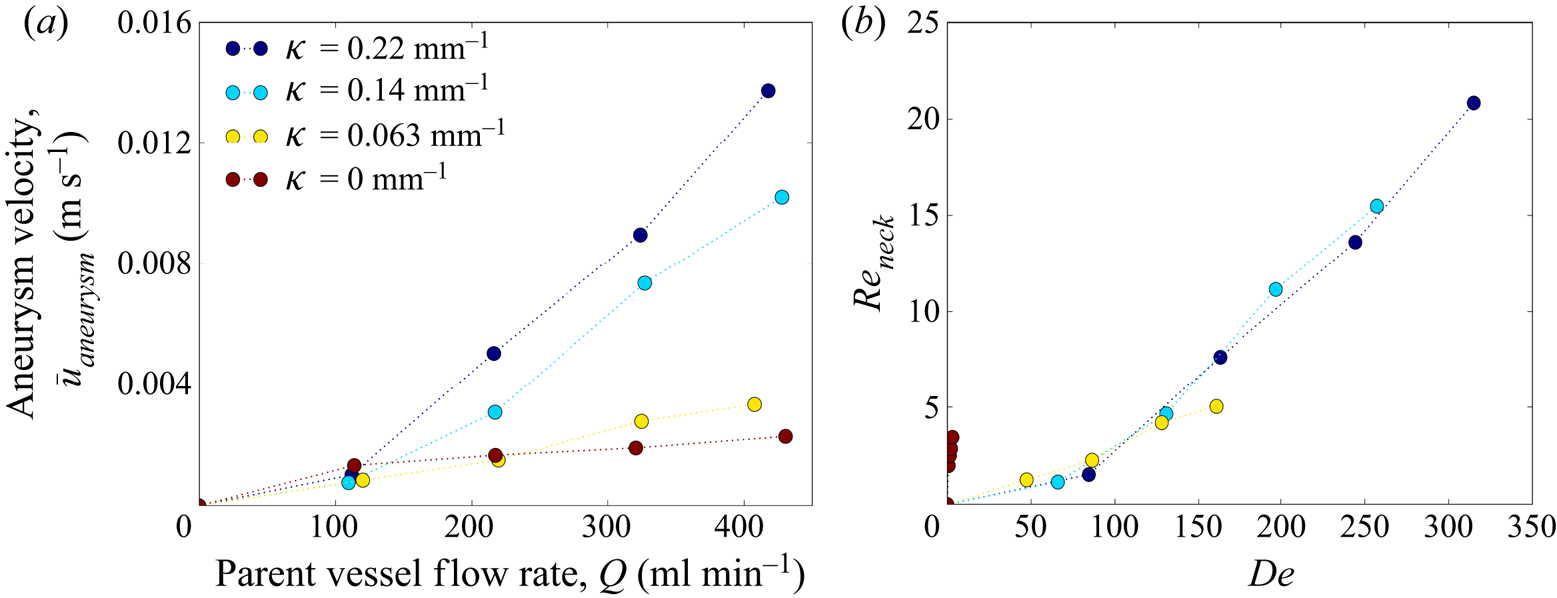
Aneurysm inflow velocity,  $\bar {u}$, is plotted against flow rate in figure 6(a) (Part 1, (2.1)). The average aneurysm inflow velocity increases with increasing parent vessel flow rate and with parent vessel curvature for all models. Figure 6(b) shows the aneurysm inflow Reynolds number (
 $Re_{neck} = \bar {u} D_{neck}/\nu$) plotted against parent vessel
 $De$. For all models with curvature, the
 $Re_{neck}$ values collapse onto a single curve, indicating that the amount of flow that enters the cerebral aneurysm sac, treated with FDS, is a function of parent vessel
 $De$ only. The shift in axial velocity towards the outer wall in a curved vessel is accompanied by secondary vortices transporting fluid along the centre plane from the inner to the outer wall. The magnitude of the outward radial velocity component at the midplane of the parent vessel increases with increasing
 $De$ and, as a result, the magnitude of flow entering the aneurysm also increases.
The average aneurysm inflow velocity for each value of parent vessel curvature and flow rate shown in (a) dimensional and (b) non-dimensional units.

In the straight model, the radial velocity component is zero upstream of the aneurysm. At the leading edge, flow expands into the aneurysm, creating a radial velocity component which is a function of axial velocity, aneurysm geometry and stent porosity. Increases in parent vessel inertia lead to separated flow with the point where the parent vessel flow enters the aneurysmal sac moving downstream (but never reaching the trailing edge). Because the vessel is not curved, there are no increases in parent vessel radial velocity due to secondary vortices, so the increase in aneurysm inflow velocity with parent vessel  $\textit {Re}$ is limited, as seen in figure 5.
In the curved vessels, the aneurysm inflow velocity is heavily influenced by the radial velocity generated by the pressure gradient associated with the sudden expansion, and the secondary (Dean's) vortices in the parent vessel created by the curvature and subsequent inertial instability. Since aneurysm inflow velocity is approximately equal for all cases at the lowest parent vessel  $\textit {Re}$, the radial velocity that arises due to secondary vortices is small compared to that due to the pressure gradient at the expansion, for the lowest value of parent vessel
 $\textit {Re}$. However, with increasing parent vessel inertia, the aneurysm inflow velocity in all curved models rapidly becomes larger than that in the straight vessel, indicating that the radial velocity in the aneurysm generated by the curvature-induced flow in the parent vessel becomes the driving component in aneurysm inflow velocity at higher
 $De$.
4. Unsteady free-stream flow
4.1. Flow structure across the cardiac cycle
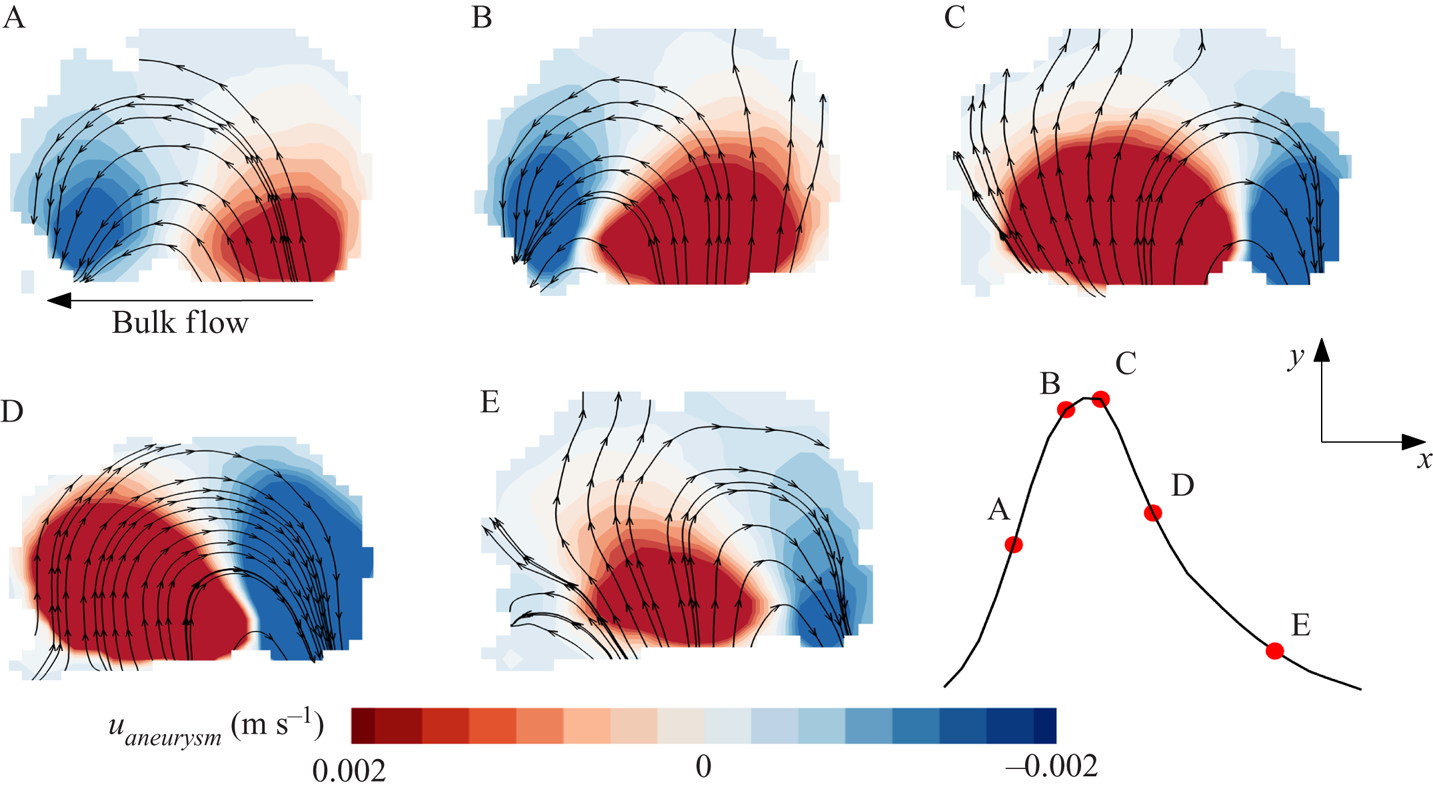
In figure 7, the aneurysm flow field is plotted at five instants during the cardiac cycle for the condition  $\kappa =0.0625\ \textrm {mm}^{-1}$,
 $Re = 320$ and
 $Wo = 2.6$. In each snapshot of this representative case, streamlines at the aneurysm midplane are overlaid on contours of the
 $y$ component of velocity (component of velocity entering and exiting the aneurysm),
 $u_{aneurysm}$. At the beginning of the cardiac cycle (A), as the parent vessel flow starts to accelerate, the flow entering the aneurysm remains attached to the leading edge of the aneurysm cavity. Towards the end of the accelerating phase (B), the flow remains attached, yet the primary vortex in the aneurysm begins to shift towards the distal edge of the aneurysm, and the flow entering the aneurysm at the leading edge no longer rotates with the primary aneurysm vortex. Right at peak systole (C), the aneurysm flow separates at the leading edge. This counter-rotating vortex then continues to grow until it encompasses the entire aneurysm dome during the deceleration phase (D). Towards the end of the cardiac cycle (E), the counter-rotating vortex begins to break down and flow at the distal edge of the aneurysm once again rotates with the primary direction of the parent vessel flow.
Velocity contours and streamlines at the aneurysm midplane for the condition  $\kappa = 0.0625\ \textrm {mm}^{-1}$,
 $Re = 320$ and
 $Wo = 2.6$ at five locations in the cardiac cycle. Velocity contours are of the vertical component of velocity,
 $u_{aneurysm}$.

The structure of the flow at the leading edge of the aneurysm is primarily controlled by two pressure gradients, both functions of the flow rate entering the aneurysm,  $Q(t)$. As flow expands into the aneurysm, an adverse pressure gradient develops at the leading edge of the aneurysm wall which is proportional to
 $Q(t)^2$. A second pressure gradient exists due to the acceleration of the fluid which is proportional to
 $\partial Q(t)/\partial t$. As soon as flow begins to enter the aneurysm, the adverse pressure gradient begins to grow. At the beginning of the cardiac cycle, however, when
 $\partial Q(t)/\partial t$ is positive, the acceleration-based gradient is also positive and acts to keep the flow attached to the leading edge. As
 $Q(t)$ increases, however, and the cardiac cycle moves through systole,
 $\partial Q(t)/\partial t$ decreases while the expansion-based pressure gradient increases in magnitude. Eventually, the magnitude of the expansion-based pressure gradient becomes larger than the acceleration-based gradient, and flow at the leading edge begins to separate. Throughout diastole, with the acceleration-based gradient becoming negative, the separated aneurysm vortex continues to grow until it fills the entire aneurysm cavity.
4.2. Inertial effects (Dean and Reynolds numbers)
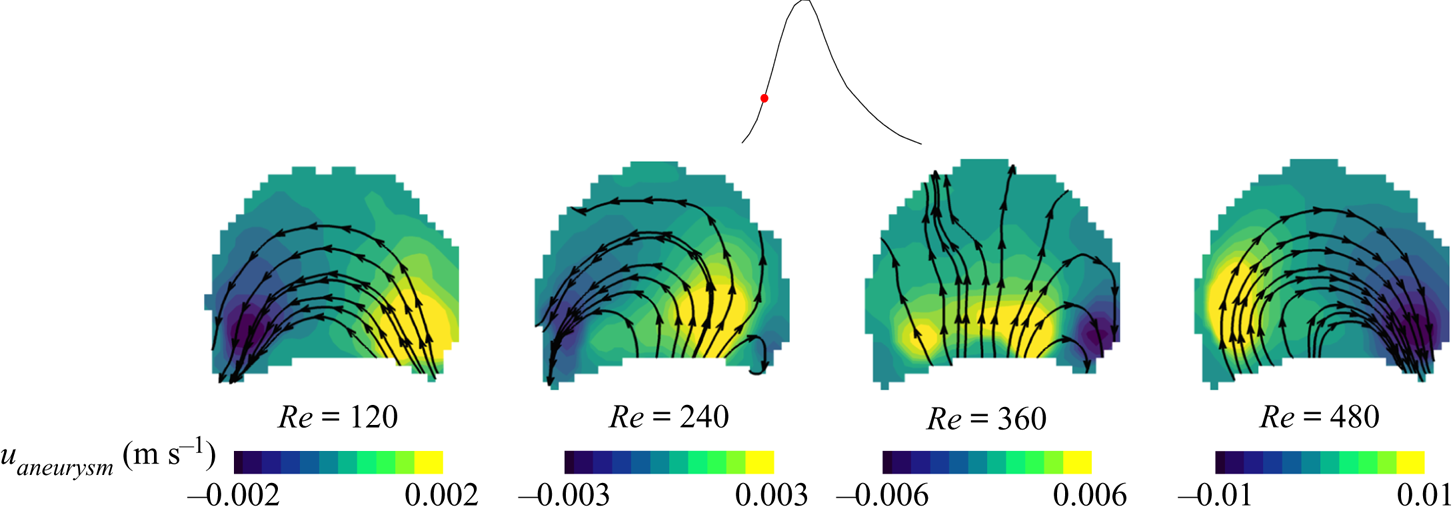
In figure 8, velocity contours and streamlines are plotted for the same aneurysm model ( $\kappa =0.22\ \textrm {mm}^{-1}$) at increasing values of parent vessel
 $\textit {Re}$. Each panel shows the flow field at the same instant in the cardiac cycle. At the lowest values of parent vessel
 $\textit {Re}$, the flow remains completely attached to the aneurysm wall, rotating in the direction of the bulk flow. As
 $\textit {Re}$ increases, the flow topology shifts, from attached forward-rotating to separated counter-rotating flow at the same point in the cardiac cycle. In other words, the flow begins to separate at an earlier point in time as
 $\textit {Re}$ is increased.
Velocity contours and streamlines at the aneurysm midplane for the condition  $\kappa =0.22$ mm
 $^{-1}$,
 $Wo = 2.6$. Each panel highlights a snapshot from the same location in the cardiac cycle (halfway through acceleration) for increasing values (left to right) of cycle-averaged
 $Re$. Velocity contours are of the vertical component of velocity,
 $u_{aneurysm}$.

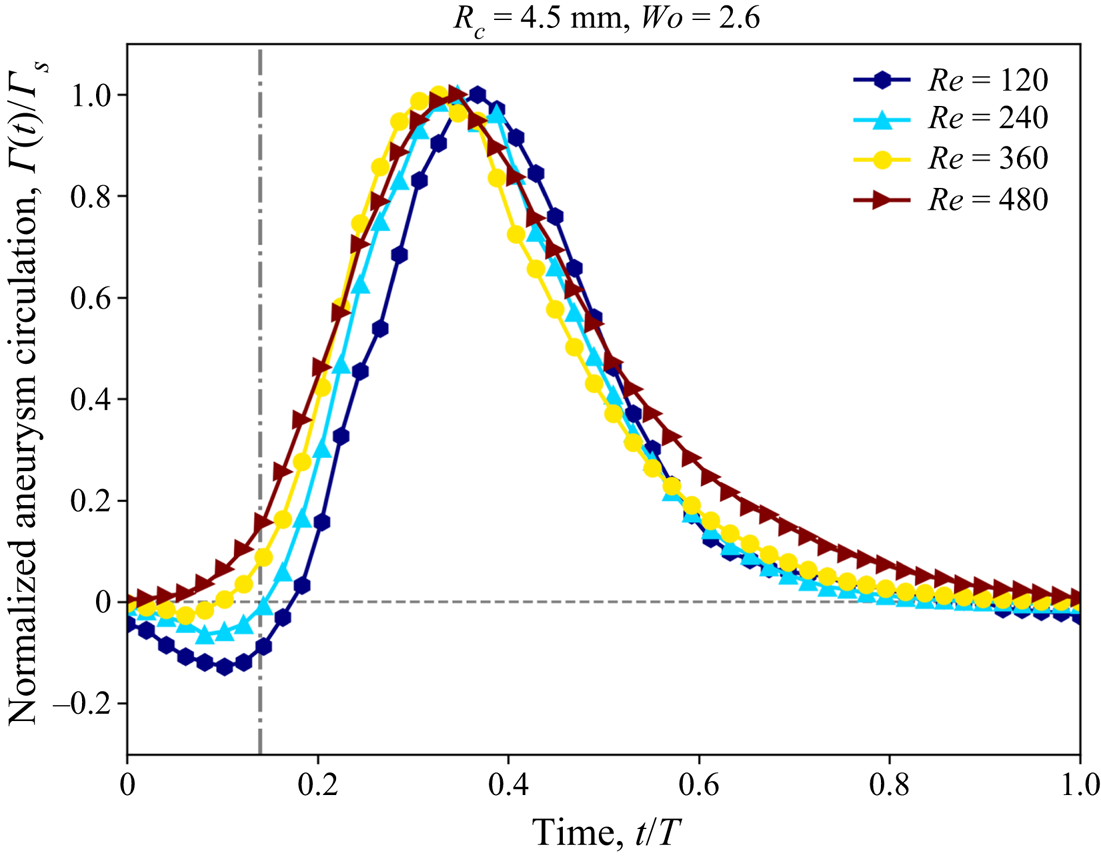
This is further visualized in figure 9, where the the area-averaged vorticity, or aneurysm circulation,  $\varGamma (t)$, is plotted over the cardiac cycle, normalized by the circulation calculated at peak systole,
 $\varGamma _s$, for the same conditions shown in figure 8. The dashed vertical line indicates the snapshot in time where the four panels in figure 8 are shown. At the lowest value of parent vessel
 $\textit {Re}$, the aneurysm circulation becomes negative at the beginning of the cardiac cycle and eventually transitions to positive (indicating primarily separated flow) about one-fifth of the way through the cardiac cycle. As
 $\textit {Re}$ is increased, this transition from attached to separated flow with the average vorticity becoming positive occurs at an earlier point in the cardiac cycle. The time it takes for separation to occur, from the beginning of the cardiac cycle, is defined as the separation time,
 $T_s$.
Aneurysm averaged vorticity plotted across a single cardiac cycle for  $\kappa = 0.22\ \textrm {mm}^{-1}$,
 $Wo = 2.6$. Aneurysm vorticity is normalized by peak systolic vorticity.

Increasing the parent vessel  $Re$ results in an increase of flow entering the aneurysm (figure 6a). As the expansion-based pressure gradient is proportional to
 $Q(t)^2$, and the acceleration-based pressure gradient is only proportional to
 $\partial Q(t)/\partial t$, increasing
 $\textit {Re}$ results in faster growing and dominating adverse pressure gradients. Thus, for the same geometry, an increase in
 $\textit {Re}$ results in separation that occurs earlier in the cardiac cycle.
The transition from attached to separated flow during the cardiac cycle has been previously documented in studies of untreated (Asgharzadeh & Borazjani Reference Asgharzadeh and Borazjani2016) and FDS-treated (Lieber et al. Reference Lieber, Livescu, Hopkins and Wakhloo2002) aneurysms, but only in straight idealized aneurysms. The dependence of the time of separation on inertia and the topology of the flow over a spherical cavity was highlighted by Sobey (Reference Sobey1980), where an increase in free-stream  $Re$ results in lower separation times. Here, we extend that work and also explore the effect of free-stream geometry by varying the curvature and including
 $De$ in the analysis.
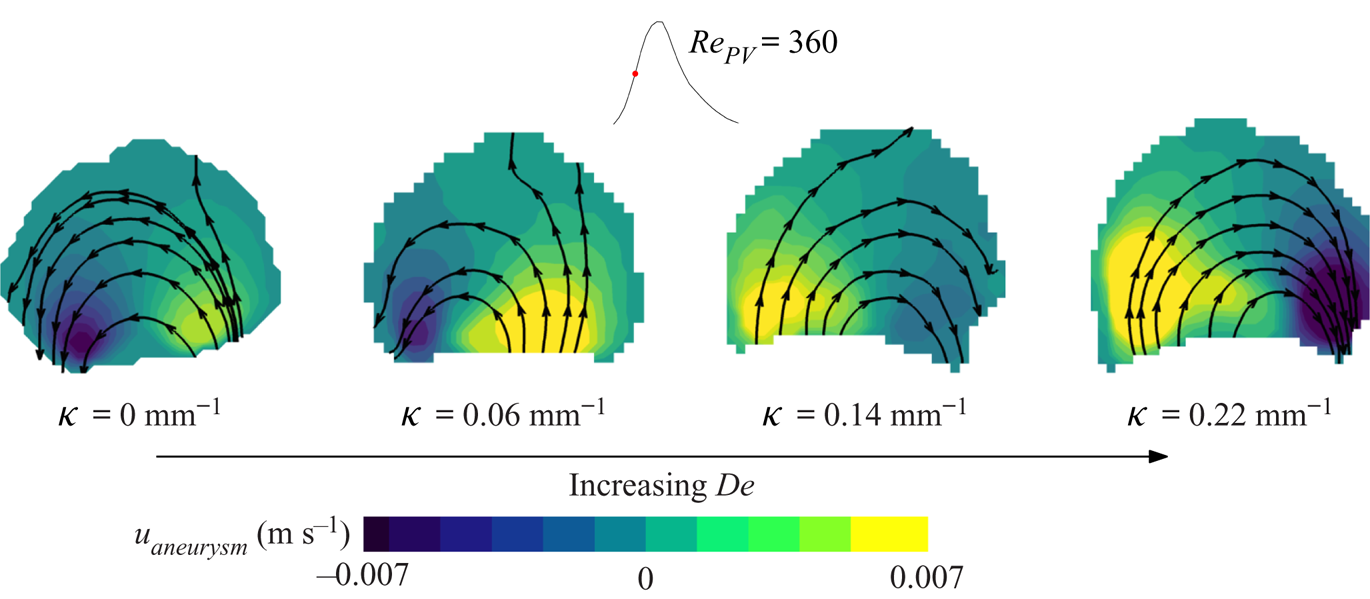
In figure 10, velocity contours and streamlines are plotted for four values of parent vessel curvature, at the same value of  $Re$ (increasing
 $De$). All four panels represent the same instant in the cardiac cycle: halfway through the acceleration phase. As
 $De$ increases, the structure of the flow, at the same instant of time, evolves: the flow remains attached at the lowest value of
 $De$, while it is fully separated at the highest value of
 $De$.
Velocity contours and streamlines at the aneurysm midplane for the condition  $Re=360$,
 $Wo = 2.6$. Each panel highlights a snapshot from the same instant in the cardiac cycle (halfway through acceleration) for increasing values (left to right) of curvature, and thus increasing
 $De$. Velocity contours are of the vertical component of velocity,
 $u_{aneurysm}$.

This is the same behaviour seen in figure 8. At the same instant in the cardiac cycle, vessels with larger curvature, or  $De$, will have more flow entering the aneurysm cavity (figure 6b). With
 $\textit {Re}$ and the waveform fixed for all cases in figure 10, the magnitude of the acceleration gradient is approximately equal at the same moment in time. The adverse pressure gradient, proportional to the flow rate entering the aneurysm, however, will have a larger value at the same instant in time, resulting in flow separation at an earlier time in the cardiac cycle.
In figure 8, by increasing  $\textit {Re}$ while maintaining the vessel curvature,
 $De$ is also increased. This begs the question as to whether flow separation is predominately a
 $\textit {Re}$ or
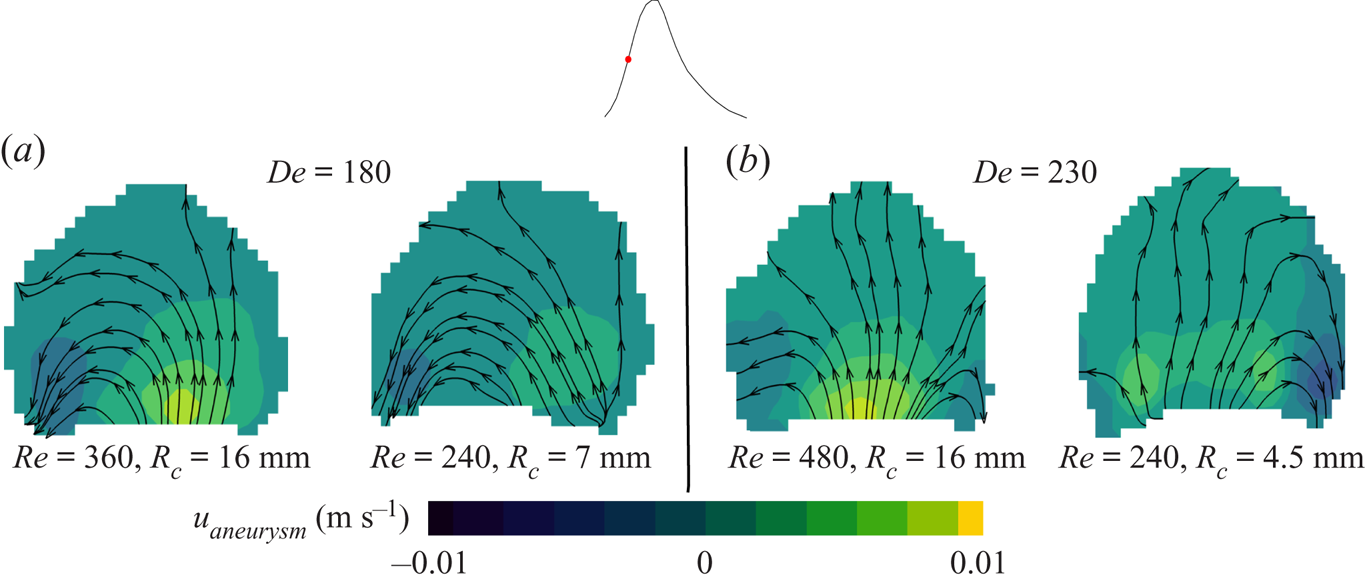
 $De$ effect. In figure 11 each snapshot pair shows streamlines and velocity contours plotted at the same
 $De$, but different
 $\textit {Re}$, at the same instant in the cardiac cycle. Here
 $De$ is matched at different
 $\textit {Re}$ by selecting vessels with different curvature. At both values of
 $De$, the flow patterns are nearly identical despite having different values of parent vessel
 $\textit {Re}$. This suggests that the flow topology inside the aneurysm and the separation time are truly a function of
 $De$ only.
Velocity contours and streamlines for two models with approximately matching  $De$: (a)
 $De\approx 180$ and (b)
 $De\approx 230$. For each snapshot pair, models are selected with different
 $Re$ and
 $R_c$ but matching
 $De$. Velocity contours are of the vertical component of velocity,
 $u_{aneurysm}$.

4.3. Transient inertial effects (Womersley number)
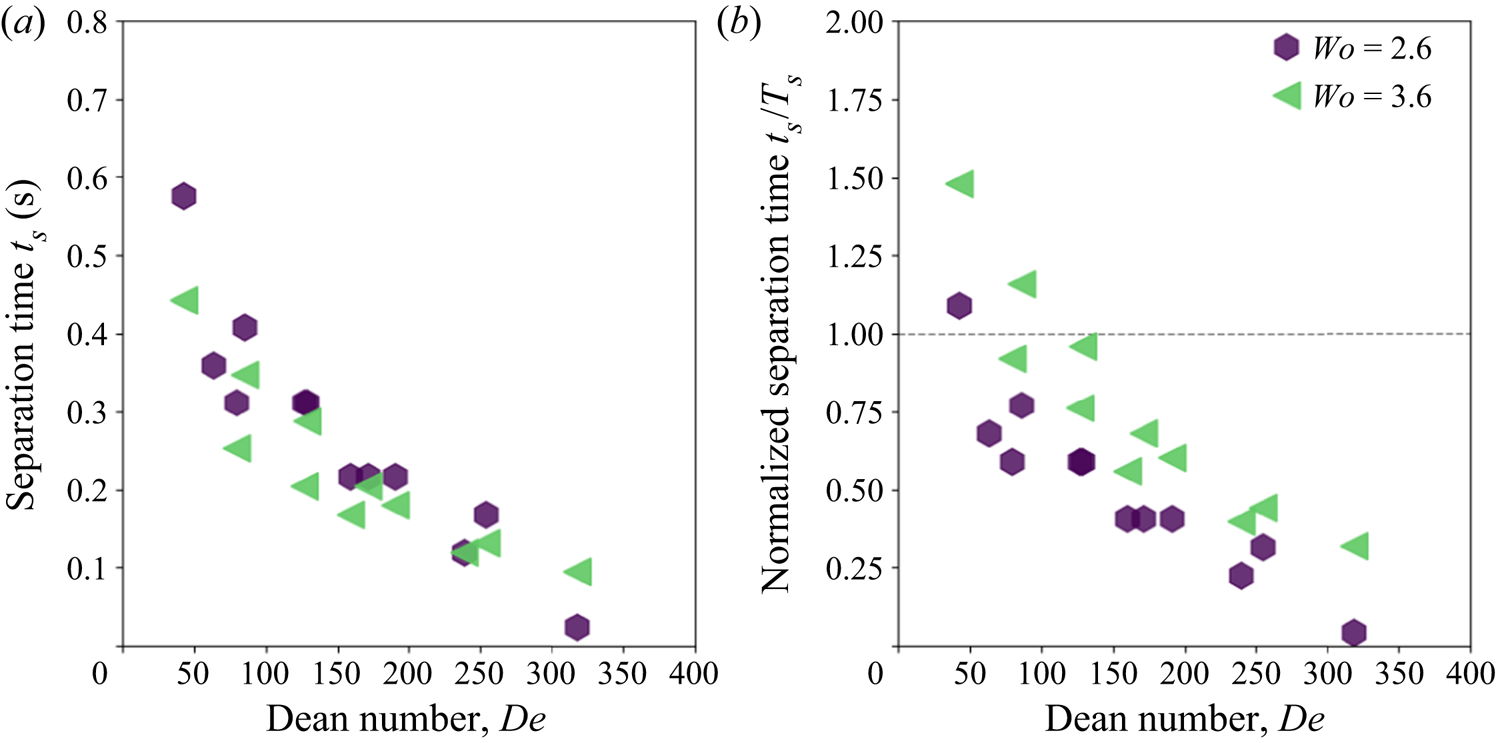
In figure 12(a), the separation time is plotted against parent vessel  $De$ for both values of
 $Wo$. The separation time is shown to decrease with increasing
 $De$, and the functional decay of separation time with
 $De$ is the same for both values of
 $Wo$: at a given
 $De$, separation occurs at the same physical time in the cardiac cycle, regardless of the flow pulsatility (for the range investigated in this paper). Separation time is again plotted against
 $De$ in figure 12(b) but normalized by the time it takes to reach peak systole,
 $T_s$. The horizontal dashed line in figure 12(b) represents the transition in the cardiac cycle between the systolic and diastolic phase of the cardiac cycle. For a given
 $De$, increasing
 $Wo$ causes separation to occur at a later relative phase in the cardiac cycle. By looking at the intersection of the data points and the line
 $t_s/T_s=1$, we can estimate a critical
 $De$ for which separation occurs in the accelerating or decelerating phase of the cardiac cycle. As an increasing
 $Wo$ pushes separation into a later phase of the cardiac cycle, the critical
 $De$ for separation occurring during systole also increases: it takes the values
 $\approx$75 and 150 for
 $Wo= 2.6$ and 3.6, respectively.
(a) Separation time plotted against Dean number and (b) separation time normalized by peak systole ( $T_s)$ for all cases.

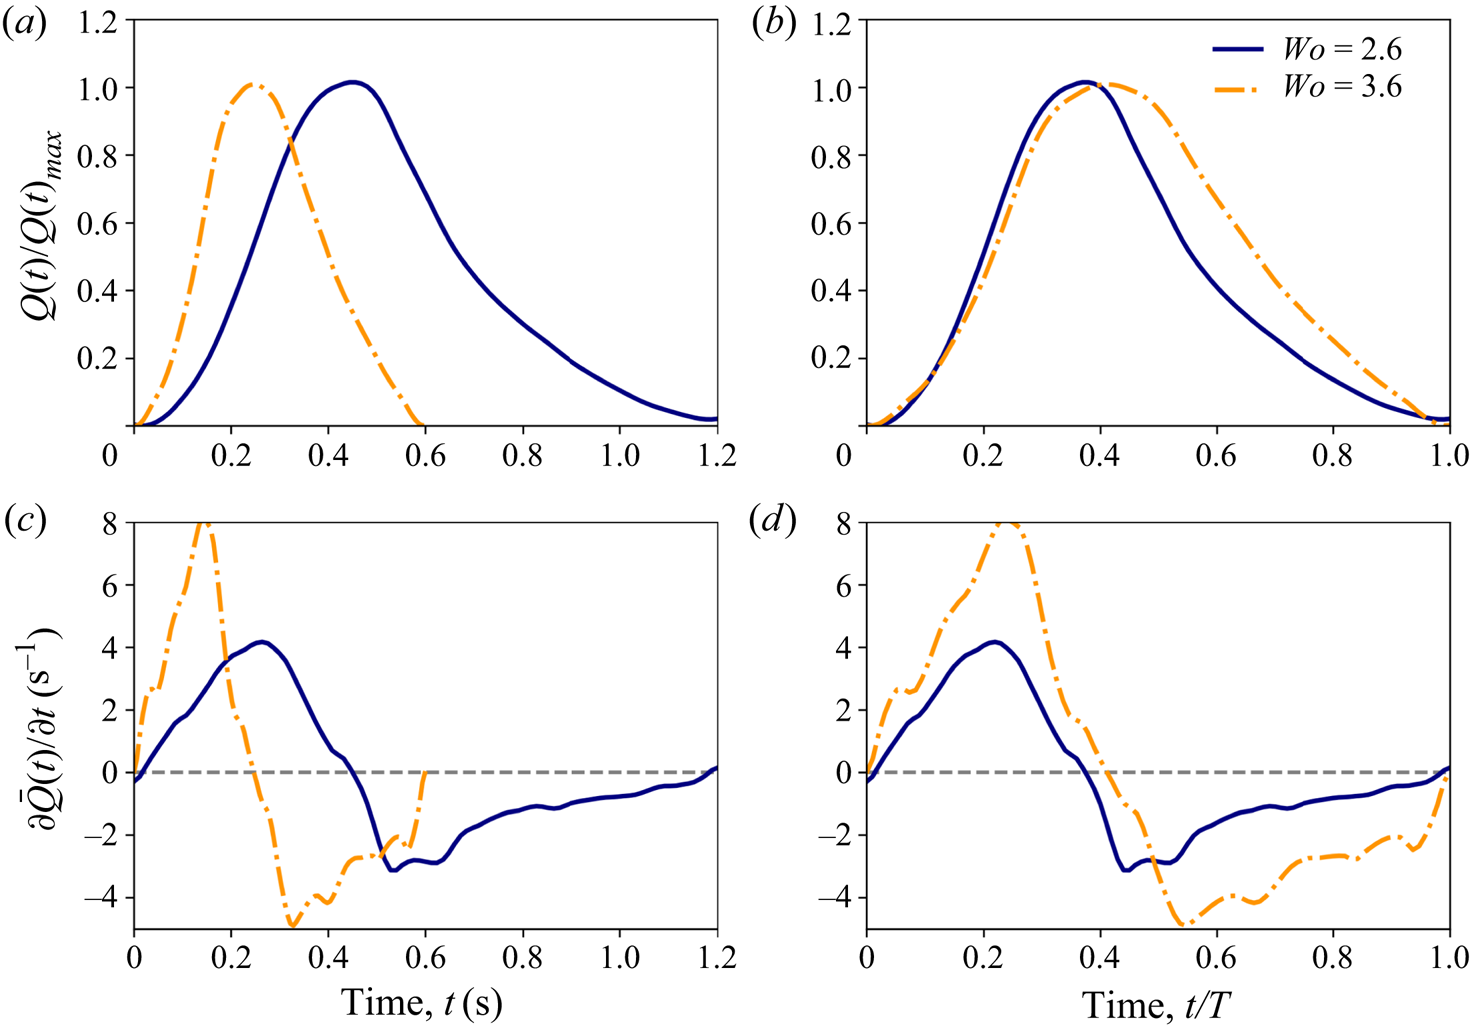
To investigate the effect of  $Wo$, non-dimensional parent vessel flow rate
 $Q(t)/Q_{sys}(t)$ and acceleration
 $\partial Q(t)/\partial t$ are plotted against time, both in dimensional form and non-dimensionalized by the length of the cardiac cycle, for
 $Re=200$ and both values of
 $Wo$ (figure 13). The occurrence of separation is primarily dependent on the interplay between the two pressure gradients which are proportional to these curves. Increasing
 $Wo$ shortens the cardiac cycle which, at the beginning of the cardiac cycle, increases both the magnitude of the instantaneous flow rate and the acceleration as seen in figure 13(a,c). Separation occurs at the same time for both values of
 $Wo$ (at a given
 $De$) because the ratio between the expansion-based and acceleration-based pressure gradients remains the same.
Parent vessel flow rate non-dimensionalized by systolic flow rate  $\bar {Q}$ and plotted against time (a) and time non-dimensionalized by cardiac cycle length (b). Time derivative of flow rate (acceleration) plotted against dimensional time (c) and non-dimensional time (d).

In figure 13(b,d), the same curves are plotted against time, non-dimensionalized by the cardiac cycle period. In the acceleration phase, it can be seen that the magnitude of flow rate is nearly identical for both values of  $Wo$. However, the magnitude of the acceleration is larger for the larger
 $Wo$ case. This suggests that flows with a higher
 $Wo$ are able to remain attached for longer and separate at a later instant in the cardiac cycle, as is seen in figure 12(b). As flow attachment is maintained by this acceleration-based pressure gradient, an increase in
 $Wo$ will also result in a higher critical
 $De$ for separation to occur in the acceleration phase.
In the work by Sobey (Reference Sobey1980), it was shown that separation time depends on both  $Re$ and the frequency of bulk flow pulsatility or Strouhal number (
 $St$). An increase in
 $St$ was shown to increase separation time (non-dimensionalized by period length) for the same value of
 $Re$. The same trend is shown here except that
 $Wo$ replaces
 $St$ and
 $De$ replaces
 $Re$ as we have added the influence of curvature. Sobey (Reference Sobey1980) also discusses a critical
 $Re$ below which separation occurs only in the deceleration phase of the the pulsatile flow phase. This critical separation behaviour is shown to be a function of
 $St$ and, above
 $St$ of 0.1, flow is only able to separate in the deceleration phase of the cycle, regardless of
 $Re$. Values of
 $St$ of the flow waveforms studied here are below 0.1 (
 $St = 0.007$–
 $0.03$), but the trend in figure 12(b) suggests that further increases in
 $Wo$ would eventually result in a condition where separation only occurs in the deceleration phase of the cardiac cycle.
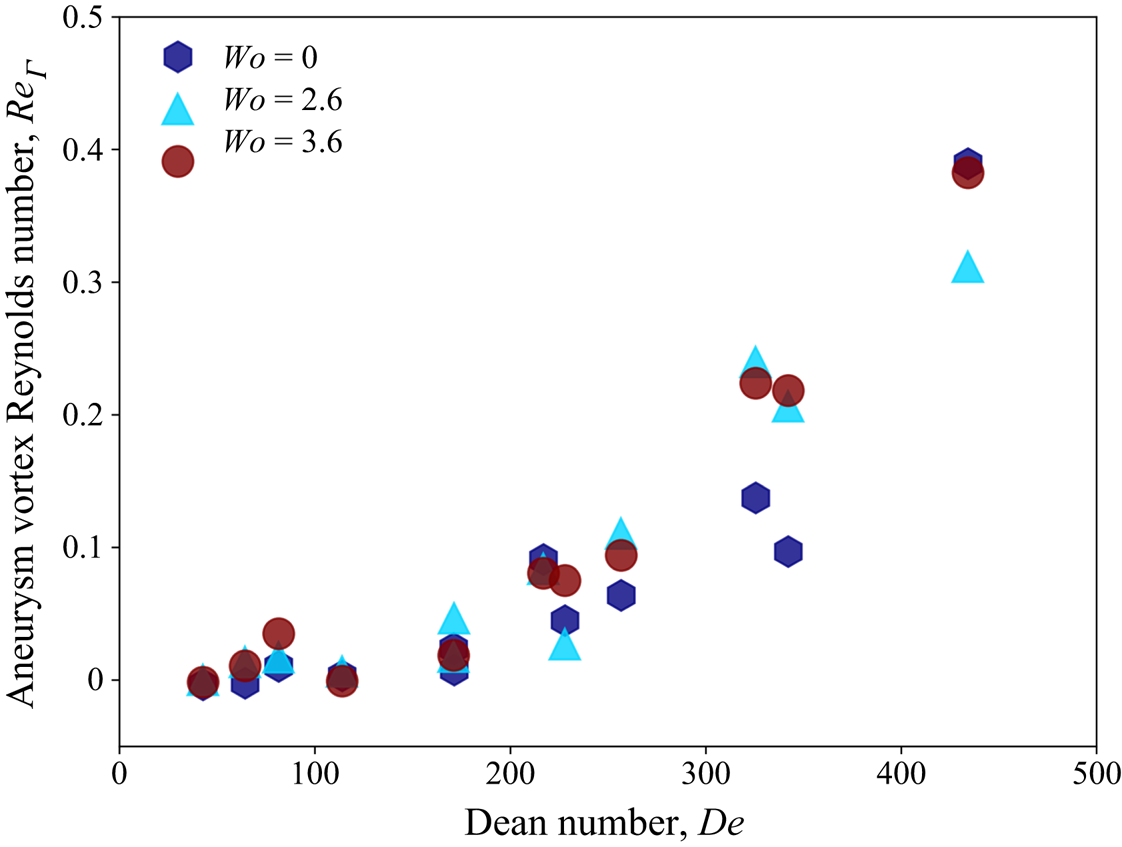
The effect of unsteady flow on Eulerian metrics is investigated by calculating the Reynolds number based on the circulation inside the aneurysmal sac,  $Re_{\varGamma } = \varGamma _{Aneurysm} /\nu$. In figure 14,
 $Re_{\varGamma }$ is plotted against
 $De$ for all values of
 $Wo$ investigated here, including steady flow (
 $Wo=0$). For pulsatile cases,
 $Wo = 2.6$ and
 $3.6$, the circulation inside the aneurysm is phase-averaged over the cardiac cycle. First, it can be seen that the strength of the vorticity inside the aneurysm is a function of
 $De$, with the strength of vorticity increasing with increasing
 $De$. The cycle-averaged vortex strength for both values of
 $Wo$ is also shown to be equivalent for a given
 $De$, with the phase-averaged values for pulsatile cases equalling the corresponding steady flow values (
 $Wo=0$). This suggests that pulsatility has little influence on the phase-averaged values of vortex strength inside the aneurysm for the parameter range studied here.
Aneurysm vortex Reynolds number as a function of Dean number for all values of Womersley number.

In a numerical analysis, Asgharzadeh & Borazjani (Reference Asgharzadeh and Borazjani2016) investigated the effect of  $Re$ and
 $Wo$ on the vortex structure in untreated idealized and patient-specific aneurysm models. It was shown that
 $Wo$ has little effect on the structure and characteristics of the primary aneurysm vortex, but that it did affect the location of the vortex at different instances of the cardiac cycle. This is similar to the findings presented here where the primary structure of the aneurysm flow field and cycle-averaged metrics are not impacted by
 $Wo$ (in the range studied here) but the temporal evolution of the aneurysm vortex during the cardiac cycle is affected.
Due to the FDS, the aneurysm vortex Reynolds number is small ( $Re_{\varGamma }<1$). Thus, the viscous-dominated aneurysm flow behaves similarly to a linear Stokes flow where cycle-averaged metrics for pulsatile flows are equal to the steady flow values with the same mean free-stream flow. At higher values of aneurysm
 $Re$, we would expect that the curves shown in figure 14 would begin to diverge but, for the parameter range studied here that is representative of the physiological values in FDS-treated cerebral aneurysms,
 $Wo$ is shown to have little influence on the characteristics of the flow, and
 $De$ is the driving non-dimensional parameter (centrifugal inertia in the parent vessel injecting flow into the aneurysm cavity is the main mechanism).
5. Comparison of fluid mechanics inside untreated (Part 1) and FDS-treated (Part 2) aneurysms
5.1. Steady free-stream flow
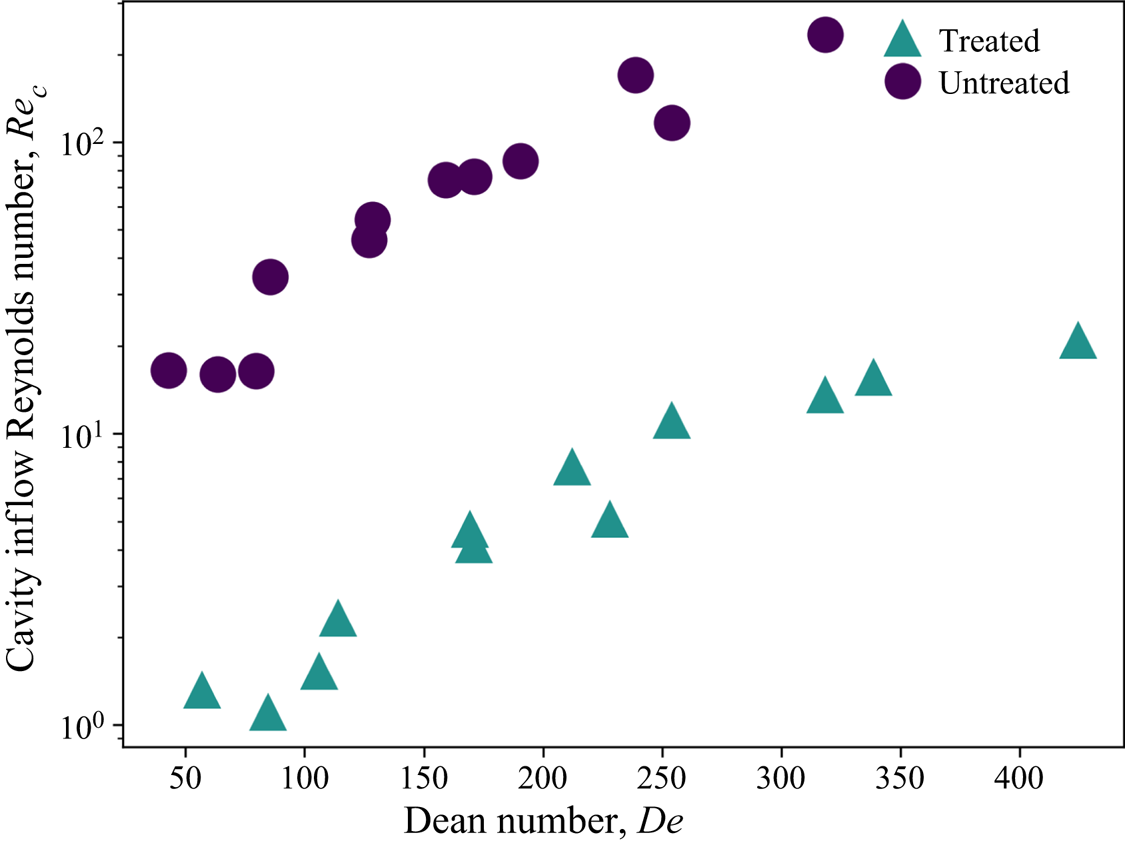
The primary function of FDS treatment is to restrict flow into the aneurysmal cavity and create an environment inside the aneurysmal sac that promotes the growth of a stable thrombus, isolating the aneurysmal wall from mechanical stresses associated with the flow of blood and, thus, reducing the risk of rupture. In figure 15, the Reynolds number computed from the average inflow velocity measured at the neck of the aneurysm,  $Re_{neck}$, is plotted as a function of parent vessel
 $De$ for treated and untreated cases under steady free-stream flow conditions. Across the entire range of
 $De$ studied, the magnitude of velocity entering the aneurysm is approximately an order of magnitude lower in the treated than in the untreated cases. Additionally, the degree or magnitude of flow reduction is nearly constant across all values of
 $De$, as is evident in figure 15.
Cavity inflow Reynolds number as a function of Dean number for treated and untreated models.

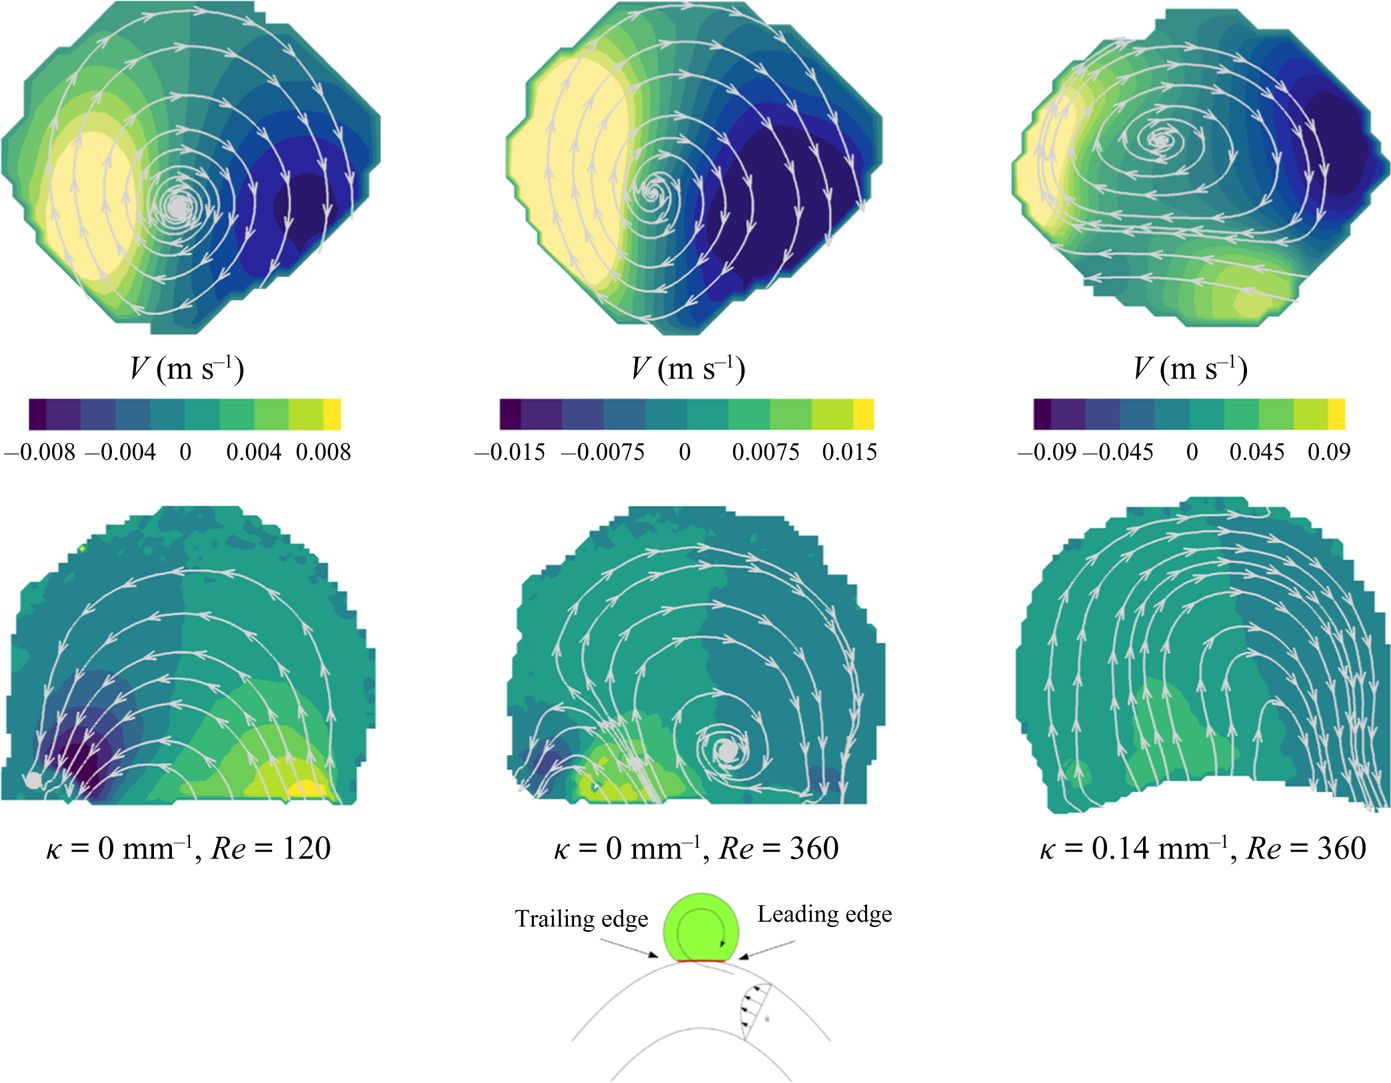
This significant reduction in aneurysmal flow results in markedly different flow topologies in the aneurysmal cavity. From figure 3 in Part 1 (Chassagne et al. Reference Chassagne, Barbour, Chivukula, Machicoane, Kim, Levitt and Aliseda2021), the flow is shown to be separated at the cavity leading edge, and rotating in the direction opposite to the free-stream flow for all vessels (with different curvatures) and all values of  $Re$. However, in figure 3 in the present paper, the flow field remains attached to the aneurysmal wall at low
 $De$ and begins to separate forming a counter-rotating vortex as
 $De$ increases. A comparison between three treated (bottom) and untreated (top) flow fields for the same conditions is shown in figure 16. The first two cases are for straight vessels (
 $\kappa = 0.0$ mm
 $^{-1}$) at
 $Re$ of 120 and 360. For both untreated cases, the flow is fully separated with a single counter-rotating vortex inside the cavity. For the treated model, the flow remains fully attached at the lowest
 $Re$, but begins to separate at the higher
 $Re$ (in the second panel). The third panel shows the flow fields for a higher-curvature vessel (
 $\kappa = 0.14$ mm
 $^{-1}$) and
 $Re$ of 140. At this higher
 $De$, both flow fields exhibit the same topology, but the magnitude of velocity and circulation is much higher in the untreated case.
Streamlines plotted at the aneurysm midplane for untreated (top) and treated (bottom) cases.

Separation in the aneurysm cavity occurs when the adverse pressure gradient that results as flow expands into the aneurysm is greater than the inertia in the parent vessel near the wall, at the aneurysmal leading edge. For the flow to remain attached at the leading edge, the flow near the aneurysmal wall must be sufficiently slow to enable viscous forces to dominate over inertia. This condition is only achieved, in the flow regimes relevant for cerebral aneurysm, when a FDS is placed across the neck of the aneurysm and flow entering the sac is significantly restricted.
5.2. Unsteady flow
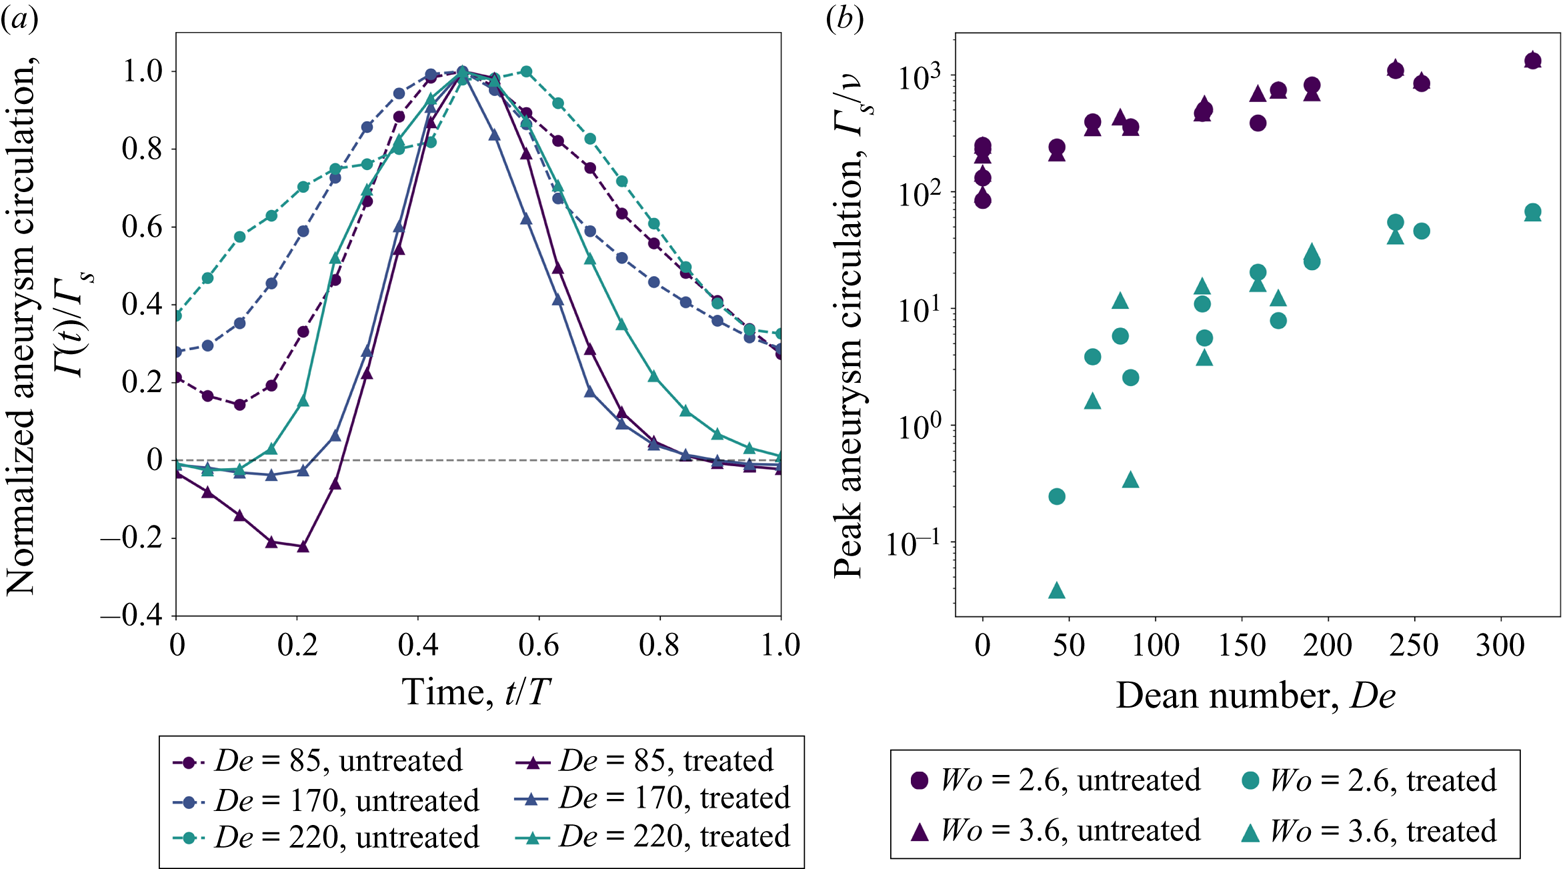
For unsteady free-stream flow conditions, the trends are similar to those for the steady free-stream conditions: the magnitude of flow entering the aneurysm is decreased for treated cases resulting in large differences in the topology of the flow that develop across the duration of a cardiac cycle. In Part 1 (Chassagne et al. Reference Chassagne, Barbour, Chivukula, Machicoane, Kim, Levitt and Aliseda2021), the flow in the aneurysm was shown to be counter-rotating for the entirety of the cardiac cycle, for all conditions. The flow vorticity inside the aneurysm increases and decreases throughout the cardiac cycle but the primary structure of the aneurysm flow remains unchanged with a single counter-rotating vortex persisting in the aneurysm cavity. In the present Part 2, it is shown that at low values of  $De$ the flow in the aneurysm cavity is attached at the beginning of the cardiac cycle, and separates only during the deceleration phase of the cardiac cycle. At higher values of
 $De$, the instant at which the flow becomes separated and counter-rotates shifts earlier towards the start of the systolic phase, but all cases start the cardiac cycle in the co-rotating, attached flow topology.
In figure 17(a), the circulation inside the aneurysm is normalized by peak circulation and plotted throughout the cardiac cycle for three conditions, for both treated and untreated cases. For all of the treated vessels, at the start of the cardiac cycle the vorticity is negative indicating attached flow. Circulation becomes positive, indicating primarily separated flow inside the aneurysm, during the first third of the cardiac cycle. As  $De$ increases, this transition point, from co-rotating to counter-rotating flow, happens earlier in the cardiac cycle (figure 12). For the untreated cases, the circulation is positive (separated flow) throughout the entire cardiac cycle and the baseline magnitude of circulation as a percentage of peak circulation increases with increasing
 $De$. The higher the value of
 $De$, the more momentum is maintained from the previous acceleration phase, resulting in higher values of circulation at the start of a new cardiac cycle.
(a) Aneurysm circulation normalized by peak circulation (systole) plotted throughout the cardiac cycle for three representative models ( $Wo = 2.6$ for all models). (b) The magnitude of peak circulation plotted as a function of Dean number for treated and untreated models at
 $Wo= 2.6$ and 3.6.

In figure 17(b), the peak circulation is plotted as a function of  $De$ for treated and untreated cases at
 $Wo = 2.6$ and 3.6. For both treated and untreated cases, the value of peak circulation increases with increasing
 $De$. Again, there exists an approximate 10-fold reduction in the magnitude of peak circulation between the untreated and treated cases. The exception is the circulation at the lowest values of
 $De$, where there is a 1000-fold reduction in circulation for the treated case, compared to the untreated. For treated cases, the flow starts the cardiac cycle attached to the wall and separates during the deceleration phase. This late transition to counter-rotating flow delays the development of a counter-rotating aneurysm vortex, and prevents the vortex from reaching a significant strength, as it does for conditions that start the cardiac cycle in the separated flow topology. While the effect of
 $Wo$ on values of peak circulation is negligible for the untreated cases and the treated cases with higher
 $De$, there is larger variation in peak circulation between
 $Wo = 2.6$ and
 $Wo = 3.6$ at low values of
 $De$ for treated cases. This subset of cases, treated with small
 $De$, is most significantly affected by flow switching (from attached to separated flow). Thus, for a given
 $De$, the vorticity in cases with a higher
 $Wo$, or shorter cardiac cycle, has less time to develop and tends to have a smaller peak circulation value than cases with a smaller
 $Wo$.
6. Conclusions
In this study, the fluid mechanics of cerebral aneurysms is characterized in detail, by varying the three key non-dimensional parameters:  $Re$,
 $De$ and
 $Wo$. Treatment with a FDS restricts flow into the aneurysm, resulting in significantly lower velocities inside the aneurysm than in the parent vessel. As a result, the flow inside the aneurysm is dominated by viscous effects and behaves similar to a linear Stokes flow in a side cavity, despite
 $Re$ in the parent vessel being in the range 100–600.
Under steady free-stream conditions, the flow topology in the aneurysm is shown to be a function of  $De$ only. At low values of
 $De$, the flow enters the aneurysm at the leading edge and remains attached to the aneurysm wall with a single vortex inside the aneurysm that rotates with the direction of the free-stream flow – a flow characteristic that is found in low-
 $Re$ flow over cavities (Higdon Reference Higdon1985). As
 $De$ increases, secondary flow instabilities develop in the parent vessel and higher flow rate enters the aneurysm cavity, increasing the magnitude of the adverse pressure gradient at the leading edge of the aneurysm. Eventually this adverse pressure gradient overcomes the parent vessel inertia near the wall, and the flow at the leading edge of the aneurysm separates. This forms a recirculating vortex that competes with the co-rotating vortex induced by viscous flow and grows with increasing
 $De$ until a single counter-rotating vortex exists inside the aneurysm. The transition between these two flow topologies, from attached to recirculating, is shown to depend on the slope of the axial velocity at the leading edge of the aneurysm neck, which scales with
 $De$.
The aneurysm flow topology follows a similar pattern under pulsatile free-stream conditions, except that the evolution from attached to separated flow occurs over the course of a single cardiac cycle. At the beginning of the cardiac cycle, with the parent vessel  $De$ at its lowest, the flow remains fully attached to the aneurysmal cavity for all cases studied, and rotates with the direction of the free-stream flow. As the flow accelerates, and the cardiac cycle moves closer to peak systole, the flow at the leading edge begins to separate and the recirculation vortex that is formed continues to grow throughout the cardiac cycle until it encompasses the entire aneurysm cavity. The instant in the cardiac cycle at which the aneurysm flow separates is shown to be a function of parent vessel
 $Wo$ and phase-average
 $De$. All values of phase-average
 $De$ studied here, which encompass the relevant haemodynamics range for the cerebral circulation, resulted in separated flow in the untreated cases. An increase in phase-average
 $De$ is shown to reduce the separation time, pushing it closer to the start of the cardiac cycle. For a given
 $Wo$, a critical
 $De$ exists above which flow separates in the accelerating or systolic phase of the cardiac cycle. Increasing
 $Wo$ is shown to delay the separation time, pushing it closer to diastole for a given
 $De$. Thus, the critical
 $De$ required for separation to occur before peak systole also increases with
 $Wo$.
The aneurysm inflow velocity and circulation are shown to increase with increasing  $De$. The magnitude of the flow rate into the aneurysmal sac depends on the parent vessel radial velocity and on the resistance, or porosity, of the stent. In Dean flows, the radial velocity at the centre of the vessel increases with increasing
 $De$ due to the radial pressure gradient and inertial instability. The
 $Re$ inside the aneurysm is low (
 $Re<1$) and, as a result,
 $Wo$ is found to have minimal effect on time-average aneurysm circulation: mean values from pulsatile flow conditions are almost identical to those for the equivalent steady free-stream conditions. Differences in peak circulation between the two pulsatile
 $Wo$ cases are found only in the treated models, and then only at the lowest values of
 $De$, corresponding exactly to the narrow parameter range significantly impacted by flow switching.
Upon comparing the haemodynamics of treated (Part 2) and untreated (Part 1, Chassagne et al. Reference Chassagne, Barbour, Chivukula, Machicoane, Kim, Levitt and Aliseda2021) aneurysms, a marked difference is characterized fully for the first time. The addition of FDSs is shown to reduce the magnitudes of the flow rate entering the aneurysm and of the peak vorticity by an order of magnitude. The hydraulic resistance associated with the stent reduces the aneurysm Reynolds number into a region where the fluid mechanics are viscous-dominated, resulting in the interesting change in flow topologies described.
6.1. Clinical implications
Flow-diverting stents are designed to induce the formation of a stable aneurysm thrombus by redirecting blood flow away from the aneurysm, thus reducing mechanical stresses inside the aneurysm sac and mitigating the risk of rupture (Lieber et al. Reference Lieber, Stancampiano and Wakhloo1997; Rajah, Narayanan & Rangel-Castilla Reference Rajah, Narayanan and Rangel-Castilla2017). While the exact biomechanical mechanisms that result in a stable thrombus inside the aneurysm remain unknown, the process is believed to follow a pattern similar to that of physiological clotting – platelet activation, aggregation and fibrin clot stabilization/maturation (Ngoepe et al. Reference Ngoepe, Frangi, Byrne and Ventikos2018). Crucial to this process is the creation of a haemodynamic environment inside the aneurysm that enables platelet aggregation – flow stasis and increased platelet residence time (Hathcock Reference Hathcock2006; Rajah et al. Reference Rajah, Narayanan and Rangel-Castilla2017; Tomaiuolo, Brass & Stalker Reference Tomaiuolo, Brass and Stalker2017).
Multiple in vitro (Lieber et al. Reference Lieber, Stancampiano and Wakhloo1997; Babiker et al. Reference Babiker, Gonzalez, Ryan, Albuquerque, Collins, Elvikis and Frakes2012) and in silico (Damiano et al. Reference Damiano, Ma, Xiang, Siddiqui, Snyder and Meng2015) studies have demonstrated the effectiveness of FDSs for restricting the amount of blood flow that enters the aneurysmal sac. Image-based computational studies have linked the post-treatment haemodynamics environment to treatment outcomes, suggesting that a threshold of reduction of stresses or flow velocities inside the aneurysm exists and must be surpassed for successful aneurysm embolization to occur (Kulcsár et al. Reference Kulcsár, Augsburger, Reymond, Pereira, Hirsch, Mallik, Millar, Wetzel, Wanke and Rüfenacht2012; Mut et al. Reference Mut, Raschi, Scrivano, Bleise, Chudyk, Ceratto, Lylyk and Cebral2015; Paliwal et al. Reference Paliwal, Damiano, Davies, Siddiqui and Meng2017). Most recently an in vivo study using four-dimensional magnetic resonance imaging (Su et al. Reference Su, Reymond, Brina, Bouillot, Machi, Delattre, Jin, Lövblad and Vargas2020) and an image-based computational fluid dynamics study (Chen et al. Reference Chen, Zhang, Tian, Li, Zhang, Zhang, Liu and Yang2019) separately linked FDS treatment failure with the existence of a strong inflow jet into the aneurysm sac.
The results presented in this study show that the parent vessel  $De$ has a significant impact on the amount of flow entering an aneurysm, both before and after being treated with a FDS. As seen in figures 6(a) and 14, an increase in either parent vessel flow rate or curvature causes an increase in aneurysm flow velocity and circulation. When comparing the highest-curvature vessel to the straight vessel, the increase in aneurysm velocity is almost eightfold, every other parameter being held constant. The increased hydraulic resistance of the FDS used here results in approximately an order of magnitude reduction of aneurysm cavity
 $Re$ and peak circulation (figures 15 and 17b). However, we show here that the magnitude of these values increases with
 $De$ for both treated and untreated cases, and at
 $De$ of
 $\approx$400, the amount of flow entering the aneurysm and the cavity circulation for the treated case are equal to those values for the untreated case at the lowest
 $De$ (
 $\approx$50). In other words, the flow entering an untreated aneurysm on a straight or slightly curved vessel is equal to that of an aneurysm located on a vessel of high curvature that is treated with a FDS. Thus, increases in parent vessel
 $De$ may significantly compromise the ability of FDS treatment to achieve the necessary reduction in flow rate, velocity and circulation, and the associated necessary increase in residence time inside the aneurysmal sac for successful aneurysm embolization.
Previous studies have shown the influence of parent vessel geometry (Imai et al. Reference Imai, Sato, Ishikawa and Yamaguchi2008; Kim et al. Reference Kim, Taulbee, Tremmel and Meng2008; Augsburger et al. Reference Augsburger, Farhat, Reymond, Fonck, Kulcsar, Stergiopulos and Rüfenacht2009) and flow rate (Lieber et al. Reference Lieber, Livescu, Hopkins and Wakhloo2002; Morales et al. Reference Morales, Bonnefous, Geers, Brina, Pereira, Spelle, Moret and Larrabide2016) on aneurysm haemodynamics, and that increased vessel curvature or parent vessel  $Re$ reduces the efficacy of FDS treatment. In a computational study, Imai et al. (Reference Imai, Sato, Ishikawa and Yamaguchi2008) investigated the effect of parent vessel geometry on the inflow into untreated sidewall aneurysms by simulating steady flow through arterial bends of different shape. These results showed that the development of secondary flows, established by proximal arterial geometry, is the driving mechanism for aneurysm inflow rate, supporting the importance of
 $De$ in aneurysm haemodynamics. Kim et al. (Reference Kim, Taulbee, Tremmel and Meng2008) conducted particle image velocimetry analysis of sidewall aneurysm models treated with two different FDSs with increasing values of parent vessel curvature. Using a constant steady inflow condition, it was shown that the ability of FDSs to reduce aneurysm inflow rate and increase flow stasis was significantly diminished when placed in vessels with high curvature. The reduction of efficacy in models with high curvature is attributed to increasing inertia-driven flow. In a similar experimental study, Augsburger et al. (Reference Augsburger, Farhat, Reymond, Fonck, Kulcsar, Stergiopulos and Rüfenacht2009) compared the particle image velocimetry flow field in two sidewall aneurysms: one on a straight vessel and the other on a vessel with high curvature. Subjected to the same pulsatile inflow condition, it was shown that velocity and vorticity values were generally 2–3 times higher in the high-curvature model than in the straight model. Lieber et al. (Reference Lieber, Livescu, Hopkins and Wakhloo2002) measured the flow field in a sidewall aneurysm located on a straight vessel under increasing inflow rates. Similar to the results presented here, the addition of a FDS caused an order-of-magnitude reduction in mean circulation. The direction of the flow in the stented cases was additionally shown to be primarily opposite to that of the unstented case, in agreement with results presented here for a certain range of the parameter range (but not for other cases), as shown in figure 16. In a computational study, Morales et al. (Reference Morales, Bonnefous, Geers, Brina, Pereira, Spelle, Moret and Larrabide2016) investigated the effect of inlet flow rate on 25 patient-specific models, and found that across all models, stent performance diminished with increasing inlet flow rate or parent vessel
 $Re$. The combination of the above studies produces a mosaic of evidence that parent vessel geometry (
 $\kappa$) and flow conditions (
 $Re$, pulsatility) significantly impact the degree to which flow diversion is successful. The results presented in this paper fully describe this behaviour across the entire three-parameter space, complementing the earlier evidence produced by those seminal studies, showing that the effect of flow and geometry in haemodynamics, which in principle depends on three independent non-dimensional numbers that characterize inertia, can be understood through a single non-dimensional number:
 $De$.
There are several practical limitations to this study, which limit the applicability of this work directly to clinical problems. A single type of FDS was investigated, and always for vessels of constant diameter, while in clinical practice, both the stent design (Lieber et al. Reference Lieber, Livescu, Hopkins and Wakhloo2002; Wang et al. Reference Wang2016) and the ratio of vessel diameter to intended deployment diameter (Makoyeva et al. Reference Makoyeva, Bing, Darsaut, Salazkin and Raymond2013) impact the stent porosity and subsequent degree of flow diversion. Additionally, the aneurysms investigated all have the same geometry: spherical, sidewall aneurysms located on a single bend or straight vessel. In reality, aneurysm morphology, proximal arterial geometry and the aneurysm location will have an impact on the aneurysm haemodynamics. Previous studies have shown that size and shape of aneurysms have minimal effect on inflow patterns, but that the location of the aneurysm in relation to the secondary flows that develop due to the vessel's curvature can have an impact on the aneurysm velocity field, leading to a higher degree of three-dimensionality than studied here (Imai et al. Reference Imai, Sato, Ishikawa and Yamaguchi2008). As the location of the aneurysm moves away from the apex position, the degree to which the aneurysm flow patterns change will depend on the inertia of the inflow jet induced by the secondary flow at the aneurysm neck opening.
Wall distensibility was not considered in this study, partially due to the growing consensus that compliance in the aneurysmal wall has a smaller influence on intracranial aneurysm flow than most of the other sources of uncertainty in patient-specific models, such as patient parent vessel flow, segmentation error in the analysis, etc. In a summary of studies comparing the differences between rigid-wall and fluid–structure interaction simulations of cerebral aneurysms, Sarrami-Foroushani, Lassila & Frangi (Reference Sarrami-Foroushani, Lassila and Frangi2017) showed that the rigid-wall assumption often results in a small overestimation of haemodynamic metrics of the order of 10 %, such as wall shear stress, but that the main flow features are preserved. In an experimental analysis of the flow inside untreated cerebral aneurysms, the addition of wall compliance was shown to affect the phase shift of the flow fields and the development of small-scale flow features near the aneurysm wall that were not found in the rigid model (Tupin, Saqr & Ohta Reference Tupin, Saqr and Ohta2020). However, the characteristics of the primary aneurysm vortex were preserved throughout the cardiac cycle between both rigid and compliant models. By not accounting for the wall motion in this study, the magnitude of the computed metrics shown here may be slightly overestimated, and there may be a shift in the separation time that is not represented here, but the primary findings of the dependence of inflow velocity, vortex direction and separation time on  $De$ are robust to the effect of this patient-specific factor.
The analysis in this study focuses on the velocity field inside the aneurysm and on Eulerian metrics. However, the formation of a stable aneurysm thrombus depends on a number of factors not entirely predicted by the metrics presented, including the biomechanical signalling processes that occur between the aneurysm wall and the detailed platelet dynamics necessary for clot formation, growth and stabilization (Rajah et al. Reference Rajah, Narayanan and Rangel-Castilla2017; Ngoepe et al. Reference Ngoepe, Frangi, Byrne and Ventikos2018). A number of researchers are attempting to correlate metrics that capture these processes, including wall shear stress (Mut et al. Reference Mut, Raschi, Scrivano, Bleise, Chudyk, Ceratto, Lylyk and Cebral2015; Paliwal et al. Reference Paliwal, Damiano, Davies, Siddiqui and Meng2017) and platelet residence time and shear history (Marsh et al. Reference Marsh, Barbour, Chivukula, Chassagne, Kelly, Levy, Kim, Levitt and Aliseda2020), with the outcome of patients treated by FDS. Efforts are also ongoing to incorporate models of thrombus formation into computational studies of idealized aneurysms and providing new insights into the detailed mechanisms of successful aneurysm occlusion (Ngoepe et al. Reference Ngoepe, Frangi, Byrne and Ventikos2018). While the bulk velocity and vorticity fields presented here govern the fluid mechanics inside the aneurysmal cavity and at the wall, and, thus, the residence time inside the aneurysm cavity, the Eulerian representation of the aneurysm flow field cannot contain the full history of platelet stress/signalling as Lagrangian metrics can (Marsh et al. Reference Marsh, Barbour, Chivukula, Chassagne, Kelly, Levy, Kim, Levitt and Aliseda2020). This study provides a first step in the full description of intra-aneurysmal haemodynamics, a full parametric (for all three fluid dynamics parameters) characterization of the bulk flow dynamics in FDS-treated cerebral aneurysms, providing new insights into how to understand the limitations of FDS treatment in the context of fundamental fluid dynamics.
Understanding the failure modes of current endovascular aneurysm treatments will enable the development of improved treatment modalities in the future, and may help clinicians prescribe treatments with the highest likelihood of success. In this work, we have shown that the flow entering sidewall aneurysms treated with FDS depends significantly on the parent vessel  $De$. At high values of
 $De$, the efficacy of FDS therapy may be significantly impaired, and other treatment options, such as multiple FDSs or a coil embolization, may have a higher likelihood of treatment success.
Funding
This work has been financially supported by the NIH/NINDS (grants 1R03NS078539 and 1R01NS088072). This work was also supported by an unrestricted grant in the form of the pipeline devices to our academic institution from Medtronic Inc., which had no role in the experimental design, data analysis or scholarship of this work.
Declaration of interest
The authors report no conflict of interest.
Author contributions
M.C.B. and F.C. contributed equally to this paper.