




No CrossRef data available.
THE ASYMPTOTIC EFFICIENCY OF COINTEGRATION ESTIMATORS UNDER TEMPORAL AGGREGATION
Published online by Cambridge University Press: 08 January 2003
Abstract
This paper examines the effects of temporal aggregation on the asymptotic variances of estimators in cointegrated systems. Two important findings are obtained. First, estimators based on flow data alone are more efficient than when the data are all stocks or a mixture of stocks and flows. Second, estimators based on flow data are as efficient as when the data are recorded continuously. A method of improving efficiency with stock variables is also proposed, and an empirical illustration of the method is provided in the context of long-run money demand regressions.I thank Roy Bailey, Rex Bergstrom, Roderick McCrorie, a co-editor, and two anonymous referees for helpful comments. I also thank Katsumi Shimotsu for help with some data issues. None of these individuals are implicated, however, in any possible shortcomings of this paper. The financial support provided by the ESRC under grant R000221818 is gratefully acknowledged.
Information
- Type
- Research Article
- Information
- Copyright
- © 2003 Cambridge University Press
1. INTRODUCTION
Asymptotic efficiency is a desirable feature for any estimator to possess, not least cointegration estimators. Many, though by no means all, of the estimators of cointegration relationships that have been proposed can be shown to be efficient within a certain class of estimators. Saikkonen (1991) characterizes asymptotic efficiency in the context of cointegration estimators and also proposes an efficient regression estimator of cointegrating parameters, whereas Phillips (1991b) uses the term optimal estimator to describe certain maximum likelihood estimators that are efficient within the class of estimators considered by Saikkonen (1991).
The analysis of the asymptotic efficiency of estimators in general, including the case of cointegration, takes the observed data series as given. In practice, however, the way in which measurements of the values of a variable are made depends on the nature of the variable itself. To give a simple example, the measurement of consumers' expenditure (a flow variable) requires observing the accumulated flow of expenditure over a particular time interval, and hence the observations have a time dimension associated with them (e.g., dollars per quarter or per annum). On the other hand, the measurement of the price of a commodity, or of an interest rate, can in principle be conducted almost at any point in time, these being examples of stock variables. As a result, the information content of these two types of observation schemes is rather different. Observations on flow variables contain information concerning the unobservable rate of flow during the interval over which the observation is made (effectively, an integral of the underlying rate of flow is being observed). Observations on stock variables, however, do not contain such information, being just point observations of an underlying process at given points in time. Although both types of data can be used to estimate the parameters of a model that describes the underlying (possibly continuous time) evolution of the variable concerned, so far no attempt has been made to investigate whether these different sampling schemes have any effect on the asymptotic efficiency of the resulting estimators.
This paper investigates a new avenue of research related to the asymptotic efficiency of cointegration estimators by considering the effects of temporal aggregation. In this paper, the term temporal aggregation is taken to mean the discrete time sampling of an underlying process, discrete or continuous, whose dynamics are determined at a different frequency than that with which the process is observed. Included within this definition, therefore, is the sampling of both stock and flow variables.1
This is the sense in which the term temporal aggregation is used by Bergstrom (1984), Phillips (1991a), Drost and Nijman (1993), and Chambers (1998). Some authors, however, among them Weiss (1984) and Granger and Siklos (1995), use the term temporal aggregation to refer more explicitly to the sampling of flow data alone, and they employ the term systematic sampling for the case of stock variables.
There have been two main avenues of research in the temporal aggregation literature. The first examines the implications of sampling at discrete time intervals for the specification of econometric and time series models, and the second concentrates on methods of estimating the parameters of the underlying data generation process, based on a sample of observations at discrete time intervals. Weiss (1984) and Bergstrom (1984) are examples of the first line of research, whereas Bergstrom (1990), Harvey and Stock (1985), and Robinson (1993) cover various time and frequency domain methods of estimation in the second.
There are three main theoretical contributions made in this paper. The first is that estimators based on flow data alone are shown to be more efficient than when the data are all stocks or a mixture of stocks and flows. Furthermore, it is also demonstrated that estimators based on flow data are as efficient as when the data are recorded continuously. Both of these results are obtained by a direct comparison of the asymptotic covariance matrices of the estimators under the relevant types of sampling scheme. Finally, a method of improving efficiency with stock variables is also proposed. This is based on the averaging of the stock variables in an attempt to mimic the filter inherent in the discrete time sampling of flow variables.
The paper is organized as follows. Section 2 defines the cointegrated continuous time model, which is based on Phillips (1991a) and provides the exact representation of the disturbance process in the corresponding cointegrated system satisfied by the discrete time observations. This is achieved for each of the four possible combinations of stock and flow variables for the vectors of normalized (left-hand side) and explanatory (right-hand side) variables in the cointegrating relationships. This step is vital, because the asymptotic variances of the cointegration estimators depend on the value of the spectral density matrix of this disturbance process at the zero frequency. This section also discusses the concept of efficiency of cointegration estimators, following Saikkonen (1991), and provides conditions on the continuous time random disturbances such that the discrete time disturbance vectors satisfy a functional central limit theorem. Section 3 is organized into three sections. The first derives the precise form of the four time invariant linear filters that connect the discrete time disturbance vector with the continuous time disturbance vector. These filters are then used in the next section to derive expressions for the long-run variance matrix of the discrete time disturbance process, submatrices of which determine the asymptotic variance of the cointegration estimators. The final section of Section 3 derives the asymptotic variance of the (infeasible) continuous record estimator. The results in this section, and indeed in the paper as a whole, are quite general in the sense that the continuous time disturbance process is only assumed to be a stationary mixing process and to have a (Hermitian) positive definite spectral density matrix. It is not required to obey any particular law of motion. Section 4 investigates ways in which the relative inefficiencies associated with stock variables can be improved, and it incorporates an empirical example to assess the finite sample efficiency gains resulting from the proposed techniques. Section 5 concludes the paper, and Appendix A contains some supplementary lemmas required for the proofs of the principal theorems, lemmas, and propositions contained in the paper, the outline proofs of which appear in Appendix B. Proofs of the lemmas in Appendix A, and also more detailed proofs than appear in Appendix B, can be obtained from the author on request.3
These proofs are also available electronically at http://privatewww.essex.ac.uk/∼mchamb.
2. THE MODEL AND ITS EFFICIENT ESTIMATION
2.1. The Model
The model of cointegration is given by the system of equations


where y1(t) and y2(t) are continuous time I(1) processes of dimensions m1 × 1 and m2 × 1, respectively, B is an m1 × m2 matrix of unknown coefficients, and the m1 × 1 vector u1(t) and the m2 × 1 vector u2(t) are stationary continuous time random disturbances. The initial conditions y1(0) and y2(0) are not constrained to be fixed but may be drawn from a certain specified distribution. The long-run equilibrium relations between y1(t) and y2(t) are captured by (1), whereas (2) represents the evolution of y2(t) as a continuous time I(1) process.4
Phillips (1991a) uses the representation Dy2(t) = u2(t) in place of (2), where D denotes the mean square differential operator, which requires the sample paths of y2(t) to satisfy certain smoothness conditions. The specification in (2), however, does not require y2(t) to be mean square differentiable (although not ruling out the possibility) but simply requires increments in y2(t) to be stationary.
The specification of the model is, of course, consistent with u2 (and also u1) being generated by a stochastic differential equation system. Chambers (2000) deals with such a fully parametric continuous time cointegrated system.
Defining the m × 1 vector y(t) ≡ [y1(t)′, y2(t)′]′, where m = m1 + m2, it is possible to write6
See Phillips (1991a) for details. The matrix J in (3) is denoted E by Phillips (1991a), but J is used to denote this matrix here so as to avoid any confusion with the expectation operator.

where A = [Im1,−B], J = [Im1, 0]′ (in which 0 is a null matrix of dimension m1 × m2), and

The stationary vector w(t)dt reflects the short-run dynamics of the system that are determined by the properties of u1 and u2.
Phillips (1991a) shows that the vector y(t) satisfies the discrete time triangular ECM


and obtains two important results. The first is that the elements of the matrix B are identified directly from the discretely sampled data y(1),y(2),…,y(T), where T denotes sample size. This implies that there is no aliasing problem involved with the identification of cointegrating parameters in cointegrated continuous time systems. The second result is that it is not necessary to derive discrete models that explicitly account for the different ways in which stock and flow variables are observed, at least as far as the estimation of cointegrating parameters is concerned. These findings are in stark contrast to the situation in stationary systems of stochastic differential equations in which aliasing is a concern and in which it is vital to account for the differences between stocks and flows. Phillips derives these results in the cointegrated model by examining the behavior of the spectral density matrix of the observed series at the zero frequency. Certain filtered series, such as flows, do not affect the cointegrating relationships between the variables, because the value of the filter at the zero frequency is unity. This means that the discrete time ECM (4) may be used to estimate the matrix B irrespective of whether the data are stocks, flows, or a mixture of both. It is shown subsequently, however, that although it is possible to estimate the matrix B efficiently for a given data combination of stocks and flows, the way in which the variables are observed does affect the asymptotic variance matrix of the efficient estimators when the different possible data combinations are considered.
2.2. The Sampling Schemes and the Discrete Time Representations
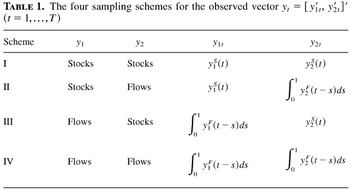
The effects of temporal aggregation are most transparently analyzed by considering, in turn, the four possible combinations7
The situation where y1 and y2 are each combinations of stocks and flows can, of course, also be analyzed using the methods in this paper. See Chambers (2000) for an example.

for the flow variables, where in each case t = 1,2,…,T and T denotes sample size. Using yt to denote the m × 1 vector of observed values, the four sampling schemes of interest are defined in Table 1.
The four sampling schemes for the observed vector yt = [y1t′, y2t′]′ (t = 1,…,T)

Despite the differences arising from the nature of stocks and flows detailed previously, the discrete time ECMs in each of the four stock-flow combinations can nevertheless be written in a common discrete time triangular ECM form, each case differing in the specification of the observable vector yt (defined previously for each sampling scheme) and in the specification of the unobservable disturbance vector. The precise form of each discrete time ECM is given in Lemma 1, which follows.
LEMMA 1. Let y(t) satisfy the continuous time cointegrated system defined by (1) and (2). Then the observed vector yt evolves according to the discrete time triangular ECM

in which the components of the disturbance vector ξt ≡ [ξ1t′, ξ2t′]′ are defined, for each of the four sampling schemes, as follows.
Scheme I.

Scheme II.

Scheme III.

Scheme IV.

The first step in establishing the validity of Lemma 1 is to relate x(t) in (4) directly to u(t), a result that is given in Lemma A1 in Appendix A. Schemes I and IV in Lemma 1, in which y1 and y2 are either stocks or flows, are derived directly from (4) and by integrating (4), respectively, the latter case yielding

In the remaining two cases, the joint presence of both stocks and flows requires that the appropriate equations from the systems (4) and (7) are selected and transformed accordingly. Full details of the manipulations are given in the proof of Lemma 1 in Appendix B.
2.3. An Invariance Principle and Asymptotically Efficient Estimation
The derivation of the asymptotic properties of an estimator (efficient or otherwise) of cointegrating parameters is typically based on an invariance principle for ξt. Lemma 1 plays an important role in establishing such an invariance principle, because it relates ξt to the underlying continuous time disturbance process u(t), about which the following assumptions are made. Let

denote the probability space on which u(t) is defined and let

denote a σ-subfield of

. Then the uniform and strong mixing coefficients, φj and αj, respectively, are defined by

, where

Assumption 1. The continuous time disturbance vector u(t) is a stationary random process with Hermitian positive definite spectral density matrix f (λ) (−∞ < λ < ∞) and satisfies

Assumption 2. The coefficients of the cointegrating matrix B in (1) satisfy |Bij| < ∞ (i = 1,…,m1; j = 1,…,m2).
Assumption 1 specifies u(t) to be a zero mean stationary mixing process in which the mixing coefficients decay sufficiently rapidly to satisfy the stated summability conditions. Furthermore, absolute moments of a sufficiently high order (β) are also required to exist. Mixing conditions are particularly convenient to use in the present context, because in all four sampling schemes ξt is a measurable function of u(t) over a finite interval and hence ξt inherits the same mixing properties.8
Assumption 2 is a very weak requirement ensuring that the cointegrating coefficients are finite.LEMMA 2. Under Assumptions 1 and 2, the disturbance vector ξt in the discrete time ECM (6) is a stationary random process with Hermitian positive definite spectral density matrix fξξ(λ) (−π < λ ≤ π) and satisfies the invariance principle

where the symbol ⇒ denotes weak convergence of the relevant probability measures, [Tr] denotes the integer part of Tr, and S(r) is an m × 1 Brownian motion process on r ∈ [0,1] with covariance matrix Ω = 2πfξξ(0).
The invariance principle for ξt in Lemma 2 enables the limiting distributions of estimators of B to be expressed in terms of the Brownian motion process S(r). The investigation of efficiency will be carried out with respect to estimators belonging to a well-defined class of estimators. It is convenient to partition S(r) and Ω conformably with y(t) and to define S1.2(r) = S1(r) − Ω12Ω22−1S2(r). Following Saikkonen (1991),
9The following representations are based on Definition 2.1 of Saikkonen (1991), to which the vec operator has been applied.

, of the cointegrating matrix B will be defined as one for which

Estimators satisfying the limiting distribution in (8) have alternatively been termed optimal estimators by Phillips (1991b). Because the Brownian motions S1.2(r) and S2(r) are independent, the limiting distribution in (8) can also be represented in the now familiar mixed normal form

in which

is the associated probability measure, and the matrix Ω11.2 = Ω11 − Ω12Ω22−1Ω21 denotes the covariance matrix of S1.2(r).
The importance of the mixed normal representation of the limiting distribution given in (9) was recognized by Phillips (1989). A number of cointegration estimators are known to have this limiting distribution and, hence, to be asymptotically efficient. Such efficient estimators typically fall into one of two categories. The first type treat the system dynamics either nonparametrically or make nonparametric adjustments to a first-stage estimator. Examples of this type of estimator include the spectral regression estimators suggested by Phillips (1991a), the fully modified estimators of Phillips and Hansen (1990), and the regression estimator of Saikkonen (1991). The second category of estimator is characterized by a fully parametric specification of the system dynamics, typically in vector autoregressive form. Estimators falling within this second category include the maximum likelihood estimators of Johansen (1991) and Phillips (1991b) and the reduced rank estimator of Reinsel (1990).
To compare the asymptotic efficiency of efficient estimators under different combinations of stock and flow data, it is convenient to rewrite the mixed normal distribution in (9) as10
Details of the equivalence of the representations (8)–(10) can be found in Phillips (1989).

where

is any unit m2 × 1 vector, Pγ(γ) is the probability measure associated with γ, and W2 is an m2 × 1 vector of standard Brownian motions or Wiener processes (i.e., W2 is Brownian motion with covariance matrix Im2). The representation of the distribution in (10) is particularly useful for the purposes of comparison because it is expressed as an integral with respect to the scalar random mixing variate γ that is common to each distribution, regardless of the underlying discrete time sampling scheme. Hence the efficiency comparison focuses on the matrices Ω22 and Ω11.2, both of which are obtained from Ω, the long-run variance matrix of the process ξt. Because the precise form of ξt has been shown in Lemma 1 to depend on whether the variables are stocks or flows, it suggests that the relative efficiency of efficient estimators across sampling schemes depends on the nature of the variables themselves. It should be emphasized once more that, for a given sampling scheme, an estimator with the limiting distribution in (8) or (10) is asymptotically efficient. The aim here is to ascertain the extent to which different sampling schemes affect the relative asymptotic efficiency of such estimators across the different sampling schemes. The next section, therefore, derives expressions for Ω22 and Ω11.2 in each of the four sampling schemes to facilitate such a comparison.
3. ASYMPTOTIC EFFICIENCY UNDER TEMPORAL AGGREGATION
3.1. The Spectral Density Matrix fξξ(λ)
The asymptotic variances of efficient estimators have been shown to depend on the submatrices Ω22 and Ω11.2 that are derived from the long-run variance matrix Ω = 2πfξξ(0). Lemma 1 has already provided the relationship between ξt and u(t) for each of the four sampling schemes, and this information can be used to derive fξξ(λ) from f (λ), the spectral density matrix of u(t). This task is greatly facilitated by the use of filters because ξt can be regarded as a filtered version of u(t). The filters corresponding to the time domain representations given in Lemma 1 are provided in Lemma 3.
LEMMA 3. The stationary process ξt is related to the continuous time disturbance process u(t) by the filtering equation ξt = M(D)u(t), where D denotes the mean square differential operator and the matrix filter function M(z) is defined for each sampling scheme as follows.
Scheme I.

Scheme II.

Scheme III.

Scheme IV.

In the preceding definitions, g(z) = (1 − e−z)/z and h(z) = e−z[1 − g(z)]/z.
The filter relating ξt and u(t), denoted M(D), is a function of the (mean square) differential operator D because the filter operates on the continuous time process u(t). This does not require, however, that u(t) itself be mean square differentiable, because in none of the sampling schemes does the filter M(D) involve the operation of applying D directly to u(t), so that in no case is Du(t) required to exist. The filter g(D), for example, is the filter associated with the process of integration over the unit interval, so that

. Although this requires that u(t) be integrable in the wide sense
11See Bergstrom (1984) for a definition of wide sense integration of continuous time random processes.
The filter function M(z) is utilized in deriving the spectral density function fξξ(λ) of ξt. Because ξt is a discrete time process and u(t) is a continuous time process, it is necessary to fold back the frequencies in the range (−∞,+∞) into the interval (−π,+π] . The spectral density matrix of ξt, regarded as a continuous time process, is given by

where M(iλ)* denotes the transpose of the complex conjugate of M(iλ). This representation follows because iλ is the frequency response function of the operator D and hence M(iλ) is the frequency response function of the filter M(D). The spectral density matrix of the discrete time process ξt is then related to fξξc(λ) by the folding formula:12
See, for example, Hannan (1970, p. 45) for details.

The properties of the matrix Ω = 2πfξξ(0) can be explored from the preceding representation for fξξ(λ), and some important and general results are derived in the next section.
3.2. The Asymptotic Variances
The matrix of interest is

, which is obtained from (12) by setting λ = 0. It is convenient, for the presentation of the results, to define the matrix filter function

and also the matrix f11.2(0) = f11(0) − f12(0) f22(0)−1f21(0), which is obtained from partitions of the spectral matrix f (λ) at the zero frequency in the same way that Ω11.2 is obtained from Ω. The required expressions for the matrices Ω22 and Ω11.2 are presented in Theorem 1 for each of Schemes I–IV.
THEOREM 1. The matrices Ω22 and Ω11.2 appearing in the limiting mixed normal distribution of an efficient estimator of the cointegrating matrix B are given by the following expressions for each of the four sampling schemes.
Scheme I.

Scheme II.

Scheme III.

Scheme IV.

The expressions for the Ω22 and Ω11.2 matrices given in Theorem 1 are quite general in that they hold for any stationary u(t) process with spectral density matrix f (λ) satisfying Assumption 1. The expressions are convenient representations of these matrices that utilize the precise form of the filter function M(z) in each sampling scheme. Note, however, that the Ω22 matrices are the same in each scheme. This enables the comparisons of estimator efficiency to proceed on the basis of a comparison of the Ω11.2 matrix in each case. Such a comparison yields the following immediate consequence of Theorem 1.
PROPOSITION 1. The most efficient estimators of cointegrating parameters are obtained when all the variables are flows (Scheme IV).
The validity of this proposition is demonstrated by considering the three matrix differences Ω11.2j − Ω11.2IV for j = I,II,III and showing that each of these differences is positive semi-definite. This is the sense in which the term efficient is used in Proposition 1, even though the estimators for each sampling scheme are efficient for that particular scheme. Notwithstanding this fact, these results show that, when different sampling schemes are considered, it is flow data that yield the most efficient estimates of cointegrating parameters. If it were possible to choose the way in which one's variables were sampled, then the choice should unambiguously be as flows. Although such a choice is not available to econometricians working with given variables, it does suggest that estimates obtained with flow data are more precise (in the sense of having smaller variances) than those obtained with mixtures of stocks and flows or with stocks alone. Whether it is possible to obtain any improvements at all in the efficiency of estimators based on stock variables is explored in Section 4.
3.3. Continuous Record Asymptotics
It is of interest to compare the efficiency of the estimators based on discretely sampled data with an efficient estimator that is obtained using a continuous record of data. In such circumstances, the classification of variables as stocks or flows is somewhat irrelevant, because the variables are observed on a continuous basis. Although, in practice, continuous time observations are not available to the econometrician, the analysis of the estimator based on a continuous record does serve to illuminate the results obtained earlier.
Assuming that a continuous record of observations is available on y(t) and dy(t) for 0 ≤ t ≤ T, estimation is based on the continuous time triangular system (3). Analogous to the discrete time case, the asymptotic properties of the continuous record estimator

require that, as T → ∞,

where

is an m × 1 Brownian motion process with covariance matrix

denotes the spectral density matrix of w(t). It then follows that the asymptotic distribution of
will have the representation (9) or, equivalently, (10), but in which the matrices Ω22 and Ω11.2 will be submatrices of

. This is because the spectral matrix of the disturbance process in the model at frequency zero determines the long-run variance matrix and in the continuous record case it is w(t), rather than ξt, that constitutes the disturbance vector. These observations lead immediately to the following result.
THEOREM 2. The asymptotic distribution of

is given by

Theorem 2 characterizes the asymptotic distribution of an efficient estimator in the idealized case where observations on the variables are recorded continuously. Note that the matrices

are defined in terms of f (λ), the spectral density matrix of u(t), which enables a direct comparison with the expressions in Theorem 1. Such a comparison yields the following result.
PROPOSITION 2. An efficient estimator obtained using flow data alone (Scheme IV) is asymptotically as efficient as the estimator obtained using a continuous record of data.
This remarkable result indicates that efficient estimators of cointegrating parameters are asymptotically as efficient with discretely sampled flow data as with a continuous record of observations. The observed values of flow variables, by their nature, contain information about the sample path of the variable over each observation interval, whereas stock variables do not contain the same type of information, being observed only at a single point in each interval. Such a difference lies at the heart of the result reported previously.
4. IMPROVING EFFICIENCY WITH STOCK VARIABLES
4.1. The Theory
The result that cointegration estimators are more efficient when obtained using flow data is of little comfort to a researcher working with stock variables. The question arises, therefore, as to whether the results contained in this paper can be used to suggest ways of improving the efficiency of estimators obtained using stock variables. Effectively this reduces to the issue of whether it is possible to approximate the filter function g(z), associated with the operation of integration, which relates the unobservable flow yF(t) to its discretely observed value,

. Recall that the filter function g(z) appears in the matrix filter function M(z) relating ξt to u(t) and that M(2πij) (for integer j) helps to determine the matrix fξξ(0), upon which Ω11.2 is based. The particular values of g(z) that are of interest are, therefore, g(0) = 1 and g(2πij) = 0 for integer j ≠ 0. Given observations on a stock variable at a fixed frequency, there seems little scope for improving efficiency. Attempting to approximate a flow by taking the average of p successive observations using

involves the filter function

. This function satisfies a(0) = 1 and a(2πij) = 1 for integer j ≠ 0, which has no effect whatsoever on asymptotic efficiency.
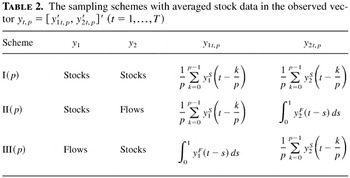
One situation in which efficiency can be improved is where observations on the stock variable are available at a higher frequency than that used for estimation. In models with mixtures of stocks and flows, this situation might arise if it were possible to sample the stocks more frequently than the flows. For example, some stock variables, such as interest rates, exchange rates, and certain prices, are observable at much higher frequencies than flow variables such as consumption, income, and exports. In these cases it would be advantageous to average the stock variables over the (unit) observation interval associated with the sampling of the flows. Suppose that the stock variables are recorded p times each unit observation period. In terms of unit time intervals, the sequence of adjusted stock data is of the form

In terms of filters, the averaged stock variable yt,pS is related to yS(t) by the expression yt,pS = σp(D)yS(t), where the filter function σp(z) is given by

As p → ∞, the discrete sum determining the averaged variable yt,pS converges to an integral, and so

. In practice, although the stock variable yS(t) may be observed very frequently relative to ytF, this limiting case will never be achieved, and so there will always be some loss of efficiency associated with stock variables as compared to flows.
To formalize the arguments, the three cases in which stock variables occur need to be modified to account for the averaging of the stocks over the finer grid of time points comprising each unit time interval. Details of these sampling schemes are given in Table 2, in which yt,p refers to the m × 1 vector of observations.
The sampling schemes with averaged stock data in the observed vector yt,p = [y1t,p′, y2t,p′]′ (t = 1,…,T)

For the vector yt,p, the form of the triangular discrete time ECM representation given in (6) is still valid, although the form of the disturbance vector ξt is, of course, changed. Lemma 4, which follows, therefore provides the exact discrete time ECM representation when the stock variables are averaged over the unit observation period.
LEMMA 4. Let y(t) satisfy the continuous time cointegrated system defined by (1) and (2). Then the observed vector yt,p evolves according to the discrete time triangular ECM

in which the components of the disturbance vector ξt,p ≡ [ξ1t,p′, ξ2t,p′]′ are defined, for each of the three sampling schemes involving averaged stock variables, as follows.
Scheme I(p).

Scheme II(p).

Scheme III(p).

The results in Lemma 4 generalize those in Lemma 1, which may be obtained as a special case of Lemma 4 by setting p = 1. These definitions relate ξt,p to the continuous time disturbance process u(t) and, hence, implicitly determine the matrix filter relating these two processes. The precise form of these filters is given in Lemma 5, which is analogous to the results in Lemma 3 for the unadjusted stock variables.
LEMMA 5. The stationary process ξt,p is related to the continuous time disturbance process u(t) by the filtering equation ξt,p = Mp(D)u(t), where the matrix filter function Mp(z) is defined in each sampling scheme involving averaged stock variables as follows.
Scheme I(p).

Scheme II(p).

Scheme III(p).

The function hp(z) is defined by hp(z) = e−z[σp(z) − g(z)]/z.
The dependence of these filter functions on p has been emphasized by the notation Mp(z). In the same way that the filter functions M(z) in Lemma 3 were an essential part of deriving the matrices determining the asymptotic variances of optimal estimators in Section 3, the filter functions in Lemma 5 enable the asymptotic variance matrices to be determined for efficient estimators based on the averaged stock variables. These asymptotic variance matrices are presented in Theorem 3.
THEOREM 3. The matrices Ω22 and Ω11.2 appearing in the limiting mixed normal distribution of an efficient estimator of the cointegrating matrix B are given by the following expressions under the three sampling schemes involving averaged stock variables.
Scheme I(p).

Scheme II(p).

Scheme III(p).

In each case, note that the only nonzero terms in the expression for Ω11.2 are multiples of p due to the filter σp(z). The expressions in Theorem 3 can be compared directly to those in Theorem 1 to yield the following qualitative result.
PROPOSITION 3. In models containing stock variables, estimators of cointegrating parameters are more efficient when based on the averaged stock variable yt,pS than when based on the unadjusted stock variable ytS.
The validity of Proposition 3 is established by comparing the Ω11.2 matrices in Theorems 1 and 3 and showing that the differences are positive definite. The implication for applied work is clear. If it is possible to construct the averaged variables yt,pS for stock data, then doing so unambiguously improves the asymptotic efficiency of the cointegration estimators. This could prove to be important in models containing mixed stock and flow variables, because in many cases it will be possible to observe the stock variables at higher frequencies than the flow variables. In such circumstances, the efficiency of the estimators can be improved by applying the filter σp(D) to the stock variables.
Some further comments concerning the proposed averaging are in order.13
I am grateful to a co-editor and a referee for emphasizing these points.
4.2. An Empirical Illustration
It is of interest to ascertain the extent to which the filter σp(D) can yield efficiency gains in finite samples, and the long-run money demand relationship provides a convenient model within which to explore such issues empirically. Defining m(t) as the real money stock, y(t) as the level of real income, and r(t) as the interest rate and assuming the variables are individually I(1) processes, the long-run money demand relationship can be cast as the cointegrated system


where the vector u(t) ≡ [u1(t), u2(t), u3(t)]′ is a stationary random disturbance vector. This model is in the form of the cointegrated system (1) and (2), and hence the preceeding results apply to the estimation of the parameters β1 and β2.
The data used in this empirical illustration refer to the United States and cover the period January 1, 1959, to December 31, 1999. The money stock series (real M1 money balances) is observed monthly, the interest rate series (Treasury bill rate) is observed daily, and the income series (real GDP) is observed quarterly. The variables m(t) and r(t) are examples of stock variables, whereas y(t) is clearly a flow, although there may, however, be some notion of averaging implicit in the construction of the money stock series. For this reason, quarterly averages of the money stock data were used, although different versions of the interest rate variable were considered. In particular, mid-quarter, end-quarter, and mean-quarter values of the interest rate variable were computed from the daily observations. The preceding theory suggests that the estimates obtained using the latter averages are the most efficient asymptotically, and this empirical application enables the finite sample variances to be compared across the three different sampling schemes for the interest rate.
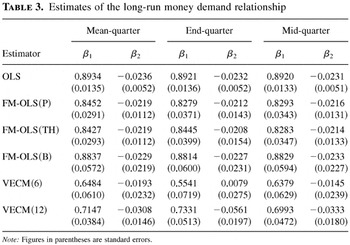
Two types of efficient estimator are considered. The first is the fully modified least squares (FM-OLS) estimator of Phillips and Hansen (1990), based on the triangular ECM representation, and the second is the Gaussian (maximum likelihood) estimator of Reinsel (1990) and Johansen (1991), based on the vector ECM (VECM) representation. The FM-OLS estimators were computed using the automatic bandwidth selection technique of Andrews (1991), based on an AR(1) approximation for the disturbances, to estimate the long-run variance matrix, for three different kernel functions, namely, Parzen, Tukey–Hamming, and Bartlett. These estimators are denoted FM-OLS(P), FM-OLS(TH), and FM-OLS(B) to distinguish the different underlying kernel functions. Using the VECM approach, two estimators were considered. The first uses the Schwartz information criterion to determine the autoregressive order of the system, which turns out to be 6. This estimator is denoted VECM(6). Inspection of the residuals in this system, however, suggests that they are serially correlated, and so the second estimator is based on a system with 12 lags and is denoted VECM(12). Although the second system is less parsimonious in modeling the dynamics, the residuals are closer to being white noise. The estimates of β1 and β2 obtained using each estimator are given in Table 3, which also contains the OLS estimates for comparison.
Estimates of the long-run money demand relationship

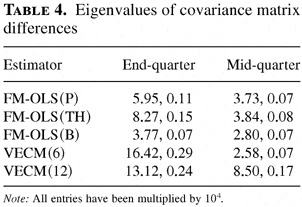
The FM-OLS estimates in Table 3 are remarkably stable across the different treatments of the interest rate data. The estimates using different kernels are also very similar, particularly in the case of the Parzen and Tukey–Hamming kernels. The VECM estimates show more variation both across different treatments of the interest rate data and between different system orders. An interesting feature of the results in Table 3 is that in no case (with the exception of the inefficient OLS estimator) are the standard errors using end-quarter or mid-quarter interest rate data less than those using the mean-quarter data. The theoretical results, however, concern the positive semidefiniteness of the difference in covariance matrices, not a comparison of individual elements of the covariance matrices. With this in mind, we have constructed Table 4, which contains the eigenvalues of the differences in the covariance matrices of the estimators based on unaveraged interest rate data with respect to the averaged data (which the theory suggests should be positive semidefinite).
Eigenvalues of covariance matrix differences

In all cases in Table 4, the relevant covariance matrix differences are positive semidefinite, as predicted by the asymptotic theory. This suggests that averaging stock data can lead to more precise estimates of cointegrating parameters in finite samples. These empirical results are only indicative, however, and should not be interpreted as meaning that such an outcome will always be achieved in finite samples, as the theory derived only relates to the asymptotic distribution of the estimators and not their finite sample distributions.
5. CONCLUDING COMMENTS
This paper has investigated a new avenue of research in the field of temporal aggregation in econometrics by considering the effects that the discrete time sampling of stock and flow variables has on the asymptotic efficiency of estimators in cointegrated systems. It is shown that estimators based on flow variables alone are more efficient than estimators based on stocks alone or on mixtures of stocks and flows. Furthermore, efficient estimators obtained with flow variables are shown to be as efficient as the estimators that would be obtained using a continuous record of data, if such an estimator were feasible.
Although such findings are of academic interest, the situation faced by a researcher is typically one in which the method of sampling a variable is determined by its very nature. For example, it is not possible to sample the money stock as a flow variable even if it is desirable for improved estimator efficiency to do so. The paper therefore provides a practical method for improving efficiency with stock variables that can be implemented in certain cases, these being where the stock can be observed at a higher frequency than the other variables. The method involves discrete averaging of the higher frequency data over the unit time interval and is shown to improve the efficiency of the estimators. An empirical example using long-run money demand regressions is carried out to assess the extent to which this aggregation of stock variables can improve efficiency, and it is found that for a number of estimators the averaging of monthly money stock data and daily interest rate data in the regressions using quarterly data can improve efficiency. Monte Carlo evidence on this and other predictions of the theory is obtained and assessed in Chambers (2001).
APPENDIX A
The following lemmas, A1–A7, are used in the proofs of the lemmas, theorems, and propositions in the main text. Their proofs are contained in a supplementary document that may be obtained from the author on request.
LEMMA A1. The disturbance vector x(t) ≡ [x1(t)′,x2(t)′]′ defined in (5) is related to the continuous time disturbance process u(t) by

LEMMA A2. Let y2(t) be a continuous time random variable that evolves according to the law of motion dy2(t) = u2(t)dt, where u2(t) is a stationary continuous time random process. Then

LEMMA A3. Let f (s) be a continuous function on s ∈ [0,1] and let u(t) be a stationary continuous time scalar random process. Then

where β is a finite positive constant.
LEMMA A4. Let u(t) denote a wide sense integrable continuous time random process. Then

where g(z) = (1 − e−z)/z and k(z) = [1 − g(z)]/z.
LEMMA A5. The functions g(z) = (1 − e−z)/z and h(z) = e−z[1 − g(z)]/z satisfy

whereas for integer j ≠ 0, g(2πij) = 0 and h(2πij) = (2πij)−1.
LEMMA A6. Let y2(t) be a continuous time random variable that evolves according to the law of motion dy2(t) = u2(t)dt, where u2(t) is a stationary continuous time random process. Then, for some positive integer p,

In terms of filters, this expression has the representation

where mp(z) = [σp(z) − g(z)]/z.
LEMMA A7. The function hp(z) = e−z[σp(z) − g(z)]/z satisfies limz→0 hp(z) = 1/(2p), while for integer j ≠ 0,

APPENDIX B
Outline proofs of the lemmas, theorems, and propositions given in the main text are provided here. In many cases the outline is given only for sampling scheme I, with the proofs for the remaining schemes following in a similar fashion. More detailed proofs, covering all the sampling schemes, are available from the author on request.
Proof of Lemma 1. We discuss each sampling scheme in turn.
Scheme I. The expressions are obtained directly from partitioning (4), which gives ξ1t = x1(t) and ξ2t = x2(t), and then applying Lemma A1.
Scheme II. Taking the first m1 equations of (4) gives

with ξ1t = x1(t) + B[y2F(t − 1) − y2,t−1F] . The expression for ξ1t in Lemma 1 results from the form of x1(t) given in Lemma A1 and using Lemma A2 for the expression

The expression for ξ2t is obtained from the last m2 equations of (7), so that

. Lemma A1 is again applied to relate ξ2t to u2(t).
Scheme III. The first m1 equations of (7) yield

where

. Application of Lemmas A1 and A2 yields the desired expression for ξ1t, and the expression for ξ2t is obtained directly from the last m2 equations of (4) as in Scheme I.
Scheme IV. The expressions for ξ1t and ξ2t come directly from partitioning (7), so that

. Lemma A1 once more yields the result. █
Proof of Lemma 2. The stationarity of ξt follows directly from the definitions of ξt in terms of u(t) in Lemma 1. The invariance principle is justified by verifying that the conditions of Corollary 2.2 of Phillips and Durlauf (1986) are satisfied. The required conditions are that (i) E(ξt) = 0; (ii) E|ξit|β < ∞ for some 2 ≤ β < ∞; and (iii) the mixing conditions in Assumption 1(c) also hold for ξt. Condition (i) is satisfied by Assumption 1(a) and Lemma 1. Condition (iii) holds as a result of the mixing properties in Assumption 1(c) and the fact that ξt is a measurable function of u(t) involving finite lags, which follows from the definitions in Lemma 1 and application of Theorem 14.1 of Davidson (1994) or Theorem 3.49 of White (1984). It remains to demonstrate that (ii) holds for each of the four sampling schemes. Details are provided here for Scheme I, and the results for the remaining sampling schemes follow in a similar fashion.
Scheme I. From Lemma 1 it follows that

under Assumptions 1(b) and 2 and where the first inequality arises from the cr-inequality and the third from application of Lemma A3. Also,

by Assumption 1(b) and where Lemma A3 has been applied. █
Proof of Lemma 3. The filters are derived directly from the expressions in Lemma 1, which relate ξt to u(t), along with the results in Lemma A4. Details are provided here for Scheme I, and the results for the remaining sampling schemes follow in a similar fashion.
Scheme I. From Lemma 1 and application of Lemma A4,

resulting in the form of M(z) in the lemma. █
Proof of Theorem 1. To simplify the presentation of the required summations, the notation

is utilized, where X1(·) (of dimension l × m) and X2(·) (of dimension m × n) are matrix functions and f (·) (of dimension m × m) represents a spectral density matrix or a submatrix thereof. In each of the four sampling schemes, the long-run variance matrix of interest is given by Ω = 2πfξξ(0) = 2πS(M,f,M′), where M(z) is defined in Lemma 3. The submatrices of Ω yield Ω11.2 = Ω11 − Ω12Ω22−1Ω21. Some of the summations involving the functions g(z) and h(z) simplify in view of Lemma A5. For example,

. Details are provided here for Scheme I, and the results for the remaining sampling schemes follow in a similar fashion.
Scheme I. From the definition of M(z), the following submatrices of Ω are obtained:

Combining these expressions gives

as given in the theorem. █
Proof of Proposition 1. The validity of Proposition 1 is established by considering, in turn, the three matrix differences Ω11.2j − Ω11.2IV for j = I,II,III and demonstrating that each one is positive semidefinite. The first of these differences is

which is clearly (Hermitian) positive definite in view of f (λ) being a spectral density matrix. Next,

Because f (λ) is Hermitian positive definite, H(2πij) f (2πj)H(2πij)* is clearly positive semidefinite for each j, and hence so is the preceding sum over j ≠ 0. Finally,

In view of Lemma A5, |h(2πij)|2 = (2πij)−1(−2πij)−1 = (4π2j2)−1 > 0 for all j ≠ 0, and because f22(λ) is Hermitian positive definite, the preceding sum is positive semidefinite. █
Proof of Theorem 2. The proof follows straightforwardly from the definition of an optimal estimator by evaluating the long-run variance matrix

and demonstrating that it is equal to 2πf (0). Because w(t)dt = Γ(D)u(t)dt, where

Proof of Proposition 2. This follows directly from the fact that the variance matrices in the limiting distributions of the optimal estimators in Scheme IV (Theorem 1) and in the continuous record case (Theorem 2) are identical. █
Proof of Lemma 4. We consider each of the three sampling schemes in turn.
Scheme I(p). Here,

, and so the discrete time ECM is obtained by applying the lag operator function

to (4), yielding the ECM representation

. Application of Lemma A1 for x(t) yields the required expressions.
Scheme II(p). Taking the first m1 equations of the equation in Scheme I(p) gives

where

. Applying Lemmas A1 and A6 yields the required expression. The vector ξ2t,p is obtained directly from the last m2 equations of (7) and hence is the same as the expression in Scheme II of Lemma 1.
Scheme III(p). The first m1 equations of (7) yield

where

and the result follows by using Lemmas A1 and A6. The expression for ξ2t,p comes from the last m2 equations of the expression in Scheme I(p), which describe the evolution of y2t,pS. █
Proof of Lemma 5. We take each sampling scheme in turn.
Scheme I(p). Because ξt,p = σp(D)ξt, where ξt is from Scheme I in Lemma 1, it follows immediately that ξt,p = σp(D)M(D)u(t), with M(z) defined in Scheme I of Lemma 3, because ξt = M(D)u(t).
Scheme II(p). From the definition of ξ1t,p it follows, using Lemma A6, that

and because hp(z) = e−zmp(z), the filter on u2(t) is σp(D)g(D) + hp(D). The vector ξ2t,p is equal to ξ2t in Scheme II, and so it follows immediately that ξ2t,p = g(D)2u2(t). The expression for Mp(z) follows by combining these results.
Scheme III(p). Again from the definition of ξ1t,p and using Lemma A6,

and the expression in the lemma follows by noting that hp(z) = e−zmp(z). Finally, the vector ξ2t,p is equivalent to ξ2t,p in Scheme I(p), and the expression for Mp(z) then follows immediately. █
Proof of Theorem 3. The proof follows the same approach as the proof of Theorem 1, with Mp(z) replacing M(z). Expressions involving the filter function σp(z) simplify in view of σp(2πij) = 1 for j = 0,±p,±2p,… and σp(2πij) = 0 otherwise. For example,

. An outline of the derivations for Scheme I(p) is provided here. The results for the remaining sampling schemes follow in a similar fashion.
Scheme I(p). The expressions of interest are

Combining these expressions gives

Proof of Proposition 3. As the expressions for the Ω22 matrices are identical in Theorems 1 and 3, the proof proceeds by comparing the Ω11.2 matrices defined in these theorems for the cases with unadjusted and adjusted data. Details are given for Scheme I(p); those for Schemes II(p) and III(p) follow in a similar fashion.
Scheme I(p). The expressions in the two theorems give

where

denotes the set of positive and negative integers, including zero. Because f (λ) is Hermitian positive definite by assumption, it follows that this matrix difference is positive definite. █
References
REFERENCES
Ahn, S.K. &
G.C. Reinsel
(1990)
Estimation for partially nonstationary multivariate autoregressive
models.
Journal of the American Statistical Association
85,
813–823.CrossRefGoogle Scholar
Andrews, D.W.K.
(1991)
Heteroskedasticity and autocorrelation consistent covariance matrix
estimation.
Econometrica
59,
817–858.CrossRefGoogle Scholar
Bergstrom, A.R.
(1984)
Continuous time stochastic models and issues of aggregation over
time. In
Z. Griliches &
M.D. Intriligator (eds.),
Handbook of Econometrics,
vol. 2, pp.
1145–1212.
Amsterdam:
North-Holland.
Bergstrom, A.R.
(1990)
Continuous Time Econometric Modelling.
Oxford:
Oxford University Press.
Chambers, M.J.
(1998)
Long memory and aggregation in macroeconomic time series.
International Economic Review
39,
1053–1072.CrossRefGoogle Scholar
Chambers, M.J.
(2000)
Frequency Domain Gaussian Estimation of Temporally Aggregated
Cointegrated Systems.
Manuscript,
University of Essex.
Chambers, M.J.
(2001)
Temporal aggregation and the finite sample performance of spectral
regression estimators in cointegrated systems: A simulation study.
Economic Theory
17,
591–607.Google Scholar
Davidson, J.E.H.
(1994)
Stochastic Limit Theory.
Oxford:
Oxford University Press.
Drost, F.C. and
T.E. Nijman
(1993)
Temporal aggregation of GARCH processes.
Econometrica
61,
909–927.Google Scholar
Granger, C.W.J. &
P.L. Siklos.
(1995)
Systematic sampling, temporal aggregation, seasonal adjustment, and
cointegration: Theory and evidence.
Journal of Econometrics
66,
357–369.Google Scholar
Hannan, E.J.
(1970)
Multiple Time Series.
New York:
Wiley.
Harvey, A.C. &
J.H. Stock
(1985)
The estimation of higher-order continuous time autoregressive
models.
Econometric Theory
1,
97–118.Google Scholar
Johansen, S.
(1991)
Estimation and hypothesis testing of cointegration vectors in
Gaussian vector autoregressive models.
Econometrica
59,
1551–1580.Google Scholar
Phillips, P.C.B.
(1989)
Partially identified econometric models.
Econometric Theory
5,
181–240.Google Scholar
Phillips, P.C.B.
(1991a)
Error correction and long run equilibrium in continuous time.
Econometrica
59,
967–980.Google Scholar
Phillips, P.C.B.
(1991b)
Optimal inference in cointegrated systems.
Econometrica
59,
283–306.Google Scholar
Phillips, P.C.B. &
S.N. Durlauf
(1986)
Multiple time series regression with integrated processes.
Review of Economic Studies
53,
473–495.Google Scholar
Phillips, P.C.B. &
B.E. Hansen
(1990)
Statistical inference in instrumental variables regression with
I(1) processes.
Review of Economic Studies
57,
99–125.Google Scholar
Robinson, P.M.
(1993)
Continuous-time models in econometrics: Closed and open systems,
stocks and flows. In
P.C.B. Phillips (ed.),
Models, Methods, and Applications of Econometrics: Essays in Honour
of A.R. Bergstrom, pp.
71–90.
Oxford:
Blackwell.
Saikkonen, P.
(1991)
Asymptotically efficient estimation of cointegration regressions.
Econometric Theory
7,
1–21.Google Scholar
Weiss, A.A.
(1984)
Systematic sampling and temporal aggregation in time series models.
Journal of Econometrics
26,
271–281.Google Scholar
White, H.
(1984)
Asymptotic Theory for Econometricians.
New York:
Academic Press.
The four sampling schemes for the observed vector yt = [y1t′, y2t′]′ (t = 1,…,T)
The sampling schemes with averaged stock data in the observed vector yt,p = [y1t,p′, y2t,p′]′ (t = 1,…,T)
Estimates of the long-run money demand relationship
Eigenvalues of covariance matrix differences
 You have
Access
- 17
- Cited by