





In Morey et al (Reference Morey, Lang, Huntington, Shobe, Nath and Loreen2026) the authors presented calculations of slack-water sediment concentration inferred from mapped deposit thickness and modeled settling time (Figure 8 in Morey et al., Reference Morey, Lang, Huntington, Shobe, Nath and Loreen2026). They calculated grain settling velocity  ${w_s}$ (Equation 2 in Morey et al., Reference Morey, Lang, Huntington, Shobe, Nath and Loreen2026) using a constant drag coefficient
 ${C_D}$. In fact, the drag coefficients for grains of diameter
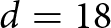 $d = 18$ and
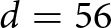 $d = 56$ µm, the representative sizes used in the calculations, are not constant but vary as a function of particle Reynolds number
 $Re$ because the grains are small enough that their settling is resisted by viscous drag caused by laminar flow around the grains (e.g., Ferguson and Church, Reference Ferguson and Church2004). Within the range of particle Reynolds numbers for these grain sizes, the drag coefficient is
 ${C_D} = 24/Re$ where
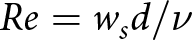 $Re = {w_s}d/\nu $ with
 $\upsilon = 1 \times {10^{ - 6}}$ m2/s being the kinematic viscosity of water.
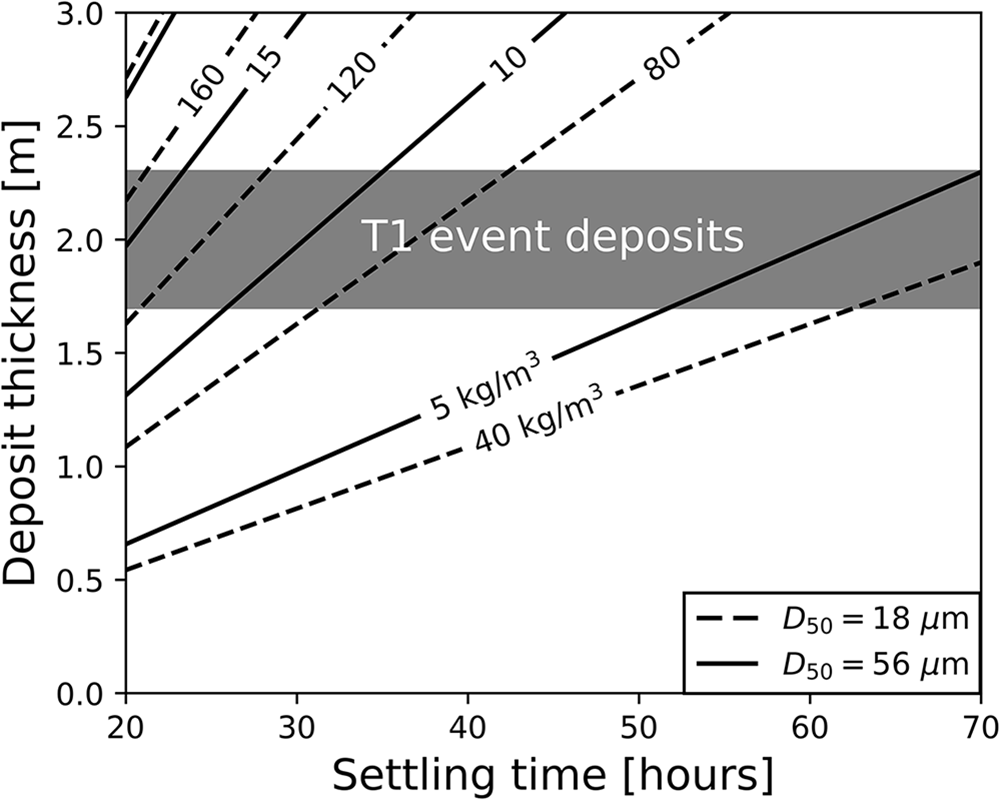
In this corrigendum the authors recalculate inferred sediment concentrations using the correct expression for the drag coefficient (Figure 1). The figure illustrates that suspended-sediment concentrations between ca. 4-160 kg/m3 can explain the measured thickness of event facies deposits observed in T1 terraces. Inferred concentrations are much greater than total suspended-solid measurements collected from the modern Siang River (∼0.1 kg/m3; Das et al., Reference Das, Boruah and Kar2014) and measurements from rivers experiencing outburst floods (Marín et al., Reference Marín, Tironi, Paredes and Contreras2013; Bailey et al., Reference Bailey, Shugar, Tilston, Hubbard, Giesbrecht, Del Bel Belluz and Jackson2025).
Corrected contour plot illustrating the relationship between settling time and deposit thickness for a column of stagnant water with various suspended sediment concentrations. Solid line contours show predictions for 56 μm particles, corresponding to the D50 of El facies. Dashed line contours show predictions for 18 μm particles, corresponding to the D50 of Ec facies. Gray box outlines the range of conditions necessary to explain the total thickness of Ec and El facies observed in T1 terraces at Sites 4 and 5 given the potential duration of stagnant water inundation in the Siyom valley predicted by Morey et al. (2022).



 Open access

