In recent years, the single-step approach to predict breeding values has become increasingly popular, and in many countries, work is underway to implement it into the routine evaluation system for dairy cattle. The growing importance of the single-step model is due to the possibility of integrating phenotypic, genomic and pedigree data, which results in the prediction of breeding values for all individuals under one unified model without the need to conduct two separate evaluations (i.e. conventional and genomic). In national genomic evaluations of dairy cattle, two forms of a single-step model are used – the single-step G-BLUP fitting a random animal additive genetic effect with a relationship matrix defined by the pedigree and/or SNP genotype information (Aguilar et al., Reference Aguilar, Misztal, Johnson, Legarra, Tsuruta and Lawlor2010; Christensen and Lund, Reference Christensen and Lund2010) and the single-step SNP-BLUP fitting both a random animal additive effect defined above and a random SNP effect (Liu et al., Reference Liu, Goddard, Reinhardt and Reents2014).
The primary purpose of our study was to compare the breeding values from the G-BLUP model predicted by two software implementations that are most widely used on a national scale, MiXBLUP (Vandenplas et al., Reference Vandenplas, Veerkamp, Calus, Lidauer, Strandén, Taskinen, Schrauf and Napel2022) and BLUPF90IOD3 (Aguilar et al., Reference Aguilar, Tsuruta, Masuda, Lourenco, Legarra and Misztal2018), using the same model parametrization and a dataset. This was done by considering various sets of core animals using data from the Polish national evaluation for stature.
Materials and methods
Data
The analysed data represent the active population of animals that entered the Polish national genetic evaluation for stature ( ${h^2} = 0.54$ from December 2021. It includes 1,098,611 cow phenotypes and 141,397 pseudophenotypes expressed by deregressed proofs (DRP) from the multiple across-country evaluation (MACE) conducted by Interbull. DRPs were adjusted for the phenotypes of bulls’ daughters born in Poland. Most individuals were genotyped using various versions of the EuroG MDIllumina genotyping microarray, which was custom-designed for the EuroGenomics Cooperative. Individuals genotyped with other commercial platforms were imputed to EuroG MD using Fimpute software (Sargolzaei et al., Reference Sargolzaei, Chesnais and Schenkel2014). The SNP preselection criteria followed the procedure used in the national genomic evaluation in Poland. The criteria comprised a minor allele frequency of at least 0.01 and a technical quality of genotyping expressed by a minimum call rate of 99%. After editing, 46,118 SNPs remained for further analysis. The genomic data contained 42,134 cow genotypes and 47,108 bull genotypes. Full pedigree information was truncated after the fifth generation using Relax2 software (Strandén, Reference Strandén2014) with the prune 5 option. This resulted in 1,555,995 individuals and 33 unknown parent groups based on birth year, country of origin and sex.
Prediction of breeding values
The prediction of genomically enhanced breeding values (GEBVs) was based on the following single-step G-BLUP model:
 \begin{equation}\boldsymbol{y = Xb + Wa + e} \cdot ,\end{equation}
where  $\boldsymbol{y}$ is the vector of dependent variables represented by cows’ measured phenotypes for stature and bulls’ pseudophenotypes expressed by their MACE DRPs (Jairath et al., Reference Jairath, Dekkers, Schaeffer and Liu1998),
 $\boldsymbol{b}$ represents a vector of fixed effects including age at calving, lactation phase and herd corresponding to cows’ phenotypes as well as corresponding phantom codes of the fixed effects for bulls’ DRPs,
 $\boldsymbol{a}$ represents a vector of breeding values and
 $\boldsymbol{e}$ is the vector of residuals. The underlying covariance structure of the random effects is given by
 $\boldsymbol{a} \sim N(0,{\boldsymbol{H}_G}\sigma _a^2)$ and
 $\boldsymbol{e} \sim N(0,\,\boldsymbol{R}\sigma _e^2$.
 ${\boldsymbol{H}_G}$ is given by
 $\left[ {\begin{array}{*{20}{c}}
{{{\boldsymbol{A}}_{11}}}&{{{\boldsymbol{A}}_{12}}} \\
{{{\boldsymbol{A}}_{21}}}&{{{\boldsymbol{A}}_{22}}}
\end{array}} \right] + \left[ {\begin{array}{*{20}{c}}
{{{\boldsymbol{A}}_{12}}{\boldsymbol{A}}_{22}^{ - 1}\left( {{\boldsymbol{G}} - {{\boldsymbol{A}}_{22}}} \right){\boldsymbol{A}}_{22}^{ - 1}{{\boldsymbol{A}}_{21}}}&{{{\boldsymbol{A}}_{12}}{\boldsymbol{A}}_{22}^{ - 1}\left( {{\boldsymbol{G}} - {{\boldsymbol{A}}_{22}}} \right)} \\
{\left( {{\boldsymbol{G}} - {{\boldsymbol{A}}_{22}}} \right){\boldsymbol{A}}_{22}^{ - 1}{{\boldsymbol{A}}_{21}}}&{{\boldsymbol{G}} - {{\boldsymbol{A}}_{22}}}
\end{array}} \right]$
(Lourenco et al., Reference Lourenco, Legarra, Tsuruta, Masuda, Aguilar and Misztal2020), where  ${{\boldsymbol{A}}_{11}}$,
 ${\boldsymbol{A}_{12}}/{\boldsymbol{A}_{21}}$ and
 ${\boldsymbol{A}_{22}}$ are the components of the numerator relationship matrix constructed based on the pedigree corresponding to non-genotyped animals, the covariance between non-genotyped and genotyped animals, as well as between genotyped animals, respectively, while
 $\boldsymbol{G}$ represents the genomic relationship matrix between genotyped animals.
 $\boldsymbol{R}$ is a diagonal matrix containing 1.00 for cows with phenotypes or
 ${n_i}$ for bulls with MACE DRPs, with
 ${n_i}$ representing a difference in effective daughter contributions of i-th bull between the MACE and the national evaluation.
 ${\boldsymbol{X}}$ and
 ${\boldsymbol{W}}$ denote the corresponding design matrices. For solving the mixed model equations corresponding to model (1), an inverse of the genomic covariance matrix (
 ${\boldsymbol{G}}$) is required. Following Misztal (Reference Misztal2015), the inverse was approximated as:
 ${{\boldsymbol{G}}^{ - 1}} \approx \left[ {\begin{array}{*{20}{c}}
{{\boldsymbol{G}}_{cc}^{ - 1}}&0 \\
0&0
\end{array}} \right] + \left[ {\begin{array}{*{20}{c}}
{ - {\boldsymbol{G}}_{cc}^{ - 1}{{\boldsymbol{G}}_{cn}}} \\
{\boldsymbol{I}}
\end{array}} \right]{\boldsymbol{M}}_{nn}^{ - 1}\left[ {\begin{array}{*{20}{c}}
{ - {\boldsymbol{G}}_{cn}^T{\boldsymbol{G}}_{cc}^{ - 1}}&{\boldsymbol{I}}
\end{array}} \right]$, where
 ${{\boldsymbol{G}}_{cc}}$ represents the genomic relationship matrix for the subgroup of animals defined as core individuals,
 ${{\boldsymbol{G}}_{cn}}$ is the genomic relationship matrix between core and non-core individuals and
 ${\boldsymbol{M}_{nn}}$ is a diagonal matrix with nonzero elements corresponding to the variance of the Mendelian sampling effect for each non-core individual. Four sets of genotyped animals were used as core individuals. The All_male set was composed of all bulls with phenotypes, the Male_20K set was composed of 20,000 bulls randomly selected from the active population, the Female_30K set was composed of 30,000 cows randomly selected from the active population and the Random_20K set was composed of 20,000 individuals (bulls and cows) randomly selected from the active population. The random choice of core animals was performed using a custom-written R script using the sample function. The first three sets were chosen to represent markedly different scenarios that would allow for a better understanding of the impact of the selected core animals on prediction. The random selection resembled the scenario used in practical applications.
The computations were performed using two software packages, MiXBLUP and BLUPF90IOD3, which implement the PCG solver with an equivalent convergence criterion (Masuda, Reference Masuda2019; Vandenplas et al., Reference Vandenplas, Calus, Eding, Van Pelt, Bergsma and Vuik2021). The corresponding and equivalent stopping criteria were 1E-07 for MiXBLUP and 1E-14 for BLUPF90IOD3. The difference between the programs was due to differences in software implementation.
Validation of predictions
The validation of GEBV prediction followed the GEBVtest method (Mäntysaari et al., Reference Mäntysaari, Liu and VanRaden2010) adopted by the Interbull organization (www.interbull.org) and was based on the following linear regression model:
 \begin{equation}{{GEB}}{{\boldsymbol{V}}_{full}} = \,{b_0} + \,{b_1}{\boldsymbol{GEB}}{{\boldsymbol{V}}_{trunc}} + {\boldsymbol{\varepsilon ,}}\end{equation}
where  ${\boldsymbol{GEB}}{{\boldsymbol{V}}_{full}}$ is the vector of GEBV predicted by equation (1) for the complete data set and
 ${\boldsymbol{GEB}}{{\boldsymbol{V}}_{trunc}}$ represents a vector of GEBVs predicted by equation (1) for the validation dataset. Three validation sets were defined: all_validation – composed of all bulls born between 2014 and 2017 with Effected Daughter Contributions (EDC) over 20; daughters_in_PL – a subset of all_validation set composed only of bulls with daughters in Poland; and young – comprising genotyped young bulls born after 2017.
The validation model (2) was fitted using the lm function in the R software (R Core Team 2021).
Results
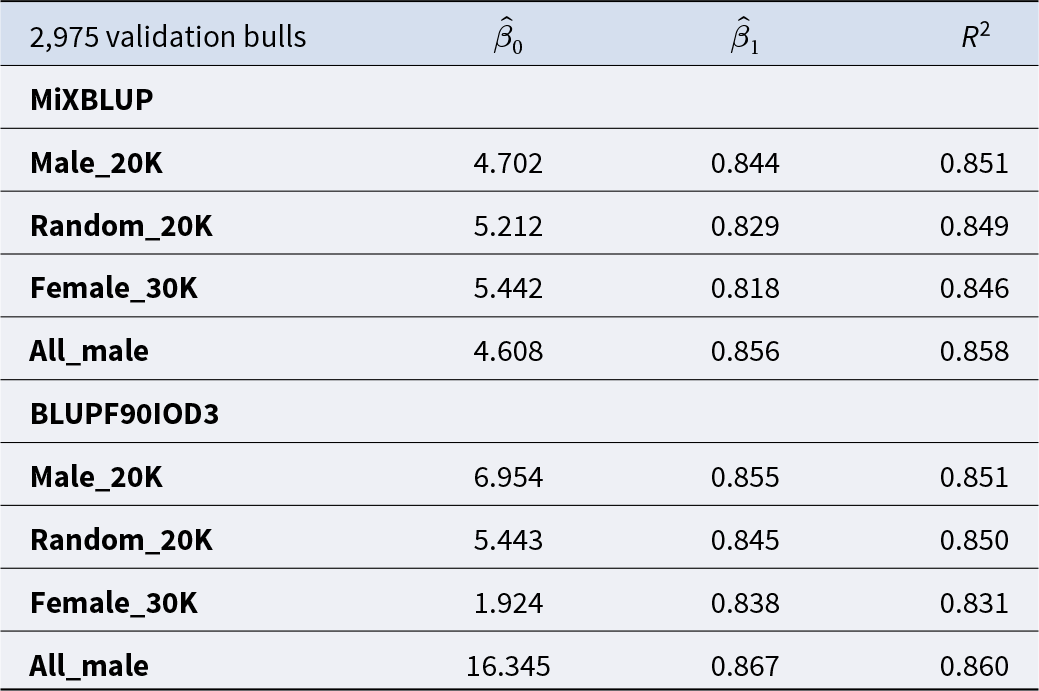
The correlation coefficients between the GEBVs predicted by the full and each of the three validation datasets were very similar across the software implementations, the core animal and the validation sets (Table 1). They varied between 0.89 for the scenario with Female_30K and Daughters_in_PL set predicted by BLUPF90IOD3 and 0.97 for the scenario with Male_20K and young set, regardless of the software. Considering validation, the estimated regression intercepts  $\left( {{{\hat \beta }_0}} \right)$ varied not only between software implementations but also between validation scenarios and core animal sets. Albeit similarities of intercepts were not expected, as the various subsets of data were not corrected for the genetic base. Moreover, from the validation perspective, the most important quantities are
 ${\hat \beta _1}$ and
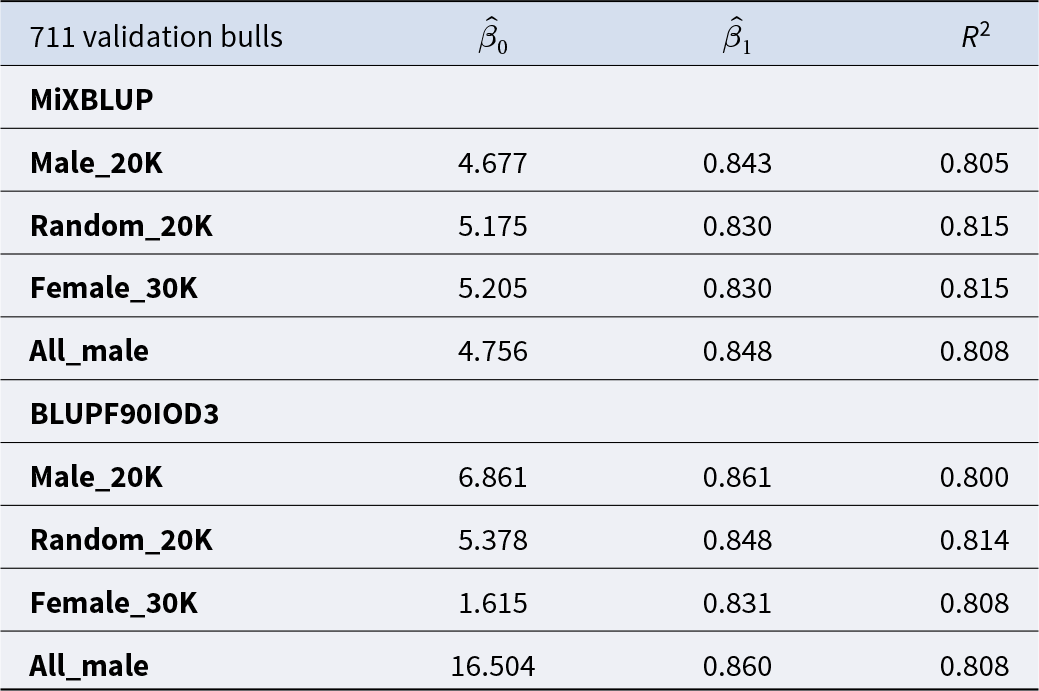
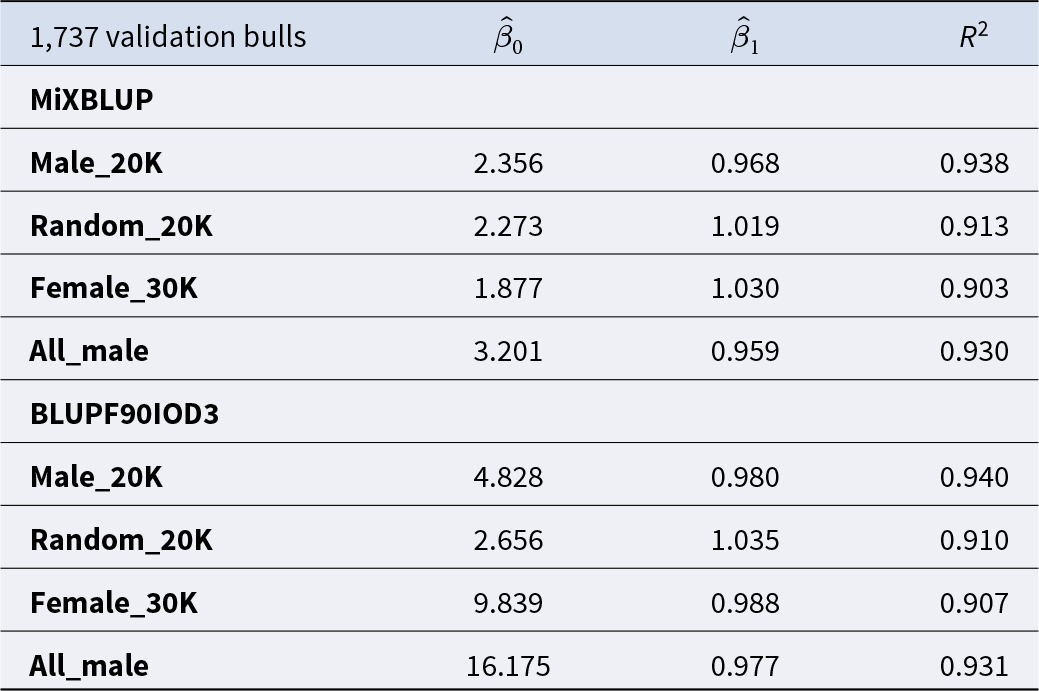
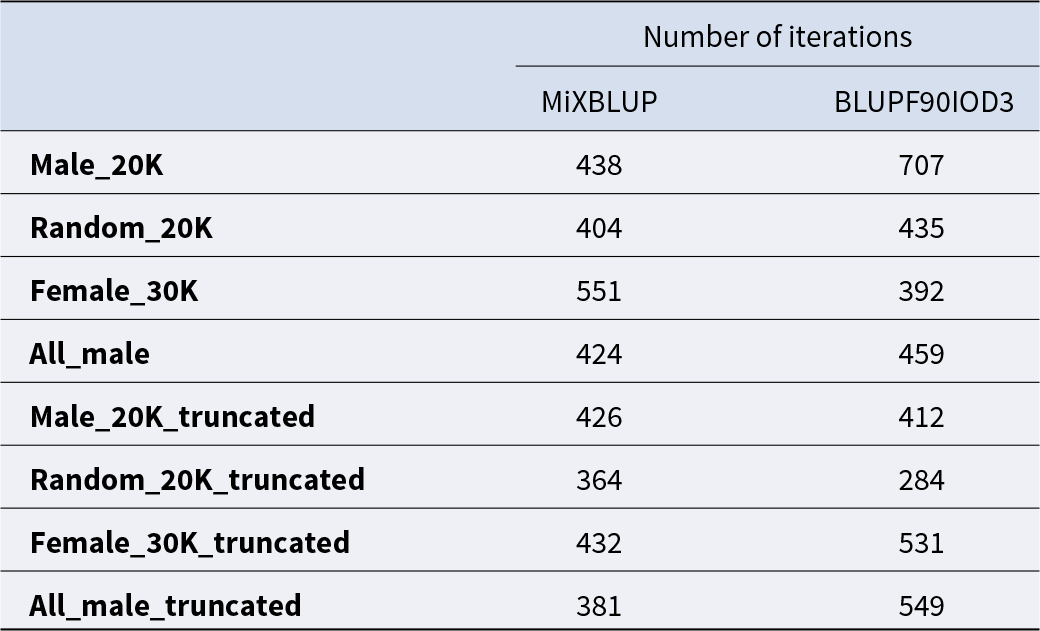
 ${R^2}$ that remained stable across the software implementations for each validation scenario (Tables 2–4). Note, that slope estimates obtained for the young dataset were very close to unity, which is due to the fact that young bulls still have hardly any daughters that provide additional information in the full set compared to the truncated set, so the full and truncated sets are very similar. For MiXBLUP, the number of iterations to convergence ranged between 364 for Random_20K, truncated dataset, and 551 for Female_30K, full dataset, and for each scenario, the full dataset required more iterations than the truncated dataset. For most scenarios, the convergence of BLUPF90IOD3 required more iterations than MiXBLUP and was more variable across the datasets. The lowest number of 284 iterations was needed to converge the Random_20K truncated dataset, whereas 707 iterations were required to converge for the full version of this scenario. Surprisingly, the smaller, that is, truncated, dataset does not always result in faster convergence of the BLUPF90IOD3 solver. A summary of the number of iterations required for each scenario is presented in Table 5. Further similarities between the programs extend to their high robustness towards different sets of core animals (Figure 1), since among the top 50 ranked bulls, 45 and 44 were also present in the top 50 group defined by the other three scenarios for MiXBLUP and BLUPF90IOD3 implementations, respectively. Within each scenario, there were almost no differences in bull rankings, so the numbers of common bulls were 49 and 48.
Venn diagram of the top 50 GEBV bulls for different core animal sets within each software.

Figure 1 Long description
The image contains two 4-set Venn diagrams side by side. The left diagram is labeled MiXBLUP and the right diagram is labeled BLUPF90IOD3. Each diagram compares the top 50 GEBV bulls across four core animal sets: Random20K, Female30K, Allmale and Male20K. In the MiXBLUP diagram, the central overlapping region contains the number 45, indicating bulls common to all sets. The overlapping regions between Random20K and Female30K, Random20K and Allmale and Random20K and Male20K each contain the number 2. The overlapping regions between Female30K and Allmale, Female30K and Male20K and Allmale and Male20K each contain the number 1. In the BLUPF90IOD3 diagram, the central overlapping region contains the number 44. The overlapping regions between Random20K and Female30K, Random20K and Allmale and Random20K and Male20K each contain the number 1. The overlapping regions between Female30K and Allmale, Female30K and Male20K and Allmale and Male20K each contain the number 2. The diagrams illustrate the distribution and overlap of bulls across different core animal sets for each software implementation.
Pearson correlations of GEBVs predicted between the full and the truncated datasets were calculated for all. All validation bulls represent bulls with EDC over 20 and born between 2014 and 2017. Validation bulls with daughters in Poland represent bulls with EDC over 20 and born between 2014 and 2017. Genotyped young bulls represent bulls born after 2017

Table 1 Long description
The table reports Pearson correlations between genomic breeding values predicted from full versus truncated datasets, summarized for three bull groups and two software pipelines. For all validation bulls, correlations are consistently about 0.92 to 0.93 across scenarios, and MiXBLUP and BLUPF90IOD3 match closely. For validation bulls with daughters in Poland, correlations are slightly lower, about 0.89 to 0.90, with the lowest value in the Female 30K scenario under BLUPF90IOD3. For genotyped young bulls, correlations are highest overall, ranging from about 0.94 to 0.97, with Male 20K reaching about 0.97 in both software pipelines. Across scenarios, differences between MiXBLUP and BLUPF90IOD3 are small, typically identical or within about 0.01 to 0.02. Uncertainty values are smallest for young bulls and larger for the daughters-in-Poland group, indicating more variability in that subset.
Validation results of GEBV prediction for bulls born between 2013 and 2017 with EDC > 20

Table 2 Long description
The table reports validation regression results for genomic breeding value predictions in 2,975 bulls, comparing two software tools across four training set designs. For MiXBLUP, explained variance ranges from 0.846 to 0.858, with All_male highest at 0.858 and Female_30K lowest at 0.846; slopes run from 0.818 to 0.856. For BLUPF90IOD3, explained variance ranges from 0.831 to 0.860, with All_male highest at 0.860 and Female_30K lowest at 0.831; slopes run from 0.838 to 0.867. Intercepts vary more than slopes: MiXBLUP intercepts are about 4.6 to 5.4, while BLUPF90IOD3 spans about 1.9 to 16.3, with All_male notably high. Overall, All_male is the most consistent top performer on explained variance for both tools, while Female_30K tends to underperform. Because intercepts differ substantially between tools, comparisons should focus more on explained variance and slope than on intercept magnitude alone.
 ${\hat \beta _0}$, intercept;
 ${\hat \beta _1}$, slope; R 2, coefficient of determination.
Validation results of GEBV prediction for bulls with daughters in Poland born between 2013 and 2017 with EDC > 20

Table 3 Long description
The table reports validation regression results for 711 bulls, comparing two prediction tools across four training set options, using intercept, slope, and R squared as fit metrics. R squared values are consistently high, ranging from 0.800 to 0.815, indicating similar overall predictive fit across methods and datasets. MiXBLUP shows intercepts clustered around 4.677 to 5.205 with slopes from 0.830 to 0.848; its highest R squared is 0.815 for Random_20K and Female_30K. BLUPF90IOD3 shows more variable intercepts, from 1.615 for Female_30K up to 16.504 for All_male, while slopes remain similar at 0.831 to 0.861. The highest slope is 0.861 for BLUPF90IOD3 Male_20K, but its R squared is 0.800, slightly lower than the best values in the table. Overall, slopes are consistently below 1, suggesting predictions tend to be somewhat compressed relative to observed outcomes, and the large intercept for BLUPF90IOD3 All_male indicates a notable shift that may warrant caution when comparing calibration across settings.
 ${\hat \beta _0}$, intercept;
 ${\hat \beta _1}$, slope; R 2, coefficient of determination.
Validation results of GEBV prediction for young genotyped bulls born after 2017

Table 4 Long description
The table reports validation regression results for genomic breeding value predictions in 1,737 young genotyped bulls, comparing two software pipelines across four training set designs. For each pipeline and design, it lists the regression intercept, regression slope, and the coefficient of determination, which reflects how well predictions align with observed outcomes. Overall fit is high for all scenarios, with R squared ranging from 0.903 to 0.940. The best fit is for the Male 20K design in both pipelines, with R squared about 0.938 for MiXBLUP and about 0.940 for BLUPF90IOD3. Slopes are close to one across all rows, ranging from 0.959 to 1.035, suggesting limited overall scaling bias. Intercepts vary more: MiXBLUP intercepts are modest, about 1.877 to 3.201, while BLUPF90IOD3 intercepts range widely from 2.656 up to 16.175, especially for Female 30K and All male. Because intercepts and slopes summarize calibration, similar R squared values can still mask differences in systematic offset between methods and training designs.
 ${\hat \beta _0}$, intercept;
 ${\hat \beta _1}$, slope; R 2, coefficient of determination.
The number of iterations performed by each software

Table 5 Long description
The table reports how many iterations two software packages, MiXBLUP and BLUPF90IOD3, performed for eight datasets. For MiXBLUP, the highest count is 551 on Female_30K and the lowest is 364 on Random_20K_truncated. For BLUPF90IOD3, the highest count is 707 on Male_20K and the lowest is 284 on Random_20K_truncated. BLUPF90IOD3 uses more iterations than MiXBLUP for Male_20K, Random_20K, All_male, Female_30K_truncated, and All_male_truncated, while MiXBLUP uses more for Female_30K, Male_20K_truncated, and Random_20K_truncated. Truncation reduces iterations for both tools on Random_20K and Female_30K, but increases iterations for BLUPF90IOD3 on All_male and for MiXBLUP on Male_20K. These counts reflect iteration behavior for the listed runs and do not by themselves indicate accuracy or runtime without additional context.
Discussion
This study aimed to compare two software implementations of the G-BLUP model, which is most commonly used for routine genetic evaluations on a national scale, MiXBLUP and BLUPF90IOD3. Both programs provided very similar performances in terms of the quality of prediction of GEBVs, expressed either by the correlation between GEBVS predicted from truncated and full datasets or by the official criterion applied to national routine evaluations, expressed by the Interbull GEBV validation test. A comparison of different core animal scenarios showed high compatibility of breeding value estimates. These results are consistent with the APY solver, which assumes that the number of individuals, rather than their detailed composition, is crucial (Misztal et al., Reference Misztal, Legarra and Aguilar2014; Fragomeni et al., Reference Fragomeni, Lourenco, Tsuruta, Masuda, Aguilar, Legarra, Lawlor and Misztal2015). Studies have indicated that the random selection of a large group of core animals provides accuracy comparable to cores created according to more advanced criteria (Misztal et al., Reference Misztal, Lourenco and Legarra2020), which explains the similar results in our scenarios. Any slight difference between the two software programs was due to numerical differences in the algorithms rather than substantive errors. Practically, this means that both MiXBLUP and BLUPF90IOD3 can be used interchangeably for routine evaluation, providing reliable results. Finally, our results confirm that, regardless of the choice of software, reliable predictions of estimated breeding values can be obtained. Both programs fulfil their role and provide similar results, while the main difference is in the usability and technical aspects rather than in the quality of the results. Regarding the availability of fitting different genetic evaluation models, MiXBLUP, apart from the G-BLUP, also allows for the implementation of the GT-BLUP and the SNP-BLUP solvers, which makes it more flexible in terms of the choice of GEBV estimation procedures.
In conclusion, our comparison demonstrated that both G-BLUP implementations are very similar in terms of predicted GEBVs; therefore, the choice of a particular program for routine national genetic evaluation needs to be based on other criteria, such as price, support, computational efficiency or data modelling flexibility.
Acknowledgements
The computations were carried out on the server of the Centre of Genetics of the Polish Federation of Cattle Breeders and Dairy Farmers.
Competing interests
The author(s) declare none.