

Introduction
The biochar market in the US is expected to grow at a compound annual growth rate of 11.3% from by 2030 and has had production increase 91% between 2021 and 2023 valued at 995 million USD ($) globally in 2025 (Herath Bandara Reference Herath Bandara2025; IBI and USBI 2023; Precedence Research 2025). This growth trajectory represents an innovation opportunity for the Northeast bioeconomy, where abundant forest biomass, established pyrolysis technologies, and proximity to agricultural markets create competitive advantages for biochar production and utilization. Biochar is a carbon-rich material created through pyrolysis, an anaerobic process that heats organic biomass feedstocks like animal manure or wood chips at high temperatures to produce a substance with varying characteristics depending on the production conditions (Lehmann et al. Reference Lehmann, Cowie, Masiello, Kammann, Woolf, Amonette, Cayuela, Camps-Arbestain and Whitman2021). Field studies have demonstrated biochar’s capacity to enhance agricultural productivity through multiple pathways: improving soil pH balance, increasing nutrient retention and availability (particularly phosphorus, potassium, and nitrogen), enhancing water holding capacity, and remediating contaminated soils (Biederman and Harpole Reference Biederman and Harpole2013; Wang et al. Reference Wang, Chi, Liu and Wang2019).
These soil improvements can translate into measurable yield gains, particularly in degraded or marginal agricultural lands common throughout the Northeast region of the United States. For example, Timmons et al. (Reference Timmons, Lema-Driscoll and Uddin2017) estimated that agricultural values in Massachusetts could increase by $57/megagram (Mg or metric tonne) of biochar applied through yield gains, liming substitution, and nutrient retention. Biochar has also strong climate change mitigation potential and could potentially generate a carbon dioxide removal credit between $95 and $145/Mg carbon dioxide equivalent (tCO2e) (Elias et al. Reference Elias, Sanchez, Saksa, Hunt and Remucal2024). Water cost savings from using biochar have been estimated to reduce irrigation costs by 50%, and biochar is particularly suited for the Northeast’s sandy soils (Ciolkosz et al. Reference Ciolkosz, Waltman, Simpson and Dobos1989; Kroeger et al. Reference Kroeger, Pourhashem, Medlock and Masiello2020). Early investment and research in this technology are pivotal for capitalizing on this growth and advancing technology in the US through R&D to strengthen the bioeconomy.
Although biochar has demonstrated to have multiple environmental benefits, its widespread adoption faces multiple barriers that typify agricultural innovation challenges (Pourhashem et al. Reference Pourhashem, Hung, Medlock and Masiello2019). Economic constraints represent the primary obstacle: high production costs and performance variability limit biochar’s competitiveness compared to conventional soil amendments such as chemical fertilizers (Chen et al. Reference Chen, Han, Dong, Li and Zhang2024; Galinato et al. Reference Galinato, Yoder and Granatstein2011). These cost disadvantages are particularly pronounced in regions like the Northeast United States, where abundant woody biomass resources exist alongside economic hurdles and social distrust that have historically constrained implementation of novel agricultural technologies (Lie-Nielsen Reference Lie-Nielsen2024). The innovation adoption gap is further widened by limited farmer awareness and skepticism regarding biochar’s agricultural benefits, which vary considerably depending on feedstock type, soil characteristics, and climatic conditions, thereby creating uncertainty that can deter investment in new practices (Campion et al. Reference Campion, Bekchanova, Malina and Kuppens2023).
The magnitude of this market failure is evident in the disconnect between production costs and market demand. Farmers’ willingness to pay for biochar remains relatively low, estimated at under $100/Mg in many cases, while median biochar production costs range from $450 to 1845/Mg, creating a substantial gap that prevents market-driven adoption (Latawiec et al. Reference Latawiec, Królczyk, Kuboń, Szwedziak, Drosik, Polańczyk, Grotkiewicz and Strassburg2017; Nematian et al. Reference Nematian, Keske and Ng’ombe2021; Vochozka et al. Reference Vochozka, Maroušková, Váchal and Straková2016). This price-benefit mismatch reflects a classic innovation externality problem, where biochar’s environmental and long-term soil health benefits, including carbon sequestration, undervalued fertilizer reductions, and enhanced agricultural resilience (ability of agricultural systems to resist, recover and adapt from climate-related disruptions), are not captured in market pricing mechanisms. For example, a societal techno-economic assessment (TEA) calculated environmental and societal externalities net present value (NPV) at $540 million for biochar produced from tree bark (Campion et al. Reference Campion, Malina, Haeldermans and Kuppens2021). Without targeted policy interventions to bridge this valuation gap and provide whole-of-government support for the biochar value chain, private investment in large-scale production systems will remain economically unattractive, limiting the technology’s contribution to regional agricultural productivity and environmental goals (Campion et al. Reference Campion, Bekchanova, Malina and Kuppens2023; Pourhashem et al. Reference Pourhashem, Hung, Medlock and Masiello2019; Rodriguez Franco et al. Reference Rodriguez Franco, Page-Dumroese, Pierson, Miller and Miles2024).
Extensive research has documented biochar’s technical benefits, but limited analysis exists on policy instruments that could accelerate market development, particularly within a regional bioeconomy context. This gap is particularly problematic given biochar’s potential dual role as both an agricultural innovation and a climate mitigation technology (Meuwissen et al. Reference Meuwissen, Feindt and Spiegel2019), which positions it uniquely within emerging policy frameworks that seek to integrate productivity gains with environmental outcomes. Understanding how policy design affects biochar commercialization is crucial for Northeast US policy makers seeking to leverage the region’s biomass resources for agricultural and economic development. Moreover, the Northeast’s distinctive characteristics, including diverse agricultural systems, abundant forest resources, established research institutions, and coordinated regional governance structures, create opportunities for policy innovation that could serve as a model for other regions facing similar agricultural sustainability challenges.
To address these marked development challenges, we conducted a structured narrative policy literature review across multiple countries to identify successful policy instruments that could be adapted for the Northeast US bioeconomy market conditions. Our analysis classified these policy approaches into three distinct policy instruments: financial (e.g., loan guarantees & operation subsidies), nonfinancial (e.g., regulation & informational campaigns), and research and development (e.g., research funding & demonstration projects). By sorting gathered approaches, we identified explicit and implicit policies that could inform and aid the Northeast US in initializing a large-scale biochar market, advancing biotechnological markets strengthening supply chain resilience and regional economic security. This integrated approach allows us to move beyond theoretical policy recommendations to provide more empirically grounded guidance on which policies are more likely to achieve cost-competitive biochar production and consumption while supporting broader regional bioeconomy development goals.
We complement the global policy review and translate policy insights into quantifiable economic impacts by developing a techno-economic breakeven model that estimates production cost changes under varying policy scenarios. Our economic analysis evaluates biomass procurement and biochar production at different facility scales using two technology configurations to determine how policy interventions affect production costs under plausible Northeast US conditions. This modeling approach enables us to identify the most cost-effective policy combinations for achieving economically viable biochar production while maximizing benefits to regional agricultural productivity and environmental sustainability. The findings provide policy makers with quantitative guidance for designing integrated policy frameworks that can transform biochar from a promising but economically constrained technology into a competitive component of the Northeast US bioeconomy.
Methodology
Policy literature review
Our structured narrative review adapts the policy categorization framework developed by Pourhashem et al. (Reference Pourhashem, Hung, Medlock and Masiello2019) and classifies biochar support mechanisms into three primary policy instruments: financial, nonfinancial, and research and development (Cubbage et al. Reference Cubbage, Harou and Sills2007). We expand current biochar policy research by including global legislation and political plans focusing on achieving net-zero emissions, reflecting the evolving biochar policy landscape. This review focused on articles published from 2010–2025, and the search strategy targeted keywords such as biochar, biomass, economic, implementation, carbon credits, market, stability, and policy. Following an iterative search and screening process, we identified 50 policy publications for detailed analysis. This final sample size was determined by reaching theoretical saturation, that is, the point at which additional documents yielded diminishing returns in terms of novel policy strategies and began showing repetitive patterns in both policy instruments and implementation challenges across jurisdictions.
We employed the NVivo 15 qualitative software package to systematically identify, code, and analyze our 50 policy publications, identifying key components that support biochar’s market development at local, national, and international scales. Our document selection prioritized countries and regions that have most actively promoted biochar as a climate mitigation or natural climate solution tool, ensuring representation across different policy maturity levels and institutional contexts. Our analysis encompassed three geographic scopes: the US state of Maine (11% of all analyzed articles), broader US federal and state policies (30%), and international policies from 16 countries (59%). This distribution reflects both the regional focus of our study and the need to capture diverse policy approaches from established biochar markets in Europe, Asia, and Australia that could inform Northeast US policy development.
Our document selection process began with database searches using Google Scholar and Web of Science, employing the abovementioned keywords to identify biochar relevant policy literature. Initially abstracts and introductions were reviewed to determine if articles were relevant to be included in the analysis. Full-text analysis was then conducted for the 50 selected articles that explicitly discussed policy mechanisms affecting biochar production, adoption, or market development. The international article selection was primarily achieved by screening key review articles – for example; Conte et al. Reference Conte, Schmidt, Cimò, Guo, He and Uchimiya2015 which compiled European biochar projects in Germany, the United Kingdom, Finland, Spain, Norway, Italy, Belgium, Denmark, and Estonia – and applied similar selection criteria to other continents. This approach ensured geographic diversity while focusing on jurisdictions with demonstrated policy activity that could inform Northeast US contexts. All selected documents were required to be in English, a notable limitation of our review process.
The policy coding framework employed a hierarchical structure within NVivo to systematically organize the relevant policy information. Primary codes distinguished between explicit policies (directly referencing biochar) and implicit policies (supporting biochar through broader policy frameworks like biomass utilization or carbon sequestration) for each of the papers analyzed. Secondary coding applied 14 child codes relating to: regional Northeast biomass barriers, worldwide barriers, international policy strategies, regional northeast policy strategies, worldwide perspectives, regional northeast perspectives, production efficacy via policy, regulatory policies, and financial support. This dual-level coding system enabled both country-specific policy analysis and the comparison of cross-jurisdictional instrument effectiveness, thereby creating a foundation for systematically identifying policy approaches that could be potentially suitable for the Northeast US biochar and wider bioeconomy market.
Economic case study model
To explore the economics of biochar at a commercial scale, a TEA was conducted based on a model centralized biochar plant using small-diameter trees and woody residues as feedstock. The model was designed to be transparent and transferable so that policy makers can adapt it to other regional settings by replacing local technical, financial, and policy inputs. The TEA model determines the minimum biochar selling price (MSP), denoted as
 $P^{*}$
, at which a proposed pyrolysis facility achieves a NPV of zero over its economic life (i.e., the breakeven price). At this breakeven condition, the present value of revenues equals the present value of costs after accounting for policy incentives and co-product revenues:
 $NPV=PV({\rm Revenues})-PV({\rm Costs})=0$
Solving Eq. (1) for the biochar price gives:
 $P^{*}={PV_{cap}+PV_{\textit{working}}+S_{up}-PV_{tax}+OpEx\times AF \over Q\times AF}-P_{\textit{carbon}}\times CR-Sub-{R_{\textit{cproducts}} \over Q}$
where
 $P^{*}$
is the minimum selling price ($/Mg), PVcap is the present value of capital recovery, PVworking is the net present cost of working capital, Sup is startup and commissioning cost, PVtax is the present value of the depreciation tax shield, OpEx is total annual operating expenditure, Q is annual biochar output (Mg/yr), and AF is the present-value annuity factor. Pcarbon is the carbon credit price ($/tCO2e), CR is the carbon sequestration rate (tCO2e/Mg biochar), Sub is an operating subsidy ($/Mg biochar), and Rcproducts is annual co-product revenue ($/yr). Labor does not appear as a separate term in Eq. (2) because it is incorporated in OpEx through the payroll component.
The case study is based on a proposed facility in Ashland, Aroostook County, Maine, a location characterized by substantial forest biomass availability and proximity to agricultural markets, where over 90% of Maine’s potatoes are cultivated a potentially large local market for the produced biochar (Sharma Reference Sharma and Bali2017). The production cost of biochar ($/Mg) was calculated from any policy-driven credits and costs, disaggregated into fixed capital investment, operating costs (staffing, maintenance, overhead, feedstock, utilities, consumables), and working capital (Ahmed et al. Reference Ahmed, Pokharel, Miesel and Saffron2025; Sessions et al. Reference Sessions2019). Capital cost, labor, and energy requirements were scaled from the 45,360 dry Mg/yr reference facility using standard power-law relationships (Caduff et al. Reference Caduff, Huijbregts, Althaus and Hendriks2011; Tsagkari et al. Reference Tsagkari, Couturier, Kokossis and Dubois2016) and location-specific rates (EIA 2025a, 2025b, 2025c), while feedstock costs and supply assumptions were parameterized from the 2023 U.S. Billion-Ton Report (U.S. Department of Energy 2024). All monetary values were converted to 2025 U.S. dollars using appropriate producer and consumer price indices and assumed to remain constant over time and scenario, unless specified otherwise.
The analysis considers three facility scales (20,000, 50,000, and 100,000 dry Mg/yr) and two process configurations representative of commercial biochar systems in the region: S2, which includes thermal processing with heat recovery from pyrolysis gas combustion, and S4, which adds electricity generation and condensable liquid recovery. At the reference scale, S2 has lower capital cost but higher grid electricity demand, whereas S4 requires greater upfront investment but lowers purchased electricity and generates additional co-product revenue. Four policy instruments were evaluated individually and in combination: carbon credits, investment tax credits (ITCs), output-based production subsidies, and loan guarantees. Carbon credits were treated as an annual revenue stream based on biochar output and the assumed sequestration rate. ITCs and analogous capital cost-sharing programs were represented as reductions in effective upfront capital cost, with corresponding adjustments to depreciable basis where relevant. Operating subsidies were modeled as per-unit payments that directly reduce the required selling price. Loan guarantees were treated as financing interventions that reduce the capital-financing rate used in the capital recovery calculation, rather than the general discount rate applied to recurring annual costs and revenues. All policy scenarios were compared with a baseline case without policy support. Detailed equations (Eq. A1–A17), variable definitions, and parameter values are reported in the supplemental methodology, Table S3 and S4.
Sensitivity and uncertainty were evaluated using complementary deterministic and stochastic approaches. First, we conducted a one-at-a-time sensitivity analysis in which each parameter was varied over a plausible range while all other inputs were held at their baseline values. Parameters were selected to reflect the major terms in the MSP equation, including capital recovery, key operating costs, and policy-related revenue offsets. In cases where empirical bounds were unavailable, technical and market parameters were varied by ± 20% around their baseline values, while policy variables were varied over ranges consistent with program design. Additional details are provided in the supplementary material. Second, joint uncertainty in the MSP was assessed using Monte Carlo simulation with Latin hypercube sampling (McKay et al. Reference McKay, Beckman and Conover2000). Uncertain inputs were represented by independent triangular distributions defined by lower-bound, most-likely, and upper-bound values. Nine inputs were sampled jointly: feedstock cost, biochar yield, discount rate, capital-cost multiplier, energy-cost multiplier, carbon credit price, transport distance, labor-cost multiplier, and plant utilization. The full TEA model was evaluated for 10,000 iterations for each configuration.
Results
Our systematic literature review of 50 policy publications from 17 countries revealed distinct patterns in the use of policy instruments to incentivize biochar production and consumption. Nonfinancial strategies comprised 63%, R&D related policies accounted for 27%, and financial instruments represented about 10% of coded references. This distribution suggests that most jurisdictions frequently discuss regulatory frameworks and information-based approaches rather than direct financial support for biochar market development.
Several countries demonstrated particularly instructive policy approaches. Vietnam’s explicit biochar policies offered the most comprehensive strategic framework, prioritizing organic fertilizer projects that include biochar and establishing national standards for organic agriculture that directly support biochar adoption as a sustainable soil amendment. Norway’s Climate Action Plan provides an implicit support mechanism through a proposed mineral fertilizer tax that would simultaneously reduce greenhouse gas emissions and generate revenue for green technology innovation, creating economic incentives for biochar adoption (Norwegian Ministry of Climate and Environment 2021). Japan’s Environment Innovation Strategy supports biochar via a multi-phased approach to clean technology investment and development (Japan et al. 2021), while China’s ecological civilization framework promotes low-carbon technologies such as biochar as part of integrated economic, political, and social development goals (He Reference He, Li, Zhang, Wang, Dong, Du, Chang, Ou, Guo, Tian, Gu, Teng, Hu, Yang, Chen, Yao, Yuan, Zhou, Zhao and Li2022).
Policy literature review
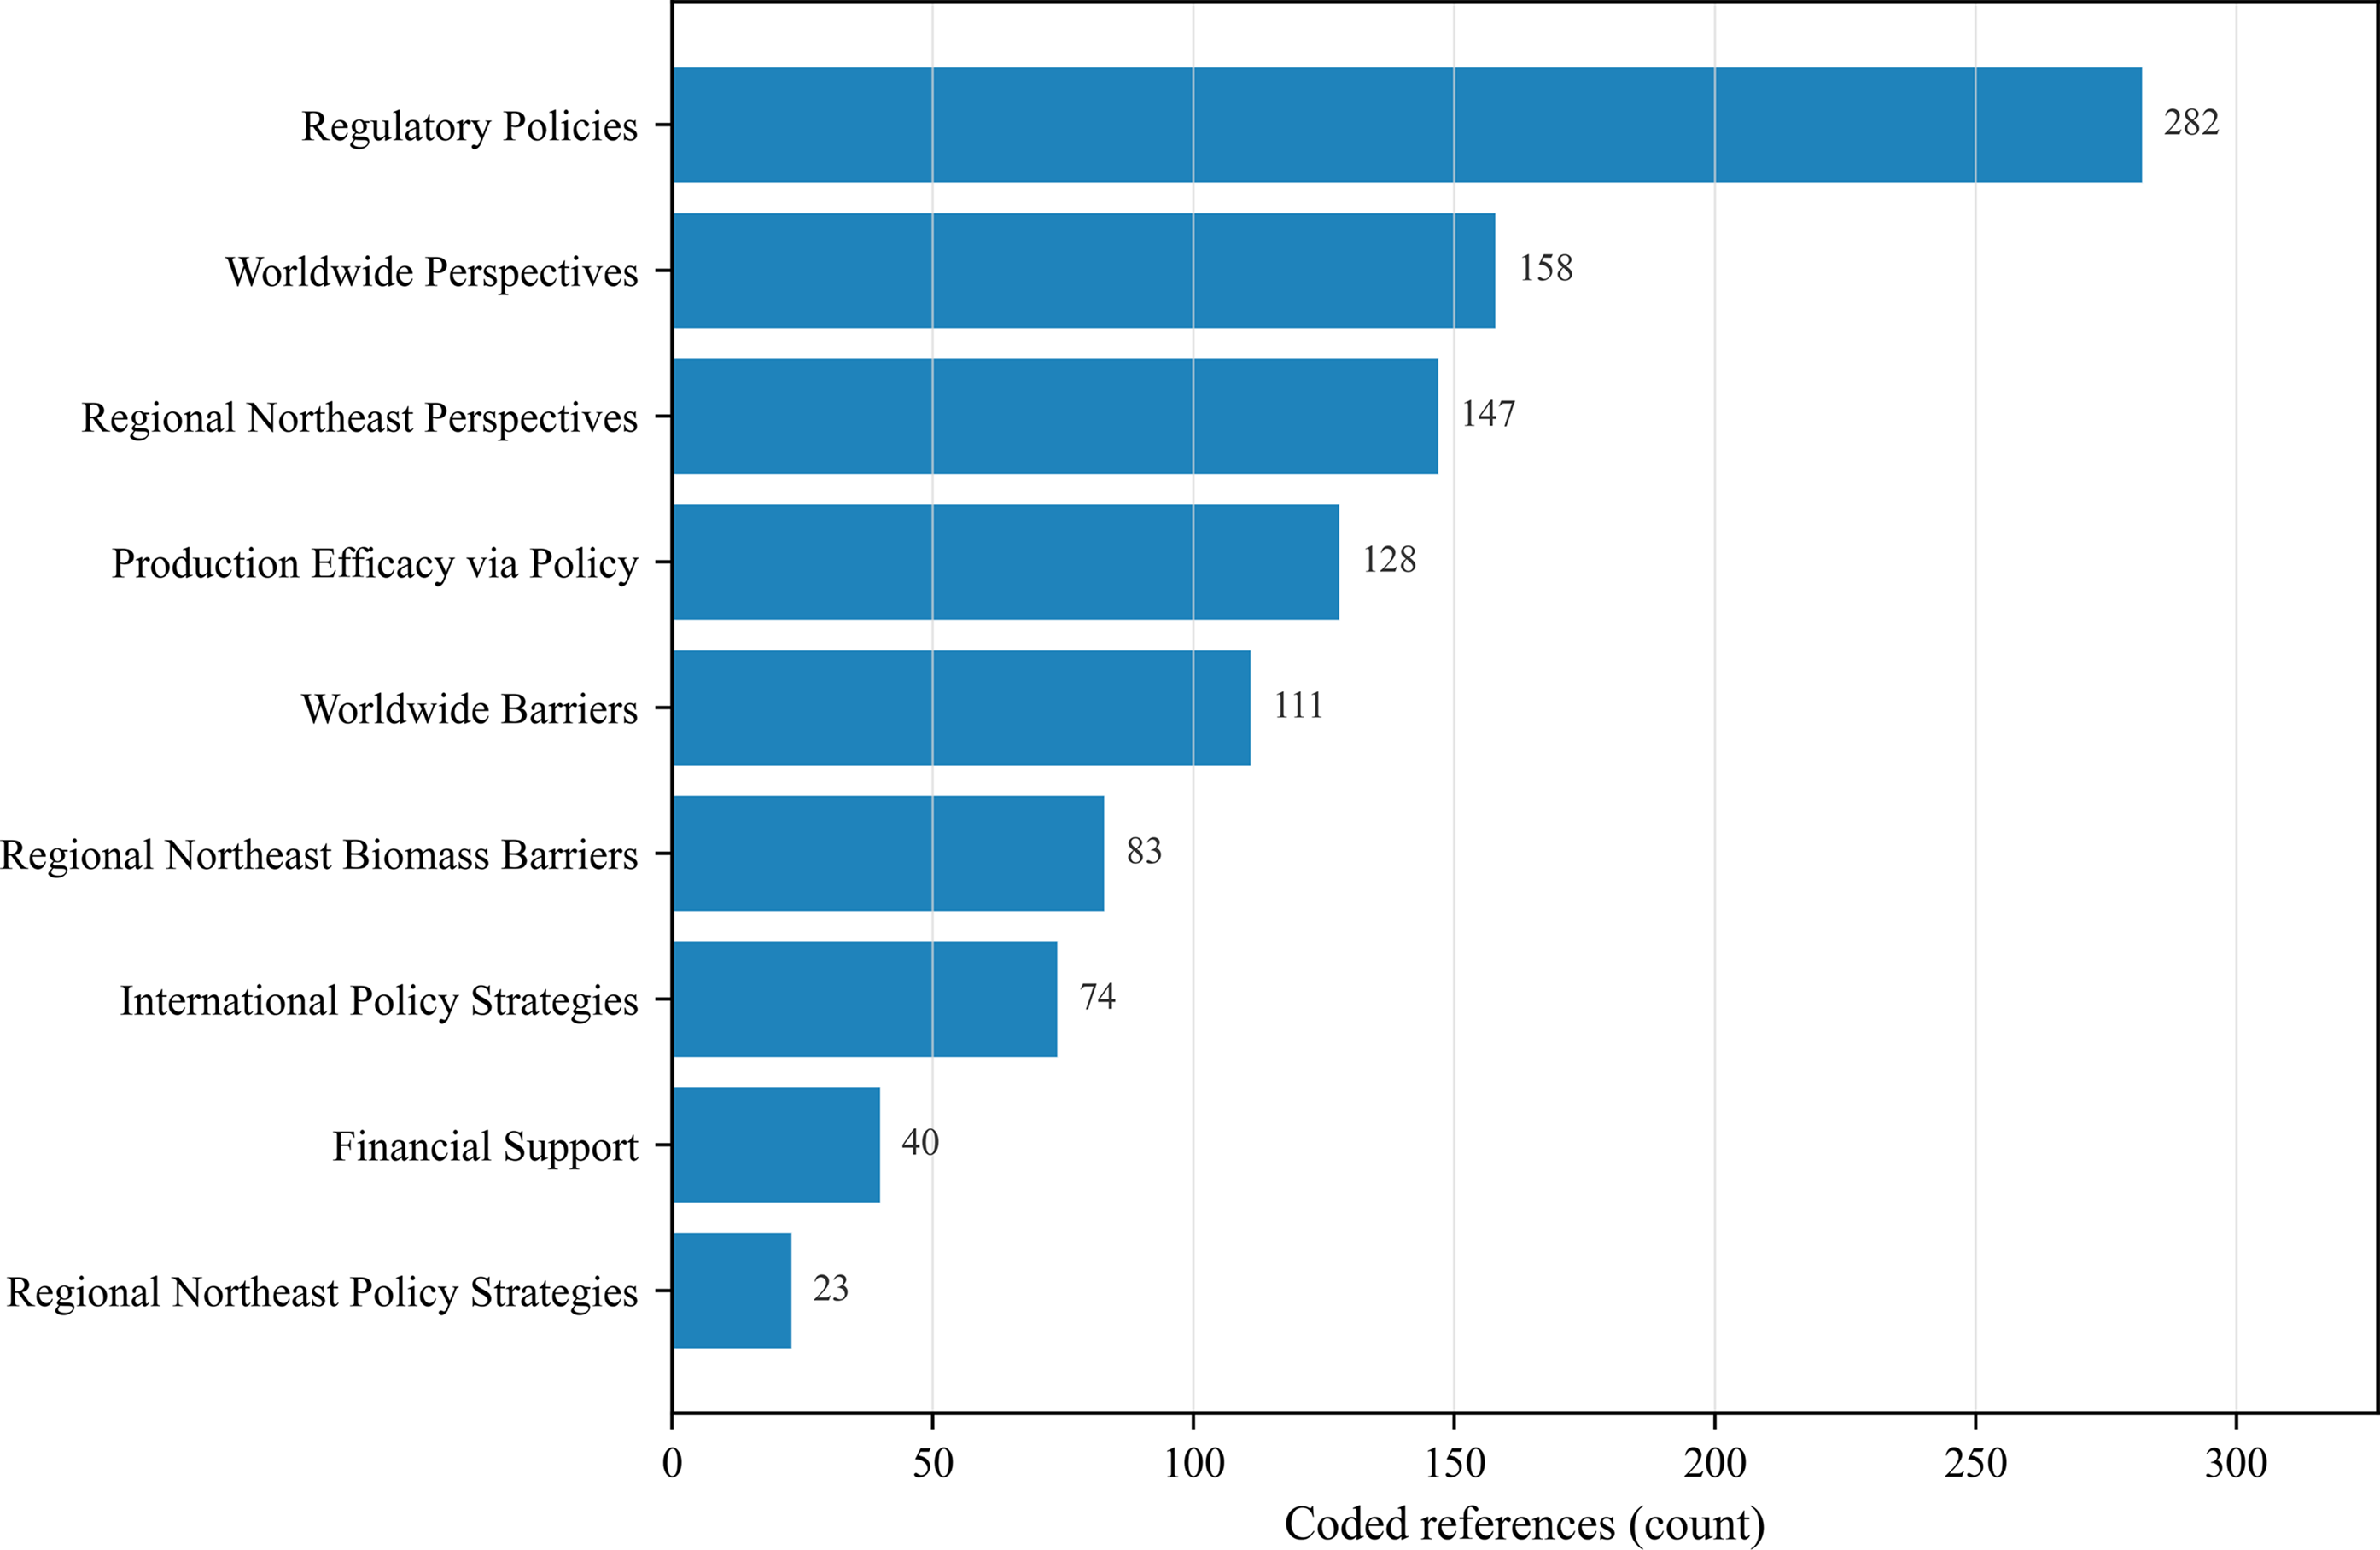
The global biochar policy review identified relevant frameworks that are being considered in at least 17 countries. The geographic distribution of analyzed documents encompasses policy frameworks from North America (41%), Europe (35%), Asia (18%), and other regions (6%), highlighting diverse representation varying by institutional context, economic development, and policymaking stage. This broad approach allows us to identify policy mechanisms that may be implemented in the Northeast US and also highlight how different jurisdictions have adopted biochar support strategies applicable to their specific agricultural, economic, and regulatory systems. Regulatory policies and worldwide perspectives were the most prominent information found in our biochar documents (Figure 1). Strategies had the least references both regionally and internationally, indicating that at biochar’s current state, more barriers and perspectives on its future exist. For this analysis, we pay particular attention to explicit policies that target biochar development and implicit policies that support biochar through broader sustainability or agricultural frameworks.
Coded references for barriers, strategies, perspectives, production, regulation, and financial support stemming from the policy literature review (N = 50).
Our global comparison reveals that biochar policy approaches can differ across regions, resulting in broad but variable relevance for Northeast US policy development (Table 1). The United States demonstrates fragmented support for biochar. Federal programs like the 45Q tax credit and USDA’s Environmental Quality Incentives Program (EQIP) provide indirect support, while state-level initiatives such as New York’s multi-million-dollar investment in nature-based climate solutions and Pennsylvania’s RISE PA program offer more targeted incentives (Code of Federal Regulations 2025; NYSERDA 2024; RISE PA 2025; 26 U.S.C. § 45Q, 2025). On the contrary, Australia explicitly includes biochar as eligible for Australian Carbon Credit Units through its Emissions Reduction Fund (Cox et al. Reference Cox, Downie, Hickey, Jenkins, Lines-Kelly, McClintock, Powell, Singh and van Zwieten2012), and the ANZBIG roadmap targets a multibillion-dollar biochar industry by 2030 utilizing over 50 million tonnes per year of accessible crop and forest residues (ANZBIG 2021).
Summary of regional biochar policy approaches
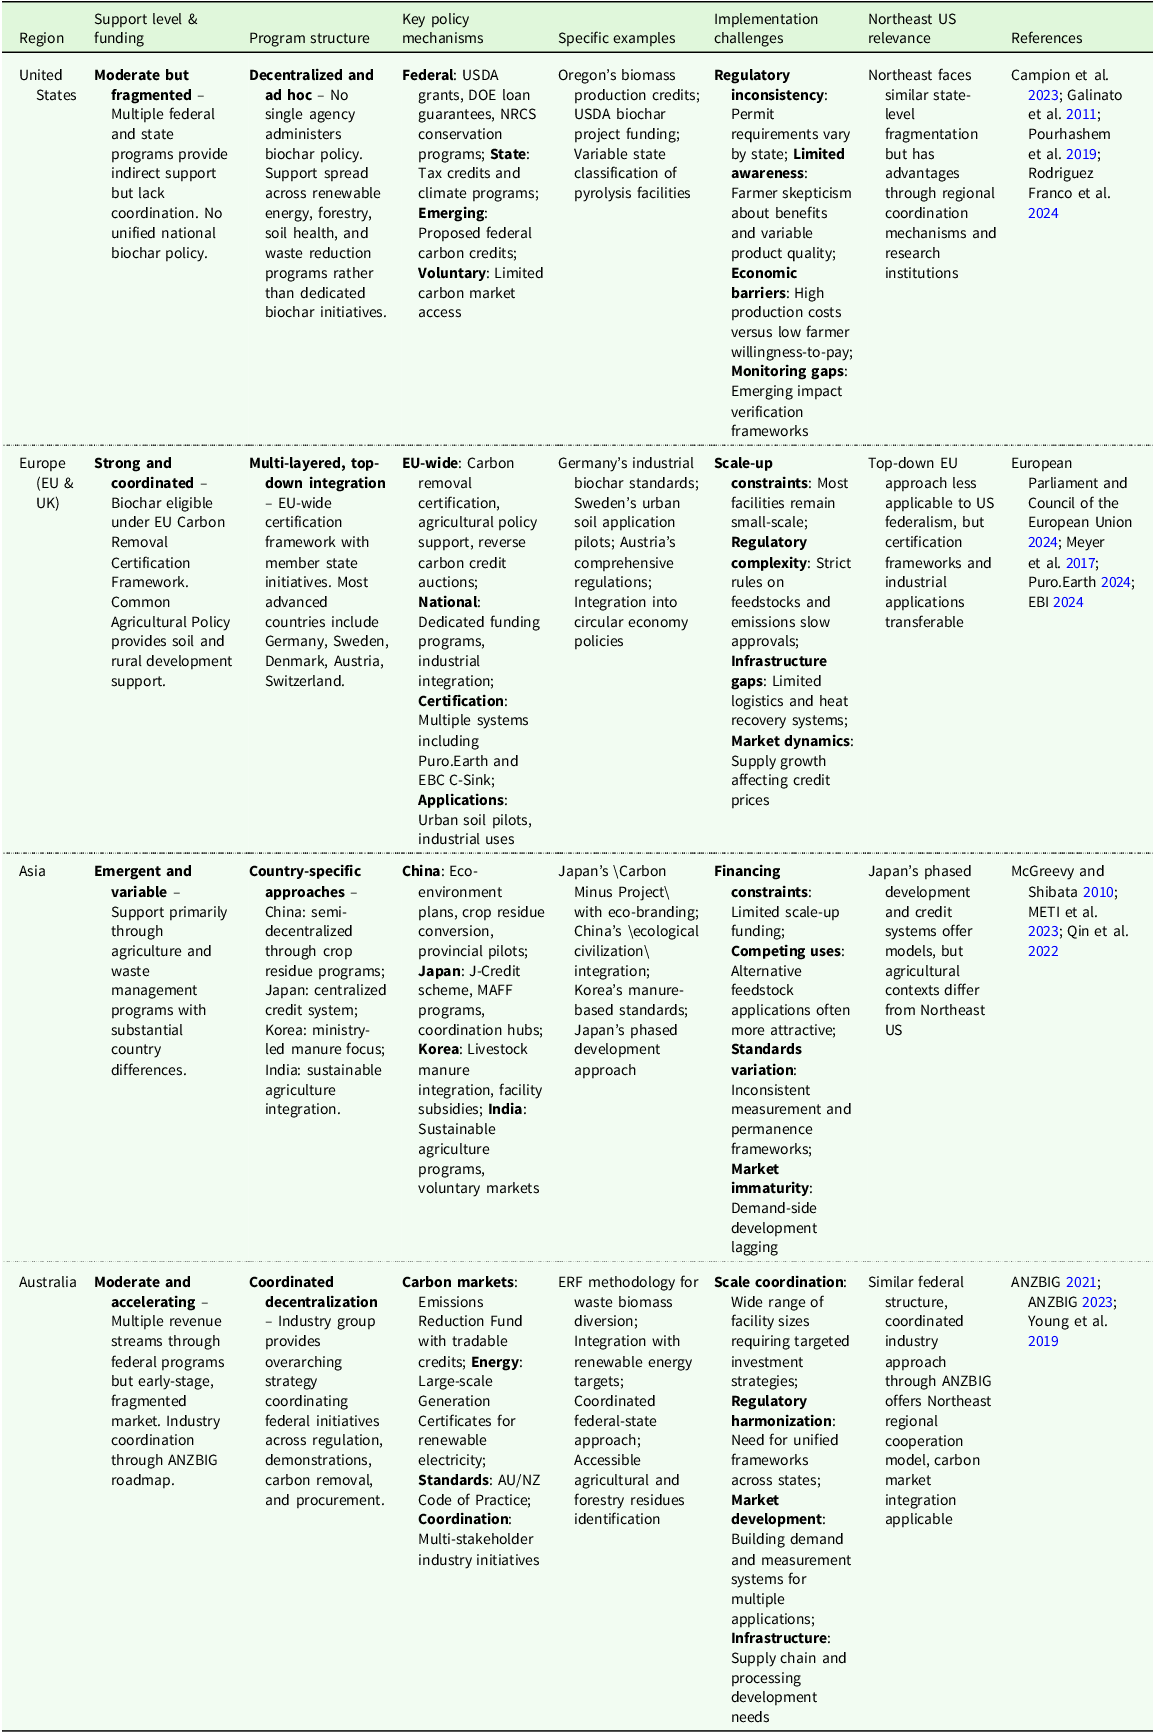
Table 1. Long description
The table compares biochar policy approaches across different regions, focusing on support level and funding, program structure, key policy mechanisms, specific examples, implementation challenges, and relevance to Northeast US policy development. It includes four main regions: United States, Europe (EU & UK), Asia, and Australia. Each region is detailed with specific policies, examples, and challenges. The table has six columns: Region, Support level & funding, Program structure, Key policy mechanisms, Specific examples, Implementation challenges, Northeast US relevance, and References. The rows provide detailed information for each region, including federal, state, and voluntary programs, specific examples of biochar initiatives, and the challenges faced in implementation. The table also includes references for further reading.
Additionally, several federal and state programs provide financing support that could benefit biochar facilities. The USDA’s Section 9003 Biorefinery, Renewable Chemical, and Biobased Product Manufacturing Assistance Program (7 U.S.C. § 8103, 2020) offers loan guarantees for qualifying biobased manufacturing projects. State-level entities such as the Finance Authority of Maine (FAME) provide additional financing mechanisms including revenue bonds, direct loans, and loan insurance programs specifically designed to support manufacturing and environmental technology projects (Mainebiz 2021). These programs effectively transfer repayment risk from private developers to public guarantors, enabling access to capital at below-market rates.
We also found that Asian approaches vary across countries in the region. China has integrated biochar within its ecological civilization framework, thereby promoting advanced low-carbon technologies across economic and social development sectors (He et al. Reference He, Li, Zhang, Wang, Dong, Du, Chang, Ou, Guo, Tian, Gu, Teng, Hu, Yang, Chen, Yao, Yuan, Zhou, Zhao and Li2022). Japan’s Environment Innovation Strategy provides explicit support through its J-Credit scheme, backed by Ministry programs that award credits for on-farm biochar application (Japan et al. 2021). However, Europe was found to have a more unified effort to promote biochar. For example, the EU emphasizes regulatory coordination through the 2024 EU’s Carbon Removal Certification Framework that provides unified standards for permanent carbon removals, including biochar (European Parliament and Council of the European Union 2024). EU member states also complement this with a range of targeted initiatives. Denmark has set threshold limits for biochar use (Meyer et al. Reference Meyer, Genesio, Vogel, Schmidt, Soja, Someus, Shackley, Verheijen and Glaser2017). Norway has used its Climate Action Plan to propose mineral fertilizer taxes to fund green technology innovation (Norwegian Ministry of Climate and Environment 2021). Finland has implemented municipal procurement programs for low-emission solutions to support the transition toward a circular economy (City of Helsinki 2018).
All regions of the globe appear to face similar implementation challenges that can offer important lessons for Northeast US biochar development. Regulatory inconsistency emerges as a universal barrier, whether through state-by-state variation in the United States, the need for harmonization across Australian territories, or evolving frameworks for feedstock use in Europe. Economic constraints represent another shared challenge: the US struggles with high production costs relative to farmer willingness-to-pay, Europe faces scale-up funding gaps despite strong policy support, Asia confronts competing feedstock uses that often prove more economically attractive than biochar, and Australia requires large investments to transition from small-scale to industrial operations. Infrastructure and market development limitations compound these economic barriers, with Europe citing underdeveloped feedstock logistics and heat recovery systems, Asia highlighting demand-side immaturity and quality control issues, and Australia emphasizing the need for coordinated supply chain development. Finally, all regions grapple with measurement and verification challenges: the US lacks standardized frameworks for long-term impact assessment, Europe faces complexity in meeting strict emissions and application standards, and Asia struggles with inconsistent monitoring, reporting, and verification systems. These cross-cutting challenges suggest that a successful Northeast biochar policy should simultaneously address regulatory clarity, economic viability, infrastructure development, and robust measurement systems.
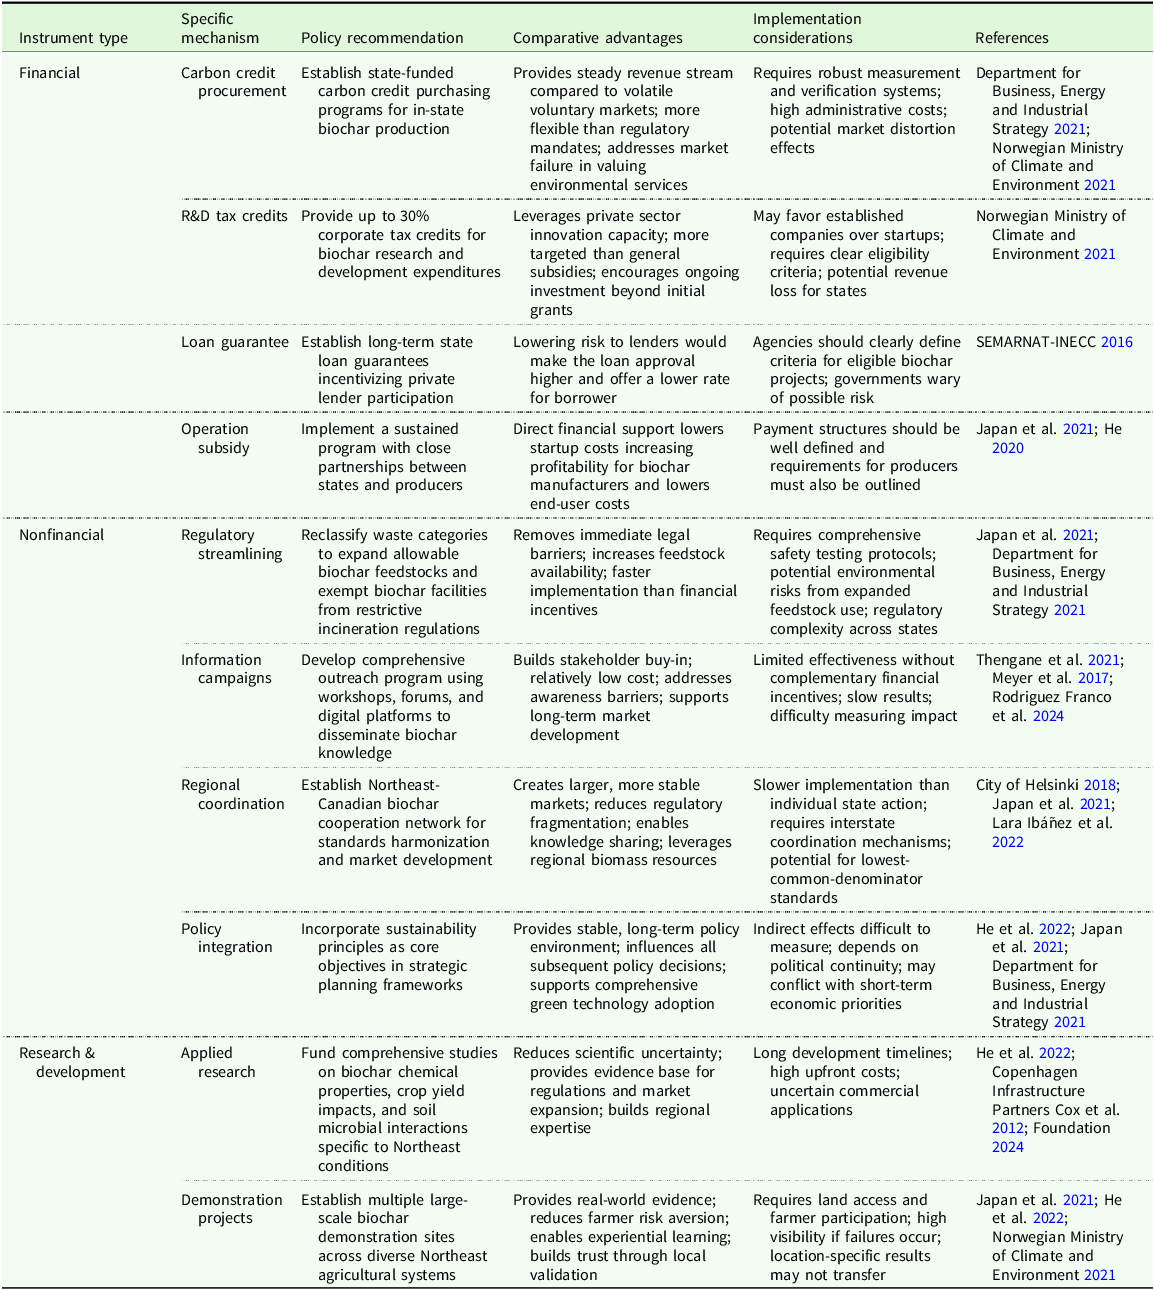
Our global policy review identified eight distinct policy mechanisms that could address the primary market failures and coordination challenges identified and be adapted to Northeast US institutional and economic conditions (Table 2). For a full list of the documents and generated policy options, please see Table S1 and S2. The selected mechanisms have also demonstrated effectiveness in similar government structures and agricultural systems.
Summary of policy instruments to consider for Northeast US biochar market
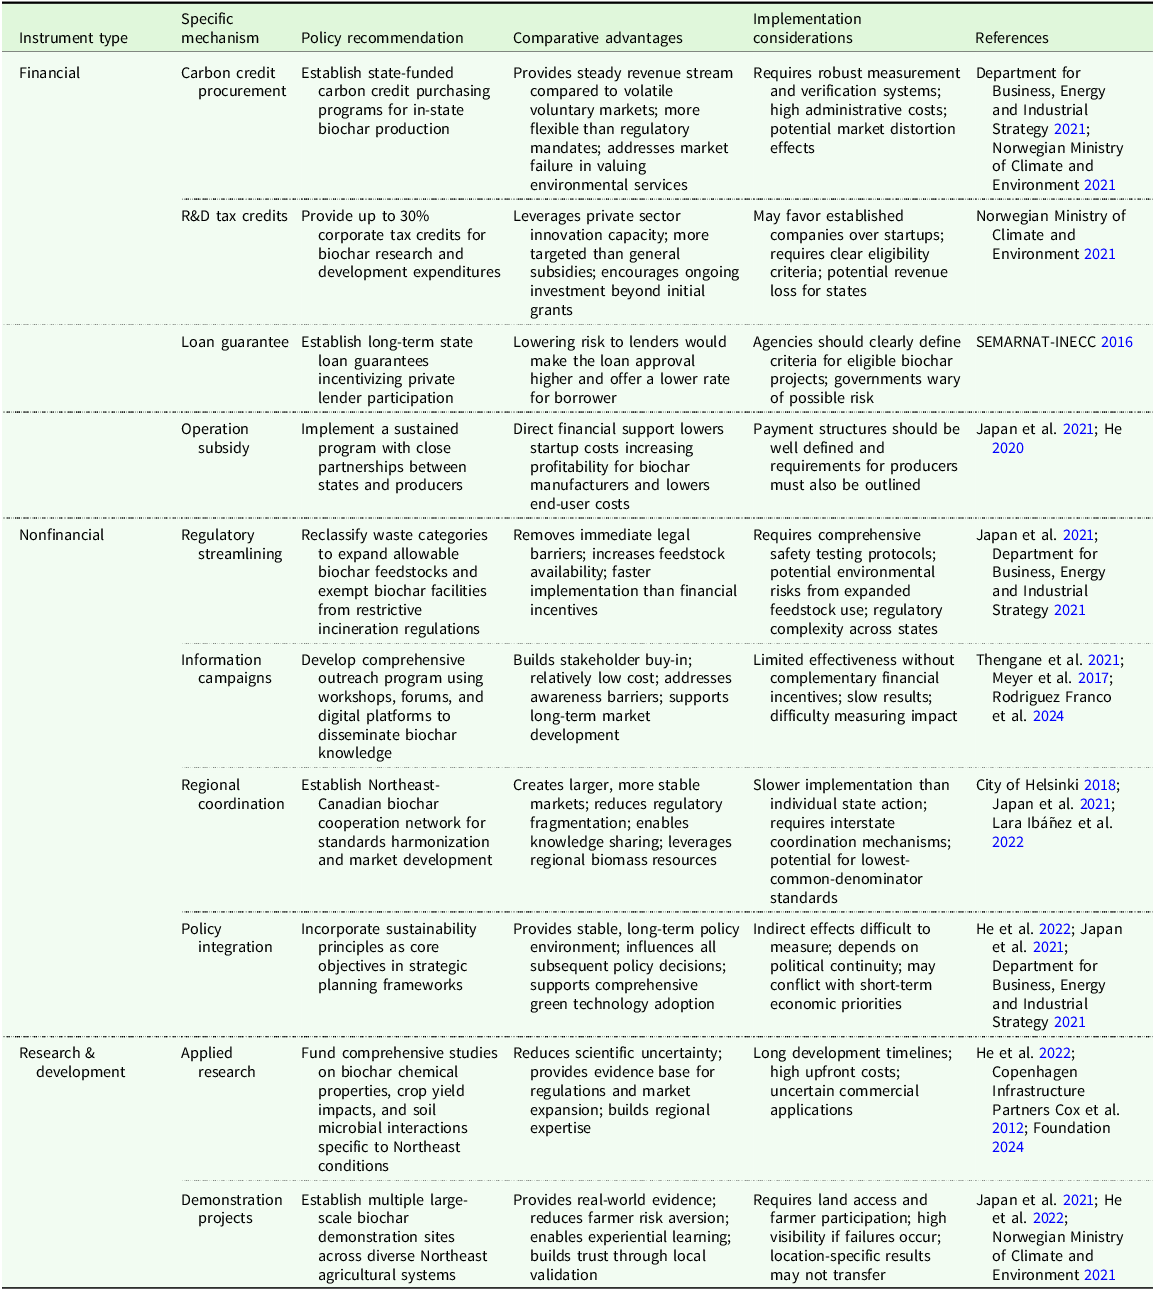
Table 2. Long description
A table comparing policy instruments for biochar market development. The table has 10 rows and 5 columns. Column headers are Instrument type, Specific mechanism, Policy recommendation, Comparative advantages, Implementation considerations, and References. Row 1: Instrument type, Financial; Specific mechanism, Carbon credit procurement; Policy recommendation, Establish state-funded carbon credit purchasing programs for in-state biochar production; Comparative advantages, Provides steady revenue stream compared to volatile voluntary markets; more flexible than regulatory mandates; addresses market failure in valuing environmental services; Implementation considerations, Requires robust measurement and verification systems; high administrative costs; potential market distortion effects; References, Department for Business, Energy and Industrial Strategy 2021; Norwegian Ministry of Climate and Environment 2021. Row 2: Instrument type, Financial; Specific mechanism, R&D tax credits; Policy recommendation, Provide up to 30 percent corporate tax credits for biochar research and development expenditures; Comparative advantages, Leverages private sector innovation capacity; more targeted than general subsidies; encourages ongoing investment beyond initial grants; Implementation considerations, May favor established companies over startups; requires clear eligibility criteria; potential revenue loss for states; References, Norwegian Ministry of Climate and Environment 2021. Row 3: Instrument type, Financial; Specific mechanism, Loan guarantee; Policy recommendation, Establish long-term state loan guarantees incentivizing private lender participation; Comparative advantages, Lowering risk to lenders would make the loan approval process higher and offer a lower rate for borrower; Implementation considerations, Agencies should clearly define criteria for eligible biochar projects; governments wary of possible risk; References, SEMARNAT-INEC 2016. Row 4: Instrument type, AQ9; Specific mechanism, Operation subsidy; Policy recommendation, Implement a sustained program with close partnerships between states and producers; Comparative advantages, Direct financial support lowers startup costs increasing profitability for biochar manufacturers and lowers end-user costs; Implementation considerations, Payment structures should be well defined and requirements for producers must also be outlined; References, Japan et al. 2021; He et al. 2020. Row 5: Instrument type, Nonfinancial; Specific mechanism, Regulatory streamlining; Policy recommendation, Reclassify waste categories to expand allowable biochar feedstocks and exempt biochar facilities from restrictive incineration regulations; Comparative advantages, Removes immediate legal barriers; increases feedstock availability; faster implementation than financial incentives; Implementation considerations, Requires comprehensive safety testing protocols; potential environmental risks from expanded feedstock use; regulatory complexity across states; References, Japan et al. 2021; Department for Business, Energy and Industrial Strategy 2021. Row 6: Instrument type, Nonfinancial; Specific mechanism, Information campaigns; Policy recommendation, Develop comprehensive outreach program using workshops, forums, and digital platforms to disseminate biochar knowledge; Comparative advantages, Builds stakeholder buy-in; relatively low cost; addresses awareness barriers; supports long-term market development; Implementation considerations, Limited effectiveness without complementary financial incentives; slow results; difficulty measuring impact validation; References, Thengane et al. 2021; Meyer et al. 2021; Rodríguez Franco et al. 2024. Row 7: Instrument type, Nonfinancial; Specific mechanism, Regional coordination; Policy recommendation, Establish Northeast-Canadian biochar cooperation network for standards harmonization and market development; Comparative advantages, Creates larger, more stable markets; reduces regulatory fragmentation; enables knowledge sharing; leverages regional biomass resources; Implementation considerations, Slower implementation than individual state action; requires interstate coordination mechanisms; potential for lowest-common-denominator standards; References, City of Helsinki 2018; Japan et al. 2021; Lara Ibáñez et al. 2022. Row 8: Instrument type, Nonfinancial; Specific mechanism, Policy integration; Policy recommendation, Incorporate sustainability principles as core objectives in strategic planning frameworks; Comparative advantages, Provides stable, long-term policy environment; influences all subsequent policy decisions; supports comprehensive green technology adoption; Implementation considerations, Indirect effects difficult to measure; depends on political continuity; may conflict with short-term economic priorities; References, He et al. 2022; Japan et al. 2021; Department for Business, Energy and Industrial Strategy 2021. Row 9: Instrument type, Research & development; Specific mechanism, Applied research; Policy recommendation, Fund comprehensive studies on biochar chemical properties, crop yield impacts, and soil microbial interactions specific to Northeast US conditions; Comparative advantages, Reduces scientific uncertainty; provides evidence base for regulations and market expansion; builds regional expertise; Implementation considerations, Long development timelines; high upfront costs; uncertain commercial applications; References, He et al. 2022; Copenhagen Infrastructure Partners Cox et al. 2012; Foundation 2024. Row 10: Instrument type, Research & development; Specific mechanism, Demonstration projects; Policy recommendation, Establish multiple large-scale biochar demonstration sites across diverse Northeast agricultural systems; Comparative advantages, Provides real-world evidence; reduces farmer risk aversion; enables experiential learning; builds trust through local validation; Implementation considerations, Requires land access and farmer participation; high visibility if failures occur; location-specific results may not transfer; References, Japan et al. 2021; He et al. 2022; Norwegian Ministry of Climate and Environment 2021.
Financial instruments that directly address economic barriers through market-based mechanisms include carbon credits and R&D tax credits. Current voluntary market premiums reflect strong corporate demand for high-permanence carbon removal (Amonette et al. Reference Amonette, Archuleta, Fuchs, Hills, Yorgey, Flora, Hunt, Han, Jobson, Miles, Page-Dumroese, Thompson, Trippe, Wilson, Baltar, Carloni, Christoforou, Collins, Dooley, Drinkard, Garcia-Pérez, Glass, Hoffman-Krull, Kauffman, Laird, Lei, Miedema, O’Donnell, Kiser, Pecha, Rodriguez-Franco, Scheve, Sprenger, Springsteen and Wheeler2021; Puro.earth 2025). In voluntary markets, high-quality biochar removal credits (e.g., Puro.earth CORC) have traded at $105–$150/tCO2-equivalent in the Northeast United States, indicating $210–$300/Mg of potential productivity enhancing measure and cost reduction for producers. These programs can deliver flexible, market-based revenue to landowners and operators, but they also entail MRV (measurement, reporting, and verification) costs to document permanence and quality and expose projects to price and offtake risk. In parallel, emerging U.S. policy proposals (e.g., S.1842) would provide a $12/tCO2-equivalent production tax credit for qualifying carbon removal technologies, adding a more durable, policy-backed revenue stream that complements voluntary credits (U.S. Congress 2025).
Operational (plant-gate) production subsidies for biochar production remain largely absent in the U.S or abroad, current public support is concentrated on demand-side, per-unit application payments (USDA NRCS Soil Carbon Amendment, Code 336) and a related Conservation Stewardship Program (CSP) enhancement called Biochar Production from Woody Residue (E384A), which demonstrate administrability of per-unit incentives but pay landowners/applicators rather than producers.
R&D tax credits provide some efficiency advantages over traditional grant mechanisms by leveraging private sector innovation capacity and encouraging sustained investment. One caveat is that the tax credit benefits are often concentrated among established firms rather than emerging market entrants. At the US federal level, biochar facilities may qualify for the Section 48C Advanced Energy Project Credit, which provides up to 30% ITCs for clean energy manufacturing projects (Internal Revenue Code, 26 U.S.C. § 48C 2022). Facilities incorporating cogeneration capabilities may access additional incentives through ITCs for renewable energy systems or qualify for Renewable Energy Certificates (RECs). Projects located in economically distressed communities can further benefit from the New Markets Tax Credit (NMTC), offering a 39% investor credit distributed over seven years (U.S. Department of the Treasury 2000). State-level programs can complement federal incentives through mechanisms such as income tax credits for carbon farming practices, production-based biomass credits like Oregon’s renewable energy program (Pourhashem et al. Reference Pourhashem, Hung, Medlock and Masiello2019), and property tax exemptions like Maine’s Business Equipment Tax Exemption (BETE) program.
Loan guarantees and subsidized financing programs reduce effective capital costs by lowering interest rates, extending repayment terms, and reducing equity requirements. At the federal level, USDA’s Section 9003 loan guarantees and DOE’s Loan Programs Office (Title 17) finance advanced bioproduct facilities or innovative clean energy projects. State instruments (e.g., Maine’s FAME) can complement these with loan insurance in pilot biochar producers (e.g., Standard Biocarbon).
Nonfinancial instruments that target regulatory fragmentation and coordination failures through structural interventions include regulatory streamlining, information campaigns, regional coordination, and policy integration. For example, waste reclassification and facility exemptions can eliminate immediate market barriers more rapidly than fiscal measures while expanding available feedstock resources, contingent on developing appropriate safety protocols. Regional coordination mechanisms can address the interstate fragmentation that has historically constrained US biochar markets, offering economies of scale and reduced transaction costs despite implementation challenges inherent in multi-jurisdictional cooperation. Information-based interventions provide cost-effective awareness building but exhibit limited effectiveness as standalone policies. Policies that can be combined or integrated across multiple agencies and mechanisms are likely to generate more efficient outcomes through increased access and flexibility.
R&D instruments such as applied research and biochar demonstration projects can address information asymmetries and uncertainty that constrain agricultural technology adoption. Region-specific applied research reduces scientific uncertainty while building institutional capacity for market support, though benefits may only accrue over extended time horizons. Demonstration projects can provide locally relevant performance data that directly address farmer risk aversion, contingent on securing adequate participation and representative site selection. However, the projects may be constrained by land accessibility and are sometimes limited by the success (or failures) of individual trials.
Economic case study model
Baseline results for our TEA are reported for three cases: S2 (thermal + heat), S4 (heat + power, no liquids market), and S4 (heat + power + liquids market) (Figure 2). In all three cases, internal heat and power recovery lowers purchased energy requirements through the operating-cost term, and no external heat-sales credit is assumed. The distinction between the two S4 cases is the treatment of liquid co-product revenue rather than internal process-energy recovery.
Biochar production cost ($/Mg) versus biomass processing capacity for S2 (Thermal + Heat), S4 (Heat + Power, no liquids market), and S4 (Heat + Power + liquids market) plant configurations (20-year life, 20% salvage, 8% base cost of capital).
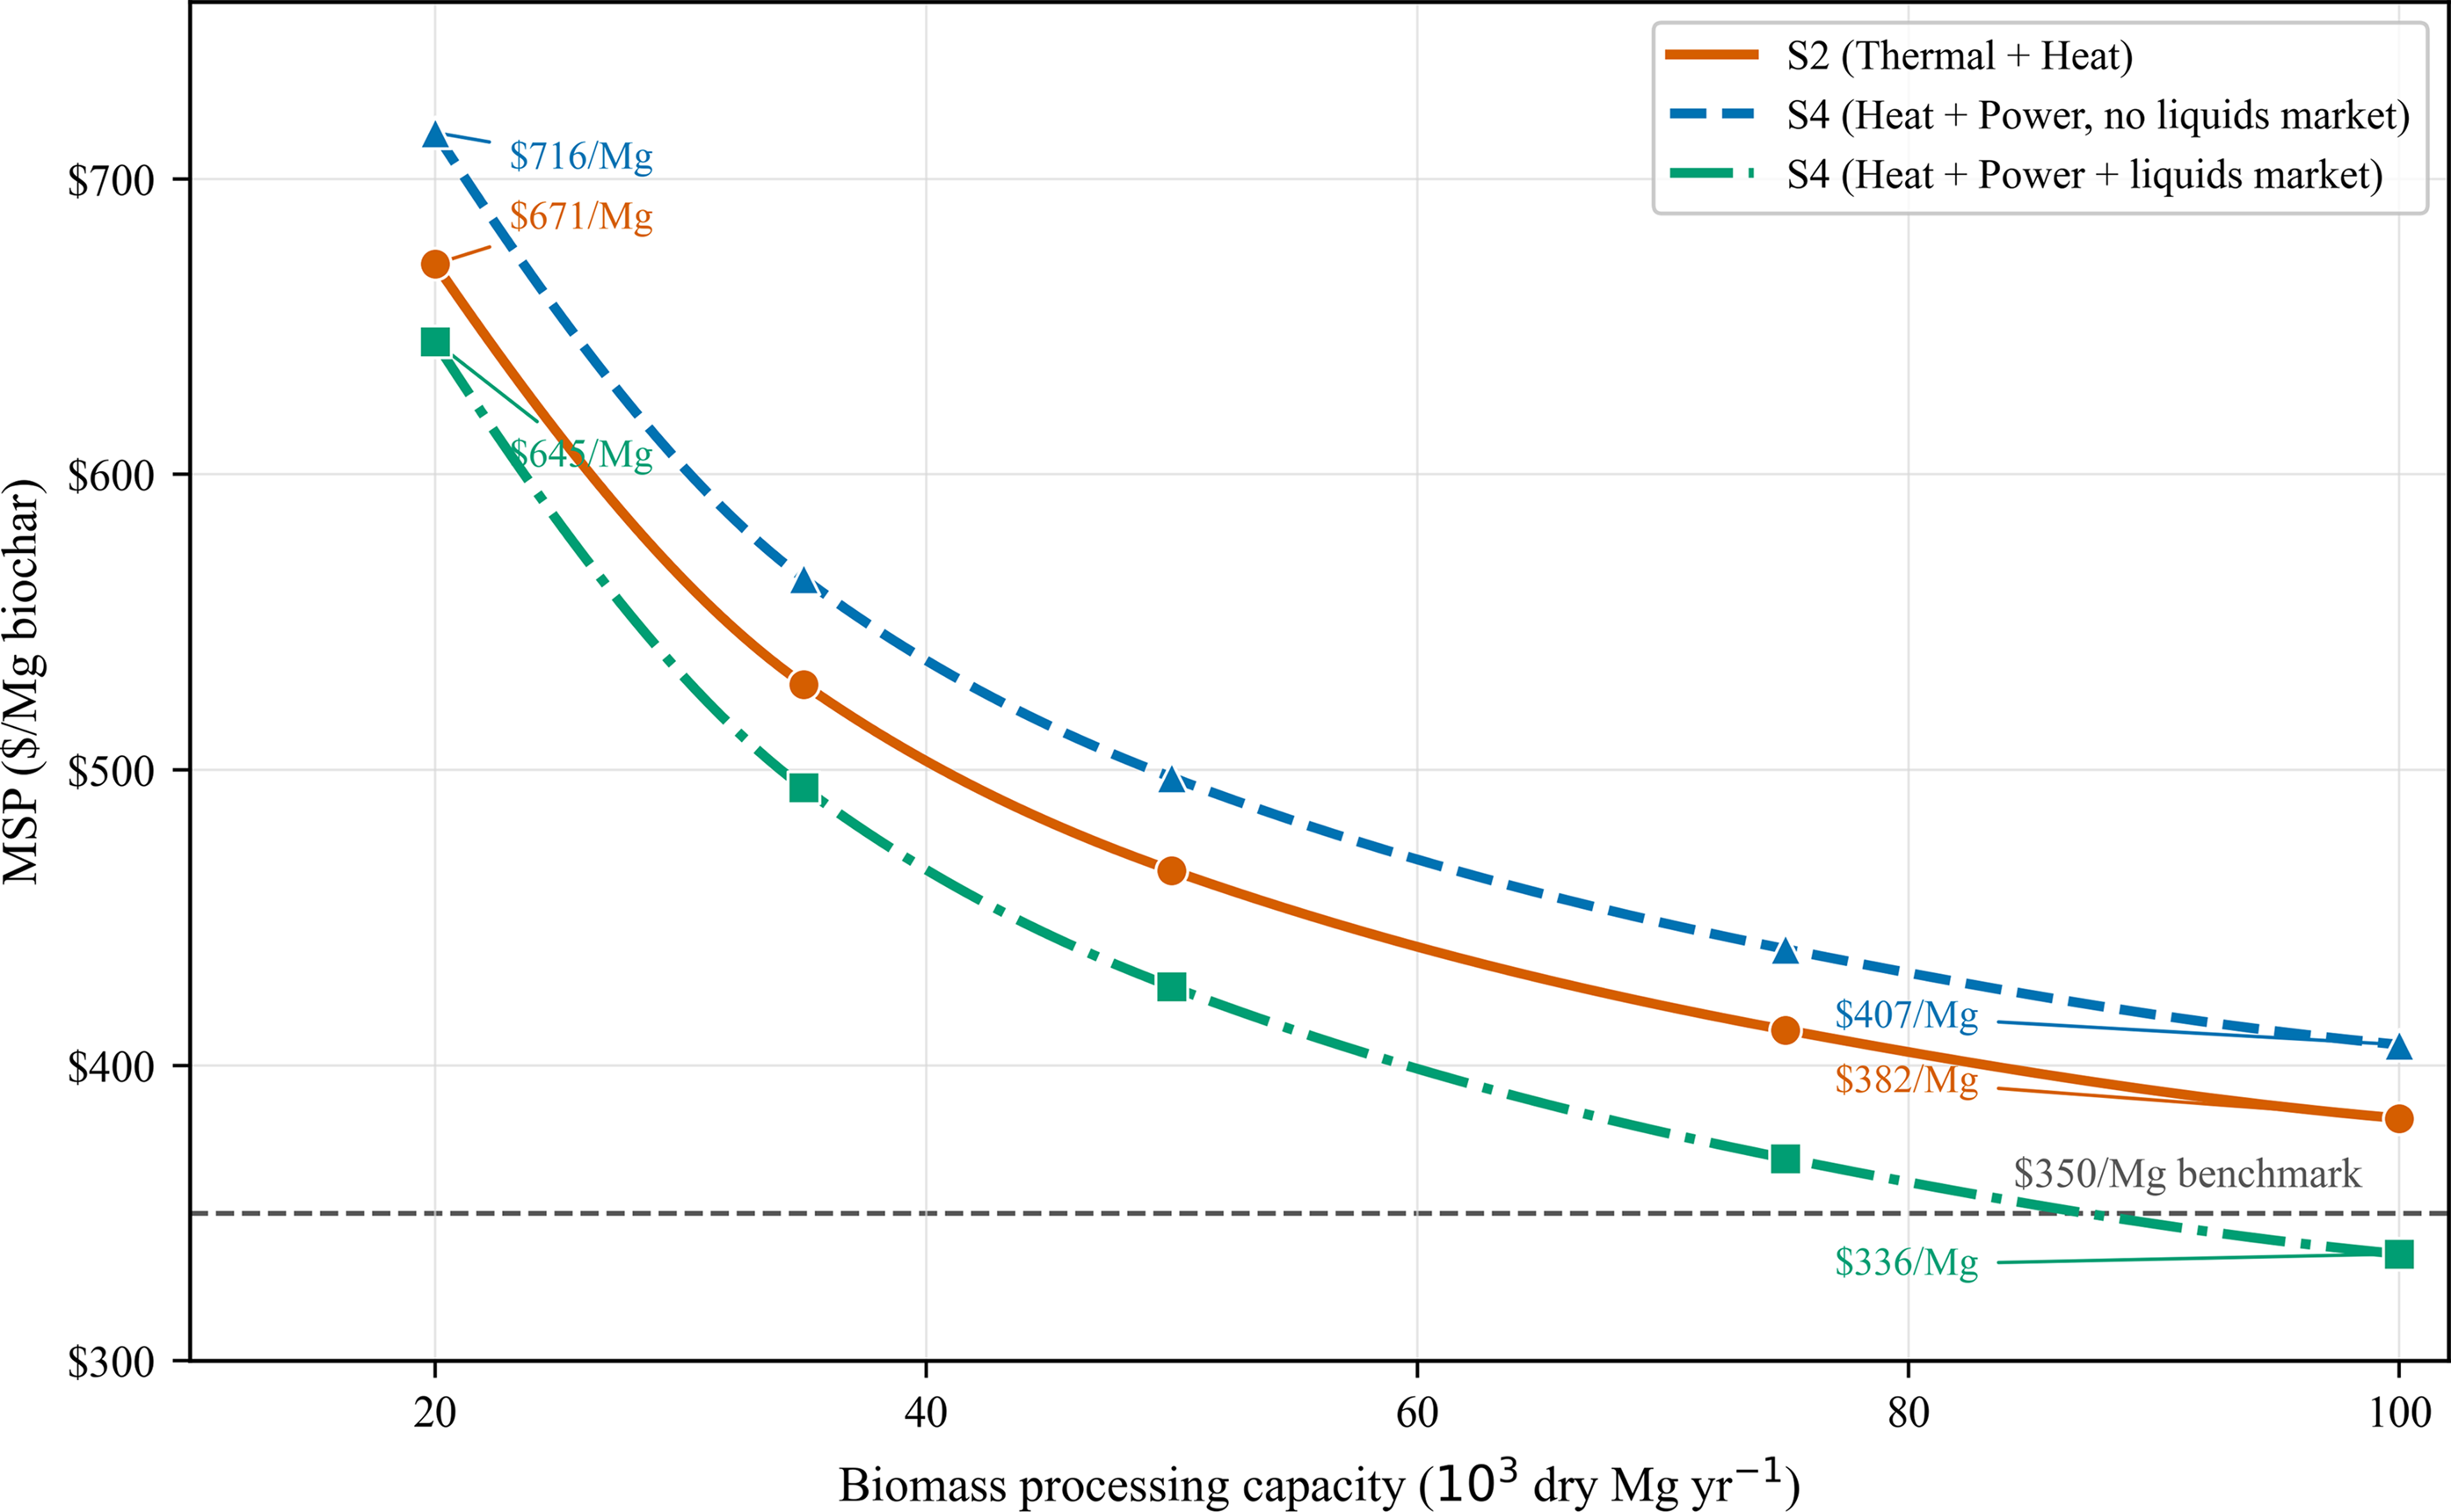
MSP declines monotonically with plant scale in all three cases, consistent with economies of scale. For S2, MSP decreases from $671/Mg at 20,000 dry Mg/yr to $382/Mg at 100,000 dry Mg/yr. However, scale economies alone are insufficient to make the biochar price competitive under the Maine assumptions used here. Only the S4 case with liquid co-product revenue reaches the $350/Mg benchmark within the modeled range, with an MSP of $336/Mg at 100,000 dry Mg/yr. Neither S2 nor S4 without liquid-product revenue reaches that threshold. However, the economic performance of S4 depends critically on the existence of a realizable market for bio-oil and other condensable co-products, and it also points to a continued role for policy support in improving the competitiveness of biochar production where such markets are weak or absent.
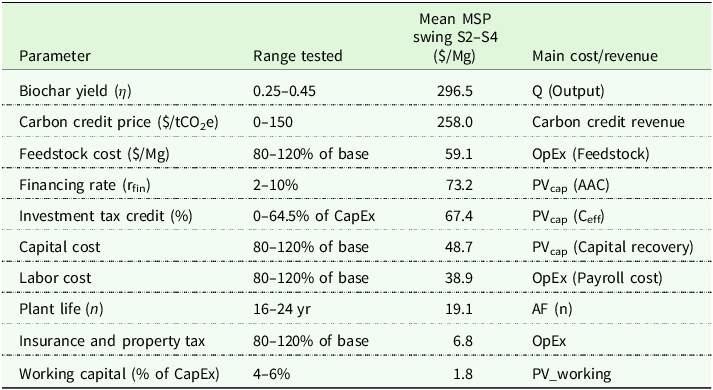
One-at-a-time sensitivity analysis at the 50,000 dry Mg/yr reference scale shows that biochar yield is the dominant technical driver of MSP across all three cases (Figure S1; Table 3). Carbon credit price is the second most influential input, lowering MSP by $258/Mg over the $0–150/tCO2e range in every case. Among the remaining inputs, capital-side parameters matter more in the two S4 cases than in S2, reflecting the larger capital requirement of the heat-and-power configuration: changes in the financing rate, ITC, and capital cost all produce larger MSP responses in S4 than in S2. Feedstock cost is the largest operating-cost driver aside from yield, while labor has a smaller but still meaningful effect. By contrast, plant life, insurance and property tax, and working capital contribute relatively little to overall MSP variation.
Sensitivity ranges for scenarios at 50,000 dry Mg/yr biomass throughput. The table reports the tested range and mean MSP (P*) interval for S2, S4
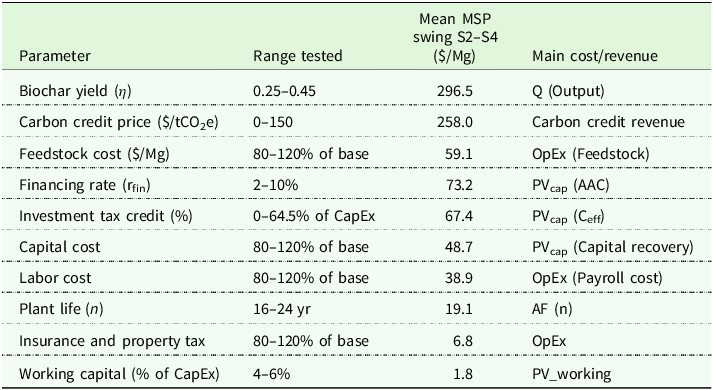
Table 3. Long description
The table has 11 rows and 3 columns. The columns are labeled Parameter, Range tested, Mean MSP swing S2-S4 ($/Mg), and Main cost/revenue. The rows list different parameters and their respective ranges tested and mean MSP swing values. Row 1: Biochar yield (η), 0.25-0.45, 296.5, Q (Output). Row 2: Carbon credit price ($/tCO2e), 0-150, 258.0, Carbon credit revenue. Row 3: Feedstock cost ($/Mg), 80-120 percent of base, 59.1, OpEx (Feedstock). Row 4: Financing rate (rfin), 2-10 percent, 73.2, PVcap (AAC). Row 5: Investment tax credit (percent), 0-64.5 percent of CapEx, 67.4, PVcap (Ccf). Row 6: Capital cost, 80-120 percent of base, 48.7, PVcap (Capital recovery). Row 7: Labor cost, 80-120 percent of base, 38.9, OpEx (Payroll cost). Row 8: Plant life (n), 16-24 years, 19.1, AF (n). Row 9: Insurance and property tax, 80-120 percent of base, 6.8, OpEx. Row 10: Working capital (percent of CapEx), 4-6 percent, 1.8, PVworking.
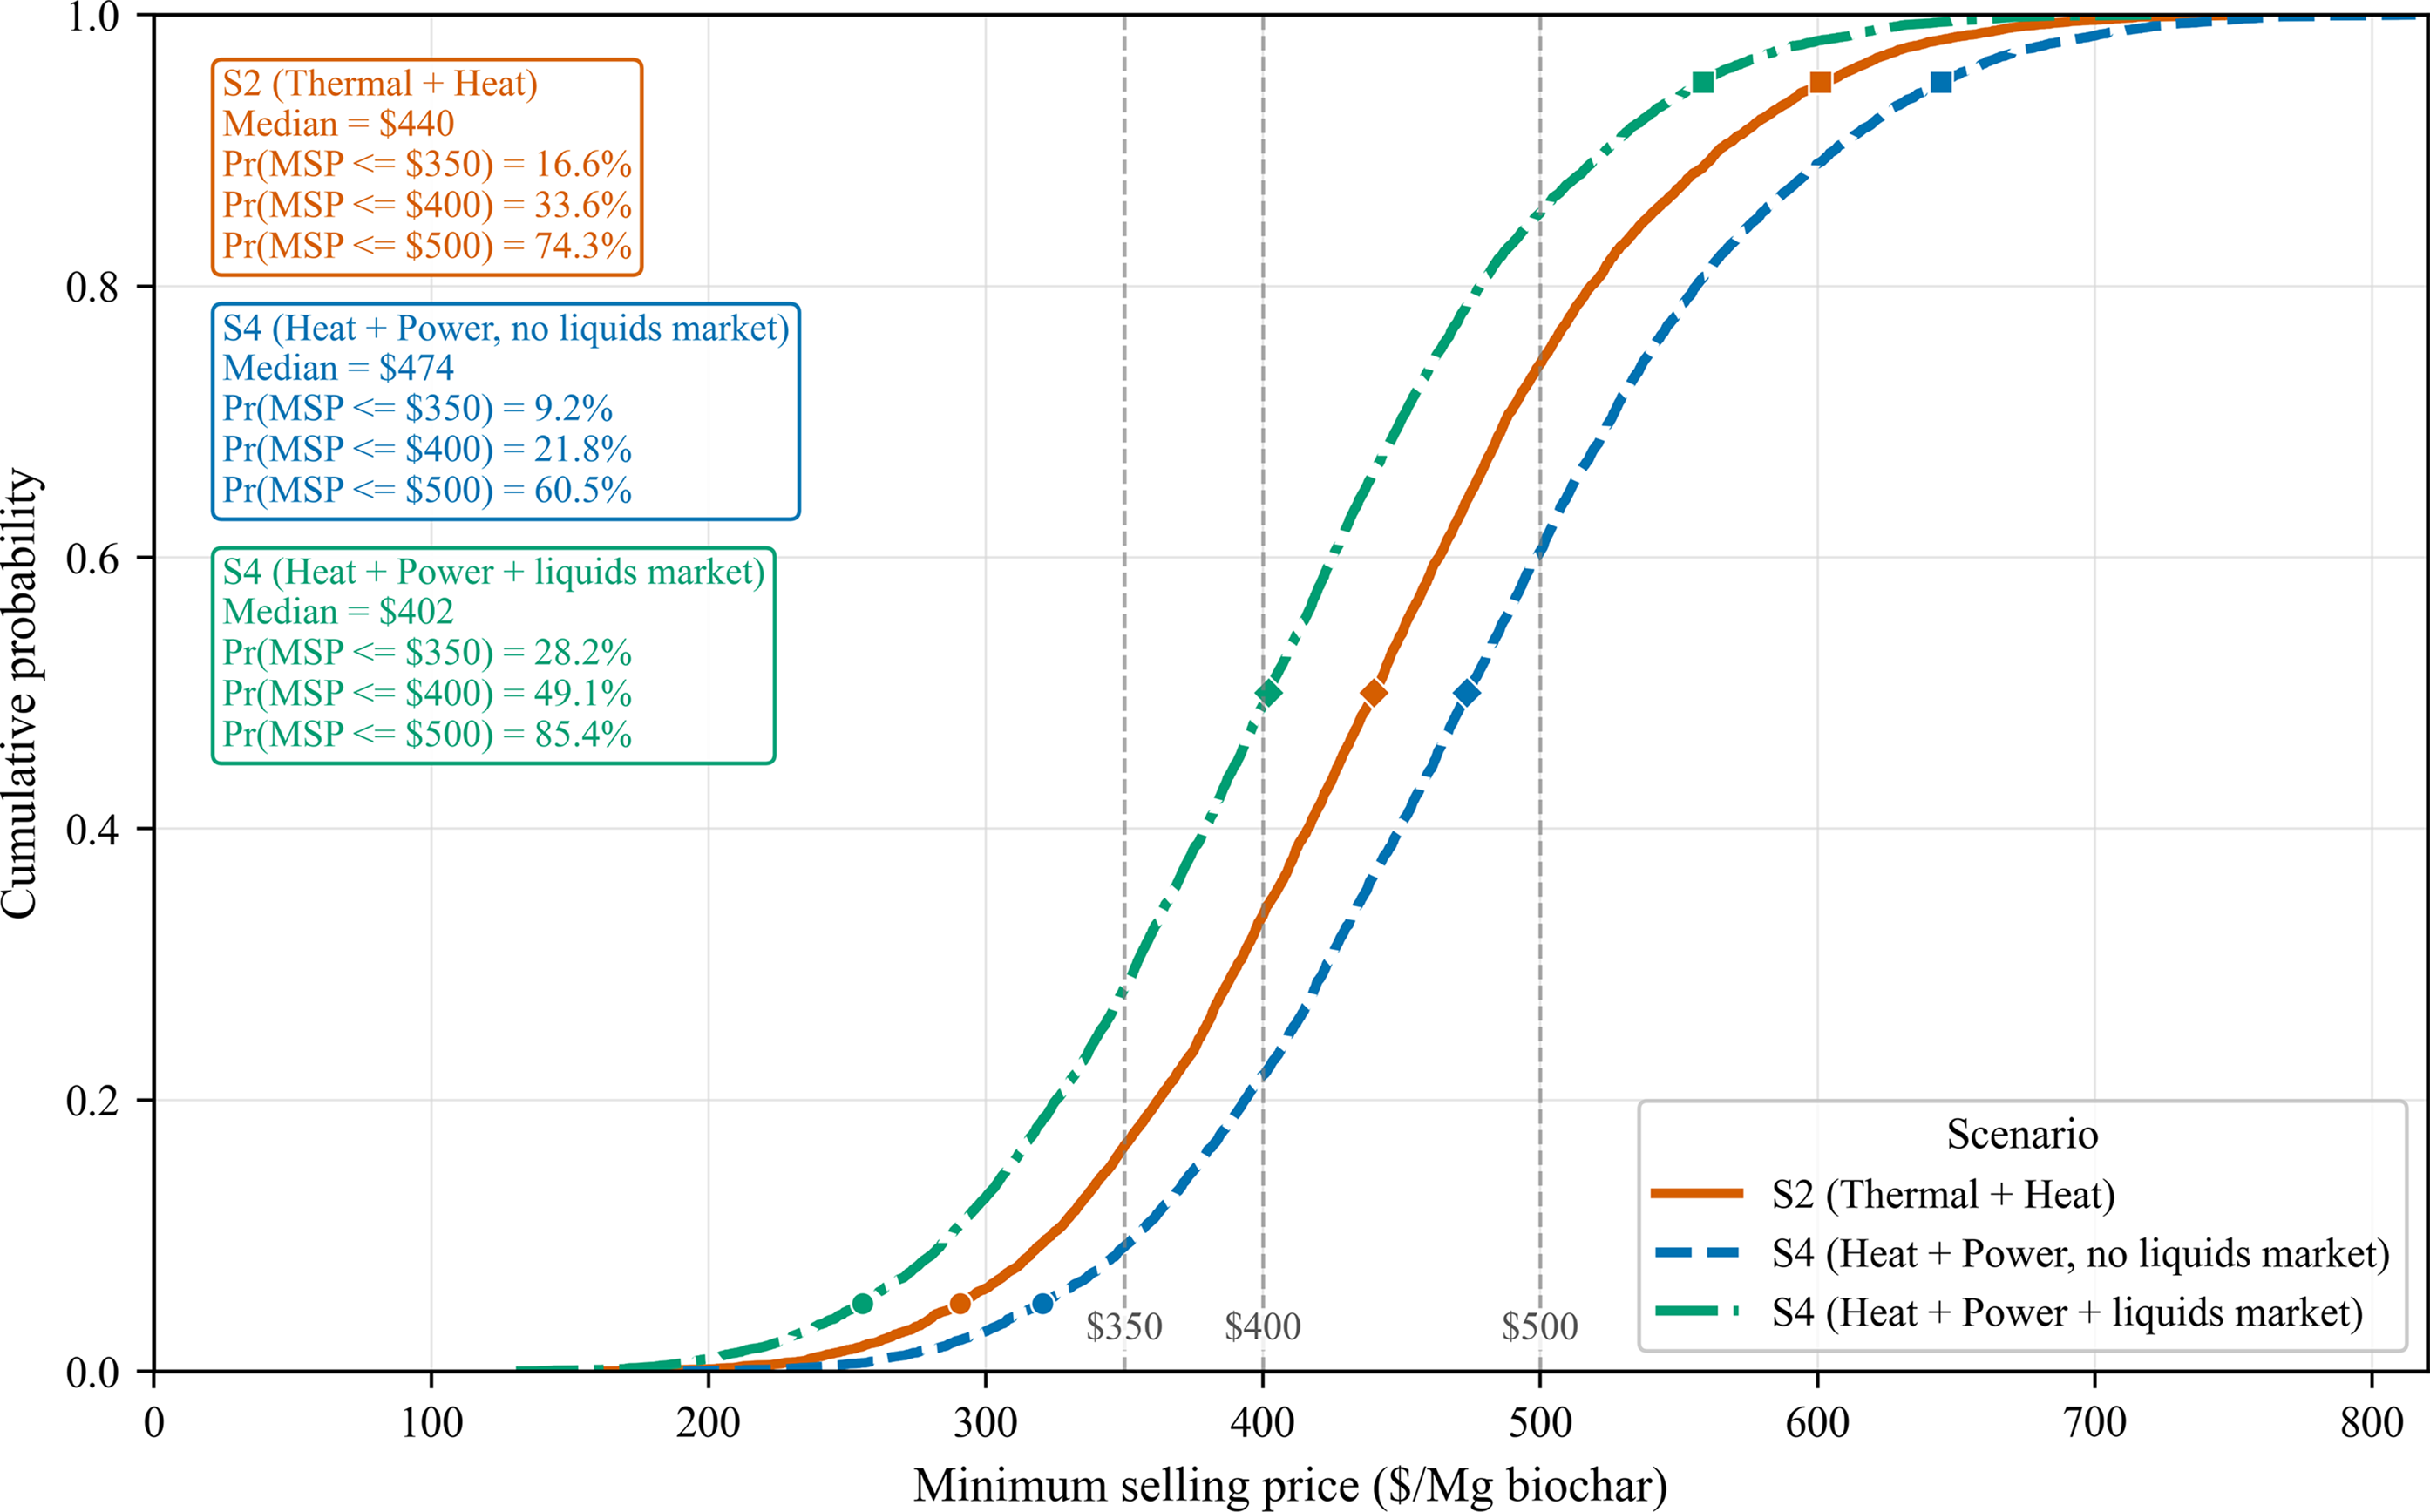
The Monte Carlo simulation resulted in the same ranking as the deterministic case (Figure 3 and Figure S2). The S4 case with liquids-market revenue has the lowest expected MSP, followed by S2 and S4 without liquids-market revenue. It also has the highest probability of reaching benchmark price thresholds. The probability that MSP is at or below $350/Mg is 28.2% for S4 with liquids-market revenue, compared with 16.6% for S2 and 9.2% for S4 without liquids-market revenue. At a $400/Mg threshold, the corresponding MSP probabilities are 49.1%, 33.6%, and 21.8%. At the same time, the distributions overlap substantially, and even under the favorable liquids-market specification, upper-tail outcomes remain well above the $350/Mg benchmark. Because the Monte Carlo design uses independent Latin hypercube draws, the reported distributions reflect simultaneous uncertainty in multiple parameters but do not account for covariance among stochastic inputs. Rank-correlation results further show that biochar yield and carbon credit price are the dominant drivers of MSP uncertainty in all three cases, followed by feedstock cost, while financing rate and capital cost are more influential in the S4 configurations than in S2. The Spearman rank correlations therefore indicate which independently sampled inputs are most associated with MSP outcomes, rather than correlations among the inputs themselves. Together, these results indicate that scale and co-product revenue of biochar manufacturing improves the expected competitiveness but does not fully eliminate investment risk. This suggests that policy support is likely to have the greatest leverage when applied to configurations already closer to market competitiveness. Carbon credits, production subsidies, ITCs, and lower financing costs are more likely to shift a substantial share of outcomes below commercially relevant MSP thresholds in the S4 liquids-market case than in the structurally higher-cost S4 no-market case.
Empirical cumulative distribution of MSP from 10,000 Latin hypercube Monte Carlo draws for S2 (Thermal + Heat), S4 (Heat + Power, no liquids market), and S4 (Heat + Power + liquids market).
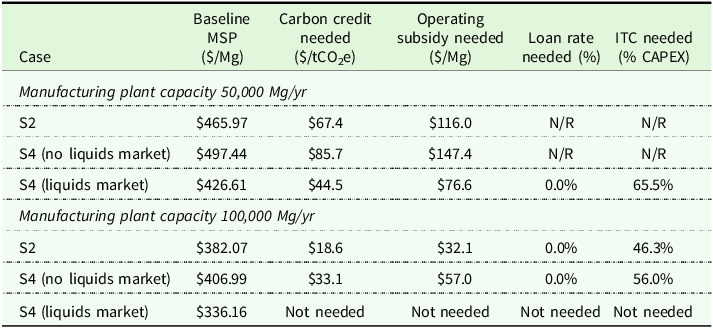
Financial policy instruments were evaluated using two metrics: the support required to reduce MSP to a benchmark value of $350/Mg and the marginal reduction in MSP per standardized unit of support. The threshold analysis indicates that S4 (Heat + Power + liquids market) is the closest to competitiveness under the baseline assumptions (Table 4). Medium- and large-scale plants (50,000/100,000 dry Mg/yr) can reach the benchmark with carbon credits in the range of roughly $19–$86/tCO2e, whereas small-scale plants (20,000 dry Mg/yr) require credits closer to $200/tCO2e.
Policy support required to reach $350/Mg at 50,000 and 100,000 dry Mg/yr
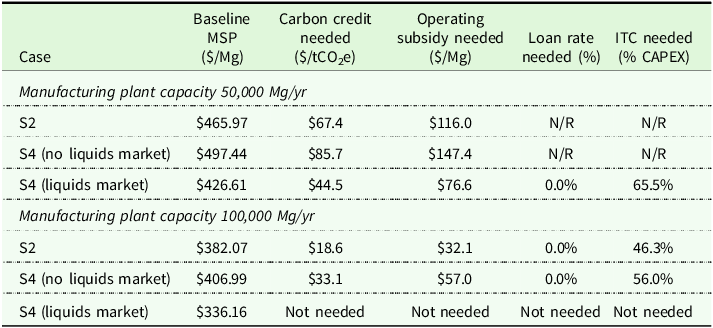
Table 4. Long description
A table comparing financial policy instruments for manufacturing plants of different capacities. The table has 8 rows and 6 columns. The columns are labeled Case, Baseline MSP ($/Mg), Carbon credit needed ($/tCO2e), Operating subsidy needed ($/Mg), Loan rate needed (%), and ITC needed (% CAPEX). The rows are grouped by manufacturing plant capacity: 50,000 Mg/yr and 100,000 Mg/yr. For the 50,000 Mg/yr capacity, the cases are S2, S4 (no liquids market), and S4 (liquids market). For the 100,000 Mg/yr capacity, the cases are S2, S4 (no liquids market), and S4 (liquids market). Each row provides specific values for the financial policy instruments needed for each case. Notable trends include the varying requirements for carbon credits, operating subsidies, loan rates, and ITC needed based on the plant capacity and market conditions.
N/R indicates that the $350/Mg target is not reachable within the tested range for a single instrument alone (0–100% ITC or financing rates from 8% to approximately 0%).
The medium-scale plant S4 with a liquids market can also reach the benchmark with an operating subsidy of $76.6/Mg, an ITC of about 65.5%, or financing that approaches zero cost (Table 3). At large scale, this same configuration is already below the benchmark without additional policy support. By contrast, S2 and S4 without a liquids market require substantially greater support at the 50,000 dry Mg/yr scale, and neither reaches the benchmark through an ITC or financing-rate reduction alone within the tested single-instrument range. Even at 100,000 dry Mg/yr, these manufacturing types remains above the benchmark unless borrowing costs approach 0% interest rates.
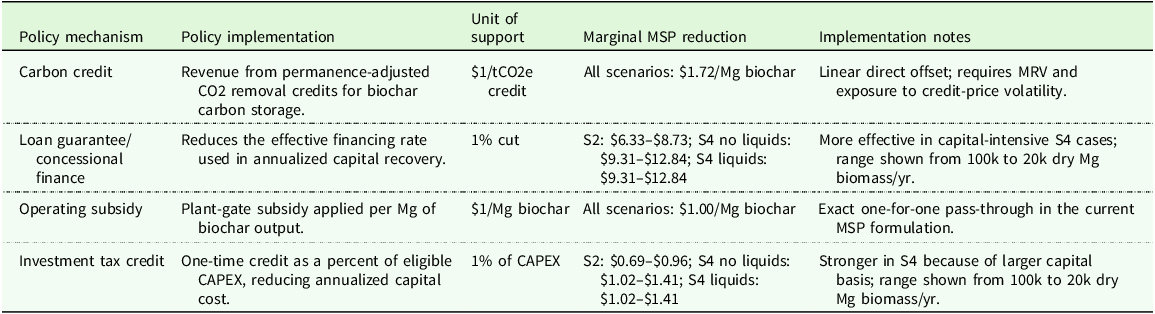
Policy effectiveness varies by instrument type, facility scale, and process configuration (Table 5). Marginal-effect results show that carbon credits and operating subsidies act as direct per-unit offsets and therefore shift all three scenarios in parallel. When the permanence sequestration factor is 1.72 tCO2e per Mg of biochar, each additional $1/tCO2e in credit value lowers MSP by $1.72/Mg.
Impacts of specific financial policy instruments on biochar MSP. Mg = metric tonne
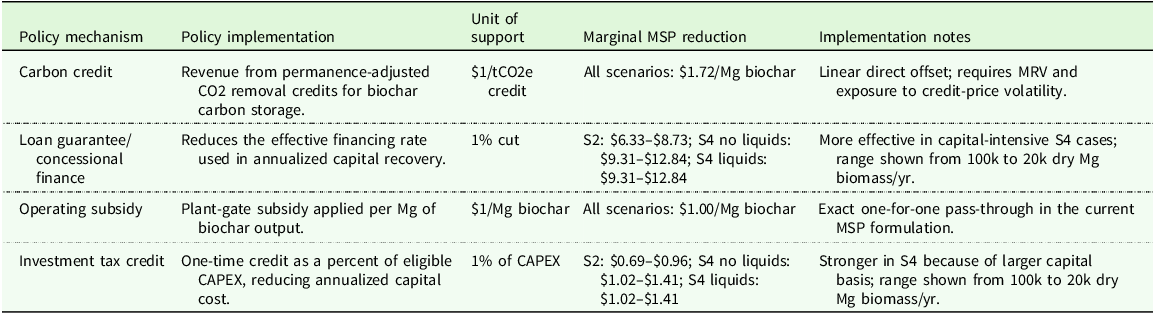
Table 5. Long description
A table comparing the impacts of financial policy instruments on biochar MSP. The table has four columns: Policy mechanism, Policy implementation, Unit of support, Marginal MSP reduction, and Implementation notes. It has five rows of data. Row 1: Carbon credit, Revenue from permanence-adjusted CO2 removal-adjusted CO2 removal credits for biochar carbon storage, $1/tCO2e credit, All scenarios: $1.72/Mg biochar, Linear direct offset; requires MRV and exposure to credit-price volatility. Row 2: Loan guarantee/concessional finance, Reduces the effective financing rate used in annualized capital recovery, 1 percent cut, S2: $6.33-$8.73; S4 no liquids: $9.31-$12.84; S4 liquids: $9.31-$12.84, More effective in capital-intensive S4 cases; range shown from 100k to 20k dry Mg biomass/yr. Row 3: Operating subsidy, Plant-gate subsidy applied per Mg of biochar output, $1/Mg biochar, All scenarios: $1.00/Mg biochar, Exact one-for-one pass-through in the current MSP formulation. Row 4: Investment tax credit, One-time credit as a percent of eligible CAPEX, reducing annualized capital cost, 1 percent of CAPEX, S2: $0.69-$0.96; S4 no liquids: $1.02-$1.41; S4 liquids: $1.02-$1.41, Stronger in S4 because of larger capital basis; range shown from 100k to 20k dry Mg biomass/yr.
While operational subsidies for biochar production remain largely absent in the Northeastern U.S., they represent a plausible policy lever based on precedents in related sectors. Our economic model incorporates operational subsidies as direct cost offsets biochar produced. The magnitude of production credits and agricultural program payments were found to be less than $30/unit in the policy literature (Pourhashem et al. Reference Pourhashem, Hung, Medlock and Masiello2019) (as presented in Section Results). Applied at the point of production, the subsidy passes through linearly to reduce the unit cost without changing technical design assumptions, providing a clear counterfactual for policy evaluation. The implementation of this subsidy can mirror existing agricultural conservation programs that provide per-acre or per-practice payments for environmental benefits, which offer simple administration and predictable cash-flow benefits (Pourhashem et al. Reference Pourhashem, Hung, Medlock and Masiello2019). However, fiscal durability and the risk of efficiency or market distortions warrant safeguards (clear eligibility rules, caps or phase-downs, anti-double counting provisions) and periodic review so the instrument functions as transitional support rather than a permanent price subsidy (Jokubė et al. Reference Jokubė, Hyyrynen, Pihlainen and Hyytiäinen2025; Kurkalova et al. Reference Kurkalova, Kling and Zhao2004).
ITCs and capital cost-sharing programs are policy tools for reducing the biochar production costs by offsetting upfront capital expenditures (Section Results). Capital-side instruments exhibit stronger configuration and scale dependence. A 1% reduction in the financing rate lowers MSP by $6.33–$8.73/Mg for S2 across the 100,000–20,000 dry Mg/yr range, compared with $9.31–$12.84/Mg for both S4 variants. A 1% ITC lowers MSP by $0.69–$0.96/Mg for S2 and by $1.02–$1.41/Mg for the two S4 cases over the same scale range. At 50,000 dry Mg/yr, the marginal effects are $7.27/Mg for a 1 % financing-rate reduction and $0.80/Mg for a 1% ITC in S2, compared with $10.69/Mg and $1.17/Mg, respectively, in the S4 cases. These results indicate that loan guarantees and concessional finance provide the strongest capital-side tool, particularly when paired with the more capital-intensive heat-and-power configurations.
Discussion
This paper reviews global biochar policy and integrates findings into an economic modeling framework to quantify potential opportunities for Northeast US biochar development. The review reveals that successful biochar markets emerge through coordinated policy frameworks that help address three key barriers: financial cost constraints, regulatory fragmentation, and scientific and market uncertainty. We find that the Northeast US possesses several comparative advantages for biochar development, including an established transportation infrastructure, active state and regional climate policies, and existing pyrolysis technology. However, the region also faces institutional fragmentation that has limited US biochar (and other emerging bioeconomy) markets relative to more coordinated approaches found internationally, particularly in the EU.
The TEA results indicate that the commercial viability of biochar in Maine is determined by the interaction among plant scale, process configuration, and policy support rather than any single design choice. Although economies of scale are substantial, scale alone is not sufficient to achieve competitiveness. Mechanically, the decline in MSP with facility scale is an average-cost effect rather than an assumption that biomass becomes cheaper as quantity increases. MSP is calculated as the net annualized cost of the facility divided by annual biochar output. As design capacity increases, biochar output rises approximately proportionally with biomass throughput, while several major cost categories increase less than proportionally. Installed capital is scaled using a capacity exponent below one, and labor, energy use, and other fixed operating costs are also spread over a larger volume of output. Larger facilities therefore have lower annualized capital charges, labor costs, insurance, property taxes, and fixed operating costs per tonne of biochar. Feedstock cost, by contrast, remains largely proportional to biomass input in the baseline TEA and therefore is not the primary source of the modeled scale economy. The results also show that policy effectiveness depends on how it interacts with market conditions. In particular, the relative ranking of S2 and S4 changes once liquid co-product revenue is included, indicating that the economics of the more capital-intensive S4 configuration depends critically on the existence of viable markets for condensable products. This suggests that market-building measures, such as product standards, offtake arrangements, and supply-chain coordination, may be as important as direct financial incentives. Policies that jointly support carbon removal and co-product commercialization are therefore likely to be more cost-effective than capital subsidies alone.
Scale further influences the role of policy. We found that small capacity biochar plants are not competitive and would require disproportionately large support, raising concerns about cost-effectiveness in bulk-market applications. Medium-scale plants are more responsive to policy but still depend on either substantial support or additional revenue streams. Large-scale systems, particularly S4 with a liquids market, are the strongest candidates for commercialization because they begin closer to the competitiveness benchmark and therefore require smaller policy incentives to become viable. This suggests that, under current cost conditions, deployment strategies are more likely to succeed when support is targeted toward large feedstock facilities rather than applied uniformly across scales. However, this scale result should be interpreted as a facility-level engineering-economic relationship, not as a regional biomass supply curve. The baseline analysis holds delivered feedstock cost constant across facility sizes and therefore does not model the possibility that larger plants may need to procure biomass from more distant or more expensive sources. If regional feedstock supply constraints were modeled endogenously, higher marginal procurement costs could reduce or eventually offset some of the economies of scale reported here.
Our uncertainty analysis further supports these findings. Even in the most favorable case, upper-tail outcomes remain above our breakeven price target of $350/Mg biochar, indicating that policy will most likely need to be adopted to help address risk reduce the expected cost faced by producers (Campbell et al. Reference Campbell, Anderson, Daugaard and Naughton2018). Biochar yield, feedstock cost, and carbon credit value are the primary drivers of uncertainty, so policies that improve operational performance, stabilize feedstock supply, and strengthen carbon credit reliability may complement financial support more effectively than increasing subsidy levels alone. The results point to a coordinated policy approach in which plant scale, feedstock logistics, carbon credit access, and co-product market development are aligned.
Our study primarily focused on policy and economic analysis focused on the market costs of producing biochar. However, biochar generates several benefits that are not fully accounted for in our TEA. Biochar application benefits include carbon sequestration (Schmidt et al. Reference Schmidt, Kammann, Hagemann, Leifeld, Bucheli, Sánchez Monedero and Cayuela2021), soil GHG emissions reductions (Cayuela et al. Reference Cayuela, van Zwieten, Singh, Jeffery, Roig and Sánchez-Monedero2014), crop yield improvements (Jeffery et al. Reference Jeffery, Verheijen, van der Velde and Bastos2011), soil fertility and reduced fertilizer use (Yu et al. Reference Yu, Zou, Chen, Chen, Yu, Huang and Gao2019), nutrient leaching reduction (Aller et al. Reference Aller, Archontoulis, Zhang, Sawadgo, Laird and Moore2018), soil water retention (Razzaghi et al. Reference Razzaghi, Obour and Arthur2020), and avoided landfill tipping and biosolids disposal fees (Gunarathne et al. Reference Gunarathne, Ashiq, Ramanayaka, Wijekoon and Vithanage2019). On net, the collective benefits of biochar could plausibly range from $250–$700/Mg (Campion et al. Reference Campion, Bekchanova, Malina and Kuppens2023). Conducting a benefit–cost analysis that accounts for a wider range of benefit categories could result in a higher proportion of scenarios and assumptions where the private social benefits of utilizing biochar largely exceed the costs.
Based on our findings, we recommend that the Northeast US should implement a multi-instrument policy approach that addresses both immediate economic barriers and long-term market development needs. Our analysis identifies three priority areas for policy intervention. First, establishing carbon credit procurement programs would provide immediate revenue streams for biochar producers while addressing the market failure in valuing carbon sequestration (and GHG emissions reductions from fertilizer savings) benefits. Carbon credit purchasing, as modeled in our economic analysis, could reduce manufacturing costs faced by biochar producers by nearly 30% at the high end of current voluntary market prices. Second, regulatory streamlining through waste reclassification and facility permitting reforms would remove immediate barriers to feedstock access and facility development. The regional policy analysis shows that regulatory clarity has been crucial for biochar market development in Europe and Australia, while regulatory fragmentation has constrained US market development. Northeast states should coordinate on unified biochar definitions and processing standards to create larger, more efficient markets. Third, targeted R&D investments in region-specific research and demonstration projects could address the scientific uncertainty and risk aversion that limit farmer adoption. Our policy review indicates that demonstration projects have been critical for building stakeholder confidence in Japan and Europe, while the lack of locally-relevant data has hindered US adoption with the added fact that historically for decades with federal and state approval PFAS was used in land applications as a means to dispose of waste cheaply economically and environmentally impacting the public and agricultural sectors in the United States (Treat Reference Treat2021). The Northeast’s established agricultural research infrastructure provides a foundation for developing the evidence base necessary for widespread adoption.
Our integrated analysis reveals that policy instrument effectiveness depends on both economic leverage and implementation feasibility. Carbon credits demonstrate the highest theoretical effectiveness but require substantial measurement and verification infrastructure that may challenge current institutional capacity. Loan guarantees provide notable cost reductions, particularly for larger facilities, but depend on creditworthy project sponsors and federal program availability. Direct subsidies offer lower leverage but simpler implementation, while ITCs provide modest benefits primarily for established firms with tax liability. These findings suggest that Northeast US states should prioritize policy combinations that balance effectiveness with implementation capacity. In addition, smaller states might emphasize regulatory coordination and information programs while larger states with greater fiscal capacity could potentially run their own carbon credit and/or R&D investment programs. Regional coordination mechanisms, following models from Australia’s ANZBIG initiative, could enable smaller jurisdictions to participate in larger-scale programs while maintaining policy coherence across state boundaries.
We note that our study has several methodological limitations that affect the generalizability of findings. First, the literature review focused on English-language sources, potentially underrepresenting policy innovations in non-English speaking countries, particularly in developing economies where biochar adoption may face different constraints. The rapid evolution of biochar and carbon markets means some policy examples may reflect early-stage programs whose long-term effectiveness remains unproven. Second, our economic model uses broad cost assumptions that are typical for the current Northeast US market and thus may not reflect the full variation across the region’s diverse agricultural and industrial contexts. Feedstock availability, transportation costs, and market conditions can vary across Northeast states and beyond, potentially affecting the applicability of analysis at a more granular scale. The model also assumes current technology and market conditions, while ongoing innovations in pyrolysis technology and carbon market development could alter the relative attractiveness of different policy instruments. Relatedly, the TEA should also be interpreted as a comparative-static analysis under ceteris paribus assumptions. Although selected parameters are varied through sensitivity and Monte Carlo analysis, the model does not endogenously represent broader market feedbacks or simultaneous changes in electricity prices, fertilizer prices, agricultural demand for biochar, carbon credit market depth, or regional biomass competition. These factors could materially affect the relative competitiveness of the modeled configurations. For example, higher electricity prices would likely improve the economics of S4 facilities with power recovery, while higher fertilizer prices or stronger soil-health markets could increase willingness to pay for biochar. Conversely, tighter biomass markets or increased competition for residues could raise feedstock costs and weaken the scale economies estimated here. Further, the analysis does not account for the dynamic relationship between supply and biochar prices. Therefore, the results should be interpreted as conditional on the modeled baseline market environment rather than as forecasts under all future market conditions. Next, our policy recommendations assume a rational policy-making process and sufficient institutional capacity to implement, which may not reflect the political realities across our entire study area. Finally, stakeholder acceptance, particularly among agricultural communities historically skeptical of environmental regulations and new technologies, represents a critical implementation challenge not fully captured in our analysis.
Several research priorities emerge from this analysis. First, stakeholder acceptance studies should investigate the social and cultural factors affecting biochar adoption in Northeast US agricultural communities. Understanding farmer decision-making processes, risk perceptions, and information sources would inform more effective outreach and incentive design. Second, more comparative case studies of biochar policy implementation could examine both successful and unsuccessful programs to identify critical success factors and implementation pitfalls. Such studies should pay particular attention to multi-jurisdictional coordination mechanisms and stakeholder engagement strategies. Third, more advanced economic modeling could incorporate technology learning curves, market evolution, and policy feedback effects to better understand long-term policy effectiveness of alternative policy pathways. Our current static analysis may underestimate the benefits of R&D investments and overestimate the importance of immediate cost reductions. Finally, a more detailed integrated assessment of biochar’s role within the broader agricultural and climate policy frameworks would help identify synergies and conflicts with existing programs. We recognize that biochar policy would likely be developed in complex policy environments where interactions with conservation programs, renewable energy incentives, and agricultural subsidies may affect overall effectiveness.
Conclusion
This study provides empirical evidence that strategic policy intervention can enable economically viable biochar production in the Northeast US through coordinated approaches addressing market failures, regulatory barriers, and information asymmetries. The analysis demonstrates that carbon credits offer the highest cost-effectiveness for reducing biochar production costs, while regional coordination and R&D investments can help build key market linkages. Because the total benefits of biochar in the Northeast US could plausibly range from about $250–$700/Mg biochar, the policy transfers required to reach the $350/Mg competitiveness benchmark are likely to generate positive net social benefits under central parameter assumptions.
Developing a successful biochar market requires multi-instrument policy approaches that combine immediate economic incentives with long-term capacity building. The Northeast US possesses comparative advantages in infrastructure, research capacity, and policy coordination mechanisms that position the region favorably for biochar market development. However, realizing this potential requires coordinated policy action that addresses the institutional fragmentation and economic barriers that have limited US biochar adoption relative to international markets.
The policy framework developed through this analysis offers Northeast US policy makers’ evidence-based guidance for designing effective biochar support programs. Implementation success will depend on adapting these recommendations to local political, economic, and agricultural contexts while maintaining regional coordination to achieve sufficient market scale. Strategic policy implementation can enable biochar to contribute meaningfully to regional agricultural productivity, environmental sustainability, and economic development objectives.
Supplementary material
The supplementary material for this article can be found at https://doi.org/10.1017/age.2026.10042.
Data availability statement
The data that support the findings of this study are available from the corresponding author, AD, upon reasonable request.
Acknowledgements
The authors would like to acknowledge the United States Department of Agriculture – Agricultural Research Service for funding this project.
Funding statement
This project was funded by the United States Department of Agriculture – Agricultural Research Service under the Project Grant No. 0500-00090-001-009-S.
Competing interests
The author(s) declare none.






 Open access

