






No CrossRef data available.
Article contents
Vertical pleiotropy explains the heritability of social science traits
Published online by Cambridge University Press: 11 September 2023
Abstract
We contend that social science variables are the product of multiple partly heritable traits. Genetic associations with socioeconomic status (SES) may differ across populations, but this is a consequence of the intermediary traits associated with SES differences also varying. Furthermore, genetic data allow social scientists to make causal statements regarding the aetiology and consequences of SES.
Information
- Type
- Open Peer Commentary
- Information
- Copyright
- Copyright © The Author(s), 2023. Published by Cambridge University Press
Footnotes
*
Both authors contributed equally.
References
Anderson, E. L., Howe, L. D., Wade, K. H., Ben-Shlomo, Y., Hill, W. D., Deary, I. J., … Hemani, G. (2020). Education, intelligence and Alzheimer's disease: Evidence from a multivariable two-sample Mendelian randomization study. International Journal of Epidemiology, 49(4), 1163–1172.CrossRefGoogle ScholarPubMed
Davies, N. M., Hill, W. D., Anderson, E. L., Sanderson, E., Deary, I. J., & Davey Smith, G. (2019). Multivariable two-sample Mendelian randomization estimates of the effects of intelligence and education on health. eLife, 8, e43990. doi: 10.7554/eLife.43990CrossRefGoogle ScholarPubMed
Hill, W. D., Davies, G., Liewald, D. C., McIntosh, A. M., & Deary, I. J. (2016). Age-dependent pleiotropy between general cognitive function and major psychiatric disorders. Biological Psychiatry, 80(4), 266–273. https://doi.org/10.1016/j.biopsych.2015.08.033CrossRefGoogle ScholarPubMed
Hill, W. D., Davies, N. M., Ritchie, S. J., Skene, N. G., Bryois, J., Bell, S., … Deary, I. J. (2019a). Genome-wide analysis identifies molecular systems and 149 genetic loci associated with income. Nature Communications, 10, 5741. doi: 10.1101/573691CrossRefGoogle ScholarPubMed
Hill, W. D., Marioni, R. E., Maghzian, O., Ritchie, S. J., Hagenaars, S. P., McIntosh, A. M., … Deary, I. J. (2019b). A combined analysis of genetically correlated traits identifies 187 loci and a role for neurogenesis and myelination in intelligence. Molecular Psychiatry, 24(2), 169–181. doi: 10.1038/s41380-017-0001-5CrossRefGoogle Scholar
Hill, W. D., Weiss, A., Liewald, D. C., Davies, G., Porteous, D. J., Hayward, C., … Deary, I. J. (2020). Genetic contributions to two special factors of neuroticism are associated with affluence, higher intelligence, better health, and longer life. Molecular Psychiatry, 25(11), 3034–3052. doi: 10.1038/s41380-019-0387-3CrossRefGoogle ScholarPubMed
Howe, L. J., Nivard, M. G., Morris, T. T., Hansen, A. F., Rasheed, H., Cho, Y., … Within Family, C. (2022). Within-sibship genome-wide association analyses decrease bias in estimates of direct genetic effects. Nature Genetics, 54(5), 581–592. doi: 10.1038/s41588-022-01062-7CrossRefGoogle ScholarPubMed
Jencks, C., Smith, M., Henry, A., Jo Bane, M., Cohen, D., Gintis, H., … Michelson, S. (1972). Inequality: A reassessment of the effect of family and schooling in America. Basic Books.Google Scholar
Krapohl, E., Rimfeld, K., Shakeshaft, N. G., Trzaskowski, M., McMillan, A., Pingault, J.-B., … Plomin, R. (2014). The high heritability of educational achievement reflects many genetically influenced traits, not just intelligence. Proceedings of the National Academy of Sciences, 111(42), 15273–15278. doi: 10.1073/pnas.1408777111CrossRefGoogle Scholar
Rimfeld, K., Krapohl, E., Trzaskowski, M., Coleman, J. R. I., Selzam, S., Dale, P. S., … Plomin, R. (2018). Genetic influence on social outcomes during and after the Soviet era in Estonia. Nature Human Behaviour, 2(4), 269–275. doi: 10.1038/s41562-018-0332-5CrossRefGoogle ScholarPubMed
Sanderson, E., Davey Smith, G., Bowden, J., & Munafò, M. R. (2019). Mendelian randomisation analysis of the effect of educational attainment and cognitive ability on smoking behaviour. Nature Communications, 10, 2949. doi: 10.1038/s41467-019-10679-yCrossRefGoogle ScholarPubMed
Tropf, F. C., Lee, S. H., Verweij, R. M., Stulp, G., van der Most, P. J., de Vlaming, R., … Mills, M. C. (2017). Hidden heritability due to heterogeneity across seven populations. Nature Human Behaviour, 1(10), 757–765. doi: 10.1038/s41562-017-0195-1CrossRefGoogle ScholarPubMed
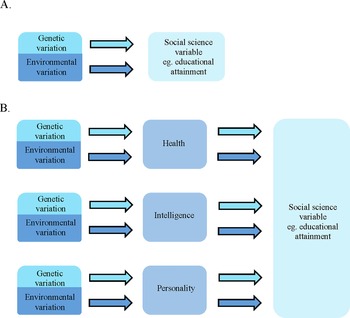
Figure 1. Simplified illustration of vertical pleiotropy showing a subset of the possible intermediary phenotypes between genetic variation and phenotypic differences in social science variables. Illustrated is a schematic describing that when a genome-wide association study (GWAS) is performed on, or a polygenic score (PGS) is derived to predict differences in, education, genetic variation is linked to education (panel A). However, the means by which an association occurs is that, in part, a number of partly heritable traits are themselves associated with education as part of a phenotype pathway starting with genetic inheritance and ending with phenotypic consequences for education (panel B). Light blue boxes indicate sources of genetic variation whereas light blue arrows show the association between genetic and trait variation measured using GWAS or PGS. Dark blue boxes show sources of environmental variation with dark blue arrows indicating environmental associations with a trait. Pale blue boxes indicate education as an example of a social science variable. The blue/grey boxes in panel B show possible intermediary heritable phenotypes.
Target article
Related commentaries (24)
Beware of the phony horserace between genes and environments
Burt uses a fallacious motte-and-bailey argument to dispute the value of genetics for social science
Don't miss the chance to reap the fruits of recent advances in behavioral genetics
Increasing the use of functional and multimodal genetic data in social science research
Burt describes the signal captured by a polygenic score (PGS) derived from a genome-wide association study (GWAS) on social science traits such as education as being “artificial” and a product of social differences rather than genetic processes. As an example of downward causation, Burt provides the thought experiment posed by Jencks et al. (Reference Jencks, Smith, Henry, Jo Bane, Cohen, Gintis and Michelson1972) where, in a hypothetical scenario, red-headed individuals are denied access to an education.
We argue that, just as a PGS captures the aggregate effect of each individual single-nucleotide polymorphism (SNP) used in its construction, each SNP from a GWAS conducted on education captures the aggregate effect of each heritable trait associated with differences in education. This process, referred to as vertical pleiotropy (also known a mediator variable) describes incidences where phenotype A (e.g., intelligence) is associated with phenotype B (education) and so a genetic variant found to be associated with phenotype A will also be associated with phenotype B (Fig. 1).
Simplified illustration of vertical pleiotropy showing a subset of the possible intermediary phenotypes between genetic variation and phenotypic differences in social science variables. Illustrated is a schematic describing that when a genome-wide association study (GWAS) is performed on, or a polygenic score (PGS) is derived to predict differences in, education, genetic variation is linked to education (panel A). However, the means by which an association occurs is that, in part, a number of partly heritable traits are themselves associated with education as part of a phenotype pathway starting with genetic inheritance and ending with phenotypic consequences for education (panel B). Light blue boxes indicate sources of genetic variation whereas light blue arrows show the association between genetic and trait variation measured using GWAS or PGS. Dark blue boxes show sources of environmental variation with dark blue arrows indicating environmental associations with a trait. Pale blue boxes indicate education as an example of a social science variable. The blue/grey boxes in panel B show possible intermediary heritable phenotypes.
In Burt's hypothetical example, red hair would emerge as an intermediary phenotype between genetic inheritance and phenotypic consequence but in real data, childhood intelligence (rg = 0.72, SE = 0.09) (Hill, Davies, Liewald, McIntosh, & Deary, Reference Hill, Davies, Liewald, McIntosh and Deary2016), health (rg = 0.56, SE = 0.03) (Hill et al., Reference Hill, Marioni, Maghzian, Ritchie, Hagenaars, McIntosh and Deary2019b), attention-deficit/hyperactivity disorder (ADHD) (rg = −0.54, SE = 0.03) (Hill et al., Reference Hill, Marioni, Maghzian, Ritchie, Hagenaars, McIntosh and Deary2019b), and neuroticism (rg = −0.23, SE = 0.02) (Hill et al., Reference Hill, Weiss, Liewald, Davies, Porteous, Hayward and Deary2020) show consistent and substantial genetic correlations with education and give an indication as to what heritable traits may contribute towards educational attainment. In a multivariate analysis examining the traits that contribute towards education in children, Krapohl et al. (Reference Krapohl, Rimfeld, Shakeshaft, Trzaskowski, McMillan, Pingault and Plomin2014) found that intelligence, self-efficacy, school environment, home environment, personality, wellbeing, behavioural problems, and health, collectively explained 75% of the heritability of education.
Vertical pleiotropy also illustrates why some PGSs are population specific. When applied to education, a PGS would be population specific insofar as the heritable traits underlying educational attainment are not universal. An example of this was provided by Rimfeld et al. (Reference Rimfeld, Krapohl, Trzaskowski, Coleman, Selzam, Dale and Plomin2018) who showed that a PGS predicted 6.1% of education in post-Soviet Estonia compared with 2.1% in Soviet era Estonia. Furthermore, the total heritability of education in post-Soviet Estonia was estimated to be 37% compared to the Soviet era estimate of 17%. Height was used as a control variable and no significant differences between the heritability estimates were found. These differences were attributed to the rise of a more meritocratic society following the fall of the Soviet Union where individual differences in hard work and ability, which are partly genetically mediated, became the traits predictive of educational success rather than environmentally driven privilege or discrimination.
Some of the heritable traits underlying differences in education may indeed be population specific, as indicated by population-specific genetic effects on education (Rimfeld et al., Reference Rimfeld, Krapohl, Trzaskowski, Coleman, Selzam, Dale and Plomin2018; Tropf et al., Reference Tropf, Lee, Verweij, Stulp, van der Most, de Vlaming and Mills2017). However, meta-analyses of GWASs of education do facilitate loci discovery, which is indicative that some of the association signal is replicated across samples and is consistent with the idea that similar heritable traits underlie education differences across, predominantly European, countries and cultures.
Finally, Burt asks what the added value is of including genetics in a social science study. Mendelian randomisation (MR) is a technique that, at its heart, uses vertical pleiotropy to examine if two traits (such as, e.g., health and education) are causally connected. This is achieved by using genetic variants (such as single or multiple SNPs from a GWAS) as instrumental variables for risk factors that affect the health of a population. As genetic variants are fixed at conception their use as instrumental variables can overcome some types of confounding.
Applied to social science variables, MR has helped to understand the causes and consequences of socioeconomic status (SES) differences where intelligence has been putatively shown to be a causal factor for income (Hill et al., Reference Hill, Davies, Ritchie, Skene, Bryois, Bell and Deary2019a) and education (Anderson et al., Reference Anderson, Howe, Wade, Ben-Shlomo, Hill, Deary and Hemani2020; Davies et al., Reference Davies, Hill, Anderson, Sanderson, Deary and Davey Smith2019), where bi-directional casual effects exist in the case of education. When applied in a multivariable analysis, MR has indicated that education, and not the highly correlated trait of intelligence, is a causal factor in smoking (Sanderson, Davey Smith, Bowden, & Munafò, Reference Sanderson, Davey Smith, Bowden and Munafò2019). Conversely, higher intelligence, and not education, has been indicated to be a causal protective factor against Alzheimer's disease (Anderson et al., Reference Anderson, Howe, Wade, Ben-Shlomo, Hill, Deary and Hemani2020). Using a within-family design an increase in BMI was identified as causally associated with lower levels of education (Howe et al., Reference Howe, Nivard, Morris, Hansen, Rasheed, Cho and Within Family2022).
In conclusion, PGS and GWAS conducted on social science traits capture the partly heritable traits that likely contribute to some of the variance of SES. Such associations are as authentic as those that act in biological pathways influencing disease traits, the difference being that, for social science traits, SNP associations are at the start of a phenotypic pathway beginning at molecular genetic inheritance and ending at phenotypic consequence. This pathway can differ between populations, but it is a strength of the molecular genetic design that MR can be applied to examine which heritable traits are causally linked to SES differences across and between cultures.
Financial support
C.X. and W.D.H. are supported by a Career Development Award from the Medical Research Council (MRC) (MR/T030852/1) for the project titled “From genetic sequence to phenotypic consequence: genetic and environmental links between cognitive ability, socioeconomic position, and health.” This work was undertaken within the Lothian Birth Cohort studies group, which is supported by Age UK, the Medical Research Council (MRC), and the University of Edinburgh. For the purpose of open access, the author has applied a “Creative Commons Attribution (CC BY) licence” to any author accepted manuscript version arising from this submission.
Competing Interest
None.