Bentley et al. propose that decision-making can be understood along two dimensions. The first dimension represents the degree to which an agent makes a decision independently versus one that is socially influenced. The second dimension represents the degree of transparency in the payoffs and risks associated with the decisions agents make. While Bentley et al.’s model is very appealing, we argue that emotions, a key element to understand the way humans make decisions, are missing.
From early theorizing by William James, to Antonio Damasio's work on somatic markers, decades of research consistently have shown that emotions play a central role in the decision-making process (see, e.g., Bechara & Damasio Reference Bechara and Damasio2005; Loewenstein Reference Loewenstein2000). For instance, in economic decisions, fear leads to risk-averse choices, whereas anger leads to risk-seeking choices (Lerner & Keltner Reference Lerner and Keltner2001). In medical decisions, positive affect improves physicians’ clinical reasoning and diagnosis (Estrada et al. Reference Estrada, Isen and Young1997). In ethical decisions, social emotions such as guilt can lead individuals to choose ethically (Steenhaut & Van Kenhove Reference Steenhaut and Van Kenhove2006). These studies, among many others, strongly demonstrate that emotions shape most of our decisions. Researchers in microeconomics, health, or ethics are already taking emotions into account. It is now time for big-data and collective behavior researchers to recognize the importance of the emotional factor in the decision-making process.
In this commentary, we illustrate the importance of emotions to predict people's behavior using the example of a big dataset derived from an ongoing large-scale smartphone-based, experience-sampling project (available at: http://58sec.fr/). Specifically, we show that the happiness that individuals experience at time t reliably predicts the type of activities they choose to engage in at time t+1.
Subjects voluntarily enroll in the experiment by downloading and installing the mobile application “58sec”. They are then presented with questionnaires at random times throughout the day – henceforth referred to as tests. Random sampling is ensured through a notification system that does not require users to be connected to the Internet. The minimum time between two tests is set to one hour to avoid large artifactual auto-correlations between answers to the same question in consecutive tests. At each test, participants are asked to rate their current mood on a scale from 0 (very unhappy) to 100 (very happy) and to report which activity they are currently engaged in, among other questions. Activities can be selected from a list of 25 non-mutually exclusive choices that, among other activities, include doing sports, working, resting, praying/meditating, shopping, and commuting.
To illustrate the dynamic between emotion and decision-making, we randomly selected 5,000 people from our database and investigated how their daily choice of activities (e.g., whether one decides to spend the evening working out or watching TV) is influenced by their emotion. Specifically, we tested how much mood reported within one test (time t) predicts the activity reported within the next test (time t+1). For each possible activity, a logistic regression model is fitted for the probability of the activity (dependent variable) as a function of previously reported mood (independent variable). Mood at time t may be correlated to mood at time t+1, which itself correlates with the activity at time t+1. To cross out this indirect effect of emotion on decision, mood at time t+1 is included in the model as a covariate. Emotions closer in time to a decision may better predict its outcome. To capture this notion, we included an interaction term between the (random) time between the two tests and mood at time t.
Big datasets allow many variables to be compared simultaneously without diluting the effect of interest in the correction required to account for the multiple comparisons. For the same underlying effect size, the p-value will indeed decrease as the number of data points increase. More data points therefore reduce the number of Type II errors (false negatives), for a constant Type I error rate (false findings). Accordingly, the threshold on the p-value can be reduced from its typical value (e.g., 0.05) to also decrease the number of findings that are false. In this study, we set the significance threshold at p < 0.001 to increase the confidence in our findings.
Significance testing was carried out on the coefficient (Betapred) of mood at time t in the prediction of each action at time t+1. The resulting 25 p-values were corrected for multiple comparisons using Bonferroni correction. Each of the 5,000 subjects participated in an average of 13.1 tests. Those subjects who participated in only one test were discarded since their test results did not convey information about the prediction of emotion on decision. This gave rise to a total of 59,663 data points from which the logistic regression could be fitted.
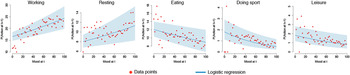
Five activities were significantly predicted by mood at the p = 0.001 threshold after Bonferroni correction (Fig. 1): working (Betapred = 0.48, p < 10−12), resting (Betapred = 0.38, p < 2 × 10⁻⁴), eating (Betapred = −0.34, p < 5 × 10⁻⁴), doing sports (Betapred = −1.3, p < 10−9), and leisure (Betapred = −0.81, p < 3 × 10⁻⁴). These results indicate that mood significantly predicts people's decisions about what to do next, stressing the importance of emotion on decision-making.
Figure 1.
Five activities are significantly predicted by mood. The figure presents the data in red (aggregated by mood in bins of 2 levels: 0–1, 2–3, … , 99–100) and the corresponding logistic curve in blue, corrected for mood at time t+1 and the interaction between mood at time t and time between tests. The shaded area corresponds to two standard errors above and two standard errors below the curve. A color version of this image is available at http://dx.doi.org/10.1017/S0140525X1300191X.
Big data and large-scale experience sampling through pervasive technologies offer unprecedented opportunities to understand collective behaviors. Such methods are particularly suited to study collective behavior as its causes often involve complex interactions between sensitive variables. One archetypal example of such collective behavior is decision-making which involves independence of the agent, transparency of the payoffs, and emotional state.





Bentley et al. propose that decision-making can be understood along two dimensions. The first dimension represents the degree to which an agent makes a decision independently versus one that is socially influenced. The second dimension represents the degree of transparency in the payoffs and risks associated with the decisions agents make. While Bentley et al.’s model is very appealing, we argue that emotions, a key element to understand the way humans make decisions, are missing.
From early theorizing by William James, to Antonio Damasio's work on somatic markers, decades of research consistently have shown that emotions play a central role in the decision-making process (see, e.g., Bechara & Damasio Reference Bechara and Damasio2005; Loewenstein Reference Loewenstein2000). For instance, in economic decisions, fear leads to risk-averse choices, whereas anger leads to risk-seeking choices (Lerner & Keltner Reference Lerner and Keltner2001). In medical decisions, positive affect improves physicians’ clinical reasoning and diagnosis (Estrada et al. Reference Estrada, Isen and Young1997). In ethical decisions, social emotions such as guilt can lead individuals to choose ethically (Steenhaut & Van Kenhove Reference Steenhaut and Van Kenhove2006). These studies, among many others, strongly demonstrate that emotions shape most of our decisions. Researchers in microeconomics, health, or ethics are already taking emotions into account. It is now time for big-data and collective behavior researchers to recognize the importance of the emotional factor in the decision-making process.
In this commentary, we illustrate the importance of emotions to predict people's behavior using the example of a big dataset derived from an ongoing large-scale smartphone-based, experience-sampling project (available at: http://58sec.fr/). Specifically, we show that the happiness that individuals experience at time t reliably predicts the type of activities they choose to engage in at time t+1.
Subjects voluntarily enroll in the experiment by downloading and installing the mobile application “58sec”. They are then presented with questionnaires at random times throughout the day – henceforth referred to as tests. Random sampling is ensured through a notification system that does not require users to be connected to the Internet. The minimum time between two tests is set to one hour to avoid large artifactual auto-correlations between answers to the same question in consecutive tests. At each test, participants are asked to rate their current mood on a scale from 0 (very unhappy) to 100 (very happy) and to report which activity they are currently engaged in, among other questions. Activities can be selected from a list of 25 non-mutually exclusive choices that, among other activities, include doing sports, working, resting, praying/meditating, shopping, and commuting.
To illustrate the dynamic between emotion and decision-making, we randomly selected 5,000 people from our database and investigated how their daily choice of activities (e.g., whether one decides to spend the evening working out or watching TV) is influenced by their emotion. Specifically, we tested how much mood reported within one test (time t) predicts the activity reported within the next test (time t+1). For each possible activity, a logistic regression model is fitted for the probability of the activity (dependent variable) as a function of previously reported mood (independent variable). Mood at time t may be correlated to mood at time t+1, which itself correlates with the activity at time t+1. To cross out this indirect effect of emotion on decision, mood at time t+1 is included in the model as a covariate. Emotions closer in time to a decision may better predict its outcome. To capture this notion, we included an interaction term between the (random) time between the two tests and mood at time t.
Big datasets allow many variables to be compared simultaneously without diluting the effect of interest in the correction required to account for the multiple comparisons. For the same underlying effect size, the p-value will indeed decrease as the number of data points increase. More data points therefore reduce the number of Type II errors (false negatives), for a constant Type I error rate (false findings). Accordingly, the threshold on the p-value can be reduced from its typical value (e.g., 0.05) to also decrease the number of findings that are false. In this study, we set the significance threshold at p < 0.001 to increase the confidence in our findings.
Significance testing was carried out on the coefficient (Betapred) of mood at time t in the prediction of each action at time t+1. The resulting 25 p-values were corrected for multiple comparisons using Bonferroni correction. Each of the 5,000 subjects participated in an average of 13.1 tests. Those subjects who participated in only one test were discarded since their test results did not convey information about the prediction of emotion on decision. This gave rise to a total of 59,663 data points from which the logistic regression could be fitted.
Five activities were significantly predicted by mood at the p = 0.001 threshold after Bonferroni correction (Fig. 1): working (Betapred = 0.48, p < 10−12), resting (Betapred = 0.38, p < 2 × 10⁻⁴), eating (Betapred = −0.34, p < 5 × 10⁻⁴), doing sports (Betapred = −1.3, p < 10−9), and leisure (Betapred = −0.81, p < 3 × 10⁻⁴). These results indicate that mood significantly predicts people's decisions about what to do next, stressing the importance of emotion on decision-making.
Five activities are significantly predicted by mood. The figure presents the data in red (aggregated by mood in bins of 2 levels: 0–1, 2–3, … , 99–100) and the corresponding logistic curve in blue, corrected for mood at time t+1 and the interaction between mood at time t and time between tests. The shaded area corresponds to two standard errors above and two standard errors below the curve. A color version of this image is available at http://dx.doi.org/10.1017/S0140525X1300191X.
Big data and large-scale experience sampling through pervasive technologies offer unprecedented opportunities to understand collective behaviors. Such methods are particularly suited to study collective behavior as its causes often involve complex interactions between sensitive variables. One archetypal example of such collective behavior is decision-making which involves independence of the agent, transparency of the payoffs, and emotional state.