We partner with a secure submission system to handle manuscript submissions.
Please note:
You will need an account for the submission system, which is separate to your Cambridge Core account. For login and submission support, please visit the
submission and support pages.
Please review this journal's author instructions, particularly the
preparing your materials
page, before submitting your manuscript.
Click Proceed to submission system to continue to our partner's website.
To save this undefined to your undefined account, please select one or more formats and confirm that you agree to abide by our usage policies. If this is the first time you used this feature, you will be asked to authorise Cambridge Core to connect with your undefined account.
Find out more about saving content to .
To send this article to your Kindle, first ensure no-reply@cambridge.org is added to your Approved Personal Document E-mail List under your Personal Document Settings on the Manage Your Content and Devices page of your Amazon account. Then enter the ‘name’ part of your Kindle email address below. Find out more about sending to your Kindle.
Find out more about saving to your Kindle.
Note you can select to save to either the @free.kindle.com or @kindle.com variations. ‘@free.kindle.com’ emails are free but can only be saved to your device when it is connected to wi-fi. ‘@kindle.com’ emails can be delivered even when you are not connected to wi-fi, but note that service fees apply.
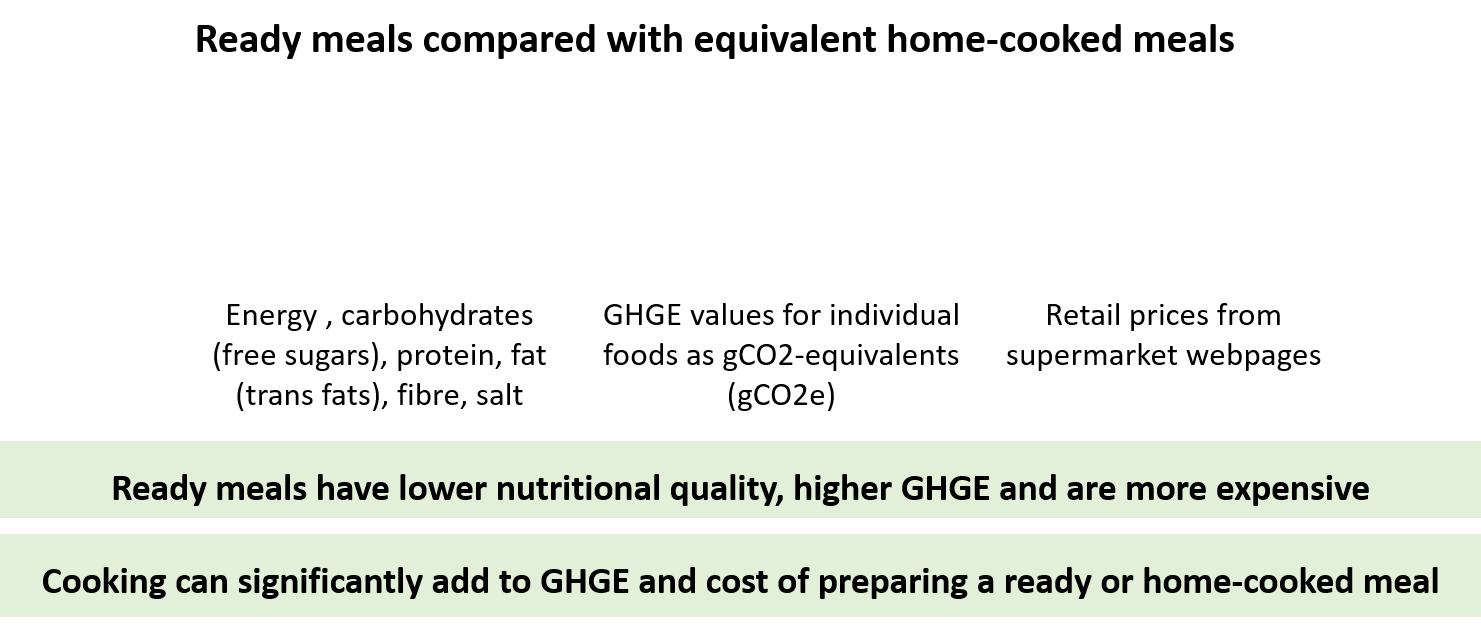
To examine whether ready meals and equivalent home-cooked meals differ in nutritional quality indicators, greenhouse gas emissions (GHGE) and cost.
Design:
We performed a cross-sectional analysis of meal data from the National Diet and Nutrition Survey (NDNS) nutrient databank (2018/19). Additional data on nutrient composition, cost and cooking-related GHGE were calculated and compared between fifty-four ready meals and equivalent home-cooked meals.
Setting:
The UK.
Participants:
Not applicable.
Results:
Ready meals, overall and those that were animal-based, had significantly higher levels of free sugar compared with equivalent home-cooked meals (P < 0·0001 and P < 0·0004, respectively). Animal-based ready meals had significantly higher levels of GHGE (P < 0·001), whereas the cost of ready meals, overall, was significantly higher (P < 0·001), compared with equivalent home-cooked meals. Animal-based meals, whether ready meals or equivalent homemade meals, had significantly higher levels of protein (P < 0·0001), contained significantly more kilocalories (P = 0·001), had significantly higher levels of GHGE (P < 0·0001) and were significantly more expensive (P < 0·0001), compared with plant-based meals. Overall, plant-based meals home-cooked on the gas or electric stove had the lowest GHGE and cost, whereas animal-based oven-cooked ready meals had the highest levels of GHGE and were most expensive.
Conclusions:
Ready meals have lower nutritional quality and higher GHGE and are more expensive than equivalent home-cooked meals, especially those meals that are animal-based and prepared in an oven.
Efforts to improve the nutritional quality and health promotion in the charitable food system have been undertaken. Though methods exist to track these efforts in terms of food banks’ inventory, there are not research-tested tools to assess, monitor and influence policy, systems and environmental (PSE) changes. The study objective was to develop and evaluate a novel assessment tool that could be used to evaluate a food bank’s efforts to improve the promotion of health and nutritious foods.
Design:
The study had five phases: (1) initial development; (2) iterative review and revisions; (3) pilot testing; (4) content validity assessment and (5) inter-rater and test-retest assessment. The Food Bank Health and Nutrition Assessment (FB-HANA) was drafted after reviewing existing policies, nutrition-focused charitable food systems guidance and similar tools for food pantries.
Setting:
Midwestern United States.
Participants:
Eleven food banks.
Results:
Stakeholders and pilot testers provided initial feedback to refine the FB-HANA’s flow, ease of completion and collection of contextual information. External experts rated the FB-HANA and each of the eight objectives as content valid. A set of two assessments completed by twenty-six community-based professionals, employed by Extension and fourteen food bank staff across eleven food banks, supported moderate to excellent inter-rater and test-retest reliability for the FB-HANA overall and each of its objectives.
Conclusions:
Evidence suggests that the FB-HANA can be used by either food bank or community-based professionals, such as Extension staff, to provide a perspective on ways food banks promote health and nutrition through PSE approaches.
The objective of this research was to determine if, based on gender, adolescents were exposed to different marketing techniques that promoted food and beverages over social media.
Design:
A secondary analysis of adolescent boy (n 26) and girl (n 36) exposures (n 139) to food and beverage marketing was conducted. Mann–Whitney U and Fisher’s exact tests were conducted to compare the number, healthfulness and the marketing techniques of exposures viewed by boys and girls.
Setting:
Ottawa, Ontario, Canada.
Participants:
Sixty-two adolescents aged 12–16 years.
Results:
Boys and girls were exposed to similar volumes of food marketing instances (median = 2 for both boys and girls, Mann–Whitney U = 237, P = 0·51) per 10-min period of social media use. More girls viewed products that were excessive in total fat compared to boys (67 % v. 35 %, P = 0·02). Boys were more likely to view instances of food marketing featuring a male as the dominant user (50 % v. 22 %, P = 0·03), appeals to achievement (42 % v. 17 %, P = 0·04), an influencer (42 % v. 14 %, P = 0·02) and appeals to athleticism (35 % v. 11 %, P = 0·03), whereas girls were more likely to view instances of food marketing featuring quizzes, surveys or polls (25 % v. 0 %, P = 0·01).
Conclusions:
Food and beverage companies utilise marketing techniques that differ based on gender. More research examining the relationship between digital food and beverage marketing and gender is required to inform the development of gender-sensitive policies aimed at protecting adolescents from unhealthy food marketing.
To examine demographic and dietary correlates of consumption of a variety of fruits and vegetables (FV) among Texas adolescents. Different types of FV are needed for adequate dietary intake of vitamins and phytochemicals for proper development and functioning throughout the lifespan.
Design:
Cross-sectional analysis from the Texas Surveillance of Physical Activity and Nutrition (Texas SPAN) data comparing consumption of a variety of fruit and vegetables by gender, race/ethnicity and region (Texas-Mexico border/non-border).
Setting:
Middle, high schools in Texas.
Participants:
8th, 11th grade Texas adolescents (n 9056 representing n 659 288) mean age 14·8 years.
Results:
Within this sample, mean fruit and vegetable variety scores (0–7) ranged from 2·47 to 2·65. Boys consumed a significantly greater variety of fruit than girls (mean = 1·12 compared with 1·04). Adolescents in non-border regions consumed a greater variety of vegetables and FV compared with those in border regions. FV variety was associated with healthier eating in the full sample, particularly in the highest socio-economic status (SES) tertile. Within the highest SES tertile, a one-unit increase in variety of fruit, vegetable and FV was associated with significant increases (P < 0·001) in a healthy eating measure, the SPAN Healthy Eating Index: Fruit variety (β = 1·33, se = 0·29), vegetable variety (β = 0·90, se = 0·28) and FV variety (β = 0·81, se = 0·19).
Conclusions:
Consumption of a greater variety of FV appears to be associated with a healthier overall diet. Associations of FV variety with healthy eating were most significant in the highest SES tertile. These findings support the need to further examine consuming a variety of FV within healthy eating behaviour.
The present study examined military families’ use of food distribution resources and military (e.g. rank) and non-military (e.g. race/ethnicity) characteristics associated with using food distribution resources.
Design:
Secondary data analyses from a cross-sectional survey in the first 6 months of 2021.
Setting:
A national sample of eligible families completed an online survey.
Participants:
8326 enlisted military families with an active duty service member in the United States Army or Air Force who applied for supplemental childcare funding distributed by National Military Family Association.
Results:
13·2 % of the families reported utilising a food distribution resource in the past 12 months. Those with lower financial well-being were more likely to utilise such resources. Older (OR = 1·04, 95 % CI = 1·02, 1·05, P < 0·001), single-earner (OR = 0·73, 95 % CI = 0·61, 0·89, P = 0·001) families with a lower rank (OR = 0·69, 95 % CI = 0·64, 0·75, P < 0·001) and Army affiliation (compared with Air Force) (OR = 2·31, 95 % CI = 2·01, 2·67, P < 0·001) were more likely to utilise food distribution resources. Members of certain racial/ethnic minority groups were more likely to utilise food distribution resources than White respondents (OR from 1·47 for multi-racial to 1·69 for Asians), as were families with more dependent children (OR = 1·35, 95 % CI = 1·25, 1·47, P < 0·001).
Conclusions:
These results identify the extent of food distribution resource utilisation in military families with young children approximately 1 year into the COVID-19 pandemic. The results also identify characteristics associated with their use of food distribution resources. Findings are discussed with an emphasis on prevention and intervention implications for military families.
The health implications of excessive added sugar intakes have led to national policy actions to limit their consumption. Subsequently, non-nutritive sweeteners (NNS) may be used to maintain product sweetness. We aimed to assess trends in quantities of added sugars and NNS sold in packaged food and beverages worldwide, and the association between these trends and the number of national policy actions across regions to reduce added sugar consumption.
Design:
(i) Longitudinal analysis of Euromonitor sales data (2007–2019) to assess the quantity of added sugars (kg) and NNS (g) sold in packaged foods and beverages globally, across regions, and across country income categories; (ii) policy-mapping of policy actions targeting added sugar consumption globally from the NOURISHING database; and (iii) Spearman’s correlations to assess the association between national policy actions across regions and changes in added sugar/NNS sales.
Setting:
Worldwide.
Participants:
Not applicable.
Results:
Per capita volumes of NNS from beverage sales increased globally (36 %). Added sugars from beverage sales decreased in high-income countries (22 %) but increased in upper-middle-income countries (UMIC) and lower-middle-income countries (LMIC) (13–40 %). Added sugars from packaged food sales increased globally (9 %). Regions with more policy actions had a significant increase in NNS quantities from beverage sales (r = 0·68, P = 0·04). The sweetness of the packaged food supply (the sweetness of each NNS and added sugar, relative to sucrose, multiplied by sales volume) increased over time.
Conclusions:
The increasing use of NNS to sweeten beverages globally, and in packaged food in UMIC and LMIC, may have health and dietary implications in the future. Their use as a substitute for added sugar should be considered in public health nutrition policymaking.
To compare the frequency and healthfulness of foods being advertised to children and adolescents in four countries of WHO European region.
Design:
Cross-sectional quantitative study, guided by an adapted version of the WHO protocol. All recorded food advertisements were categorised by categories and as either ‘permitted’ or ‘not permitted’ for advertising to children in accordance with WHO Regional Office for Europe Nutrient Profile Model.
Settings:
Four countries: Russia, Turkey, Kazakhstan and Kyrgyzstan
Participants:
TV channels most popular among children and adolescents
Results:
Analysis included 70 d of TV broadcasting for all channels, during which time there were 28 399 advertisements. The mean number of advertisements per hour varied from eleven in Turkey and Kazakhstan to eight and two in Russia and Kyrgyzstan. In all countries, the majority of the food and beverages advertised should not be permitted for advertising to children according to the WHO Nutrient Profile Model. The mean number of non-permitted food and beverage advertisements per hour was high in Turkey and Kazakhstan (8·8 and 8·5 ads) compared with Russia (5·1) and Kyrgyzstan (1·9). Turkey was the only country where nutritional information was fully available, and no values were missing that prevented coding for some product categories.
Conclusions:
Results revealed that children and adolescents in four countries are exposed to a considerable volume of food and beverage advertisements, including sugary products on broadcast television. As such, policymakers should consider protecting youth by developing regulations to restrict these marketing activities within media popular with children.
The aim of this study is to assess the validity and reliability of the Adult Eating Behaviour Questionnaire (AEBQ-TR) for adults.
Design:
Hunot et al. (2016) developed the original questionnaire, which was modified and translated into Turkish. On data collected from adults, construct validity was assessed using exploratory factor analysis and confirmatory factor analysis. Pearson’s and Cronbach’s correlation coefficients were used to evaluate reliability and validity (P < 0·05).
Setting:
This research was carried out in Ankara, Turkey.
Participants:
A total of 311 adults from Ankara (148 men and 163 women) took part in the study. Seventy-two of these adults take the retest.
Results:
In the present study, 311 adults with a mean age of 29·3 ± 11·3 years participated. Factor loadings ranged from 0·404 to 0·907. In general, food approach and food avoidance scales showed a positive correlation within themselves. According to the results of confirmatory factor analysis and goodness-of-fit indicators, the seven-factor model showed a better model fit in the Turkish data (chi-square/degrees of freedom = 2·137, root mean error of approximation: 0·061, comparative fit index: 0·884, and normed fit index: 0·850). Higher BMI was associated with higher Emotional Over-eating, higher Enjoyment of the Food, lower Food Satiety and lower Emotional Under-eating.
Conclusions:
The Turkish AEBQ is a valid and reliable tool for 20- to 65-year adults to determine appetitive properties related to the aetiology of weight change and especially obesity risk. Besides, AEBQ testing is required for validation in early and late adulthood.
School-based CalFresh Healthy Living (CFHL) (California’s SNAP-Ed) interventions adapted to new learning environments necessitated by COVID-19. We examined the impact of these interventions on student diet and physical activity (PA) outcomes.
Design:
Quasi-experimental, two-group, pre-post.
Setting:
California public schools with ≥50 % of students Free and Reduced Price Meal-eligible (nintervention = 47; ncomparison = 17).
Participants:
Fourth- and fifth-grade students who completed the online Eating and Activity Tool for Students at pre and post (nintervention = 1087; ncomparison = 846 students).
Results:
Intervention students reported a significantly greater increase in consumption frequency of total fruit (by 0·16 times/d; P = 0·032), driven primarily by a greater increase in 100 % fruit juice (by 0·11 times/d; P = 0·007). Intervention students reported a significantly greater increase in total vegetable consumption frequency (by 0·45 times/d; P < 0·001) than comparison students. Specifically, intervention students reported increased, whereas comparison students reported decreased, consumption frequencies for starchy vegetables (0·05 v. −0·10 times/d, P < 0·001), salad/green vegetables (0·01 v. −0·11 times/d, P = 0·005) and beans (0·04 v. −0·03 times/d, P = 0·025). Consumption frequency of other vegetables decreased in both groups (−0·01 v. −0·09 times/d) but decreased more among comparison students (P = 0·048). No differences in pre-post change in PA outcomes were detected.
Conclusions:
Findings suggest that despite COVID-19-related challenges necessitating programme modifications, CFHL interventions played a role in protecting student consumption of fruit and vegetables during the 2020–2021 school year. Therefore, it appears that school-based CFHL interventions can be a viable means of safeguarding student nutrition at a time when access to nutritious food and PA opportunities are hindered.
The purpose of this study is to determine if healthier neighbourhood food environments are associated with healthier diet quality.
Design:
This was a cross-sectional study using linear regression models to analyse data from the Maastricht Study. Diet quality was assessed using data collected with a FFQ to calculate the Dutch Healthy Diet (DHD). A buffer zone encompassing a 1000 m radius was created around each participant home address. The Food Environment Healthiness Index (FEHI) was calculated using a Kernel density analysis within the buffers of available food outlets. The association between the FEHI and the DHD score was analysed and adjusted for socio-economic variables.
Setting:
The region of Maastricht including the surrounding food retailers in the Netherlands.
Participants:
7367 subjects aged 40–75 years in the south of the Netherlands.
Results:
No relationship was identified between either the FEHI (B = 0·62; 95 % CI = –2·54, 3·78) or individual food outlets, such as fast food (B = –0·07; 95 % CI = –0·20, 0·07) and diet quality. Similar null findings using the FEHI were identified at the 500 m (B = 0·95; 95 % CI = –0·85, 2·75) and 1500 m (B = 1·57; 95 % CI = –3·30, 6·44) buffer. There was also no association between the food environment and individual items of the DHD including fruits, vegetables and sugar-sweetened beverages.
Conclusion:
The food environment in the Maastricht area appeared marginally unhealthy, but the differences in the food environment were not related to the quality of food that participants reported as intake.
To aid the design of nutrition interventions in low- and middle-income countries undergoing a nutrition transition, this study examined behavioural and environmental risk factors associated with childhood overweight and obesity in urban Indonesia.
Design:
Body height and weight of children were measured to determine BMI-for-age Z-scores and childhood overweight and obesity status. A self-administered parental survey measured socio-economic background, children’s diet, physical activity, screen time and parental practices. Logistic and quantile regression models were used to assess the association between risk factors and the BMI-for-age Z-score distribution.
Setting:
Public primary schools in Central Jakarta, sampled at random.
Participants:
Children (n 1674) aged 6–13 years from 18 public primary schools.
Results:
Among the children, 31·0 % were overweight or obese. The prevalence of obesity was higher in boys (21·0 %) than in girls (12·0 %). Male sex and height (aOR = 1·67; 95 % CI 1·30, 2·14 and aOR = 1·16; 95 % CI 1·14, 1·18, respectively) increased the odds of being overweight or obese, while the odds reduced with every year of age (aOR = 0·43; 95 % CI 0·37, 0·50). Maternal education was positively associated with children’s BMI at the median of the Z-score distribution (P = 0·026). Dietary and physical activity risk scores were not associated with children’s BMI at any quantile. The obesogenic home food environment score was significantly and positively associated with the BMI-for-age Z-score at the 75th and 90th percentiles (P = 0·022 and 0·023, respectively).
Conclusions:
This study illustrated the demographic, behavioural and environmental risk factors for overweight and obesity among primary schoolchildren in a middle-income country. To foster healthy behaviours in primary schoolchildren, parents need to ensure a positive home food environment. Future sex-responsive interventions should involve both parents and children, promote healthy diets and physical activity and improve food environments in homes and schools.
This systematic review aimed to summarise the level of quality and accuracy of nutrition-related information on websites and social media and determine if quality and accuracy varied between websites and social media or publishers of information.
Design:
This systematic review was registered with PROSPERO (CRD42021224277). CINAHL, MEDLINE, Embase, Global Health and Academic Search Complete were systematically searched on 15 January 2021 to identify content analysis studies, published in English after 1989, that evaluated the quality and/or accuracy of nutrition-related information published on websites or social media. A coding framework was used to classify studies’ findings about information quality and/or accuracy as poor, good, moderate or varied. The Academy of Nutrition and Dietetics Quality Criteria Checklist was used to assess the risk of bias.
Setting:
N/A.
Participants:
N/A.
Results:
From 10 482 articles retrieved, sixty-four were included. Most studies evaluated information from websites (n 53, 82·8 %). Similar numbers of studies assessed quality (n 41, 64·1 %) and accuracy (n 47, 73·4 %). Almost half of the studies reported that quality (n 20, 48·8 %) or accuracy (n 23, 48·9 %) was low. Quality and accuracy of information were similar on social media and websites, however, varied between information publishers. High risk of bias in sample selection and quality or accuracy evaluations was a common limitation.
Conclusion:
Online nutrition-related information is often inaccurate and of low quality. Consumers seeking information online are at risk of being misinformed. More action is needed to improve the public’s eHealth and media literacy and the reliability of online nutrition-related information.
Tobacco consumption among low- and middle-income countries where food insecurity remains a challenge poses several concerns. This review examines the available global evidence linking smokeless tobacco (SLT) use with public health nutrition and its implications.
Design:
Systematic review of articles extracted from PubMed and Scopus from January 2000 to December 2020.
Setting:
Included studies that demonstrated the relationship between SLT and nutrition-related factors, that is, BMI, malnutrition, anaemia, poor birth outcomes and metabolic disorders. Preferred Reporting Items for Systematic Reviews and Meta-Analysis (PRISMA) guidelines have been followed to conduct the systematic evidence review.
Participants:
A total of thirty-four studies were finally used in the systematic review, which included cross-sectional (thirty-one) and cohort (three).
Results:
SLT use has a huge impact on body weight, alteration in taste, poor oral health, and consumption of fruits and vegetables leading to malnutrition. Maternal use of SLT not only leads to anaemia but also hampers birth outcomes. Increased risk of metabolic syndrome and gallstone disease among SLT users are also well documented in the studies.
Conclusion:
The review highlights the linkages between SLT usage and poor nutritional outcomes. Tobacco control efforts should be convergent with public health nutrition to achieve overall health benefits. Attention is also required to explore suitable mechanisms for SLT cessation combined with enhancing food and nutrition security at the community level in sync with investments in public health nutrition intervention.
To examine: (1) cross-sectional and longitudinal associations between measures of food insecurity (FI; household status and youth-reported) and intuitive eating (IE) from adolescence to emerging adulthood; and (2) the association between FI persistence and IE in emerging adulthood.
Design:
Longitudinal population-based study. Young people reported IE and FI (two items from the US Household Food Security Module) in adolescence and emerging adulthood. Parents provided data on household FI via the six-item US Household Food Security Module in adolescence.
Setting:
Adolescents (Mage = 14·3 ± 2 years) and their parents, recruited from Minneapolis/St. Paul public schools in 2009–2010 and again in 2017–2018 as emerging adults (Mage = 22·1 ± 2 years).
Participants:
The analytic sample (n 1372; 53·1 % female, 46·9 % male) was diverse across race/ethnicity (19·8 % Asian, 28·5 % Black, 16·6 % Latinx, 14·7 % Multiracial/Other and 19·9 % White) and socio-economic status (58·6 % low/lower middle, 16·8 % middle and 21·0 % upper middle/high).
Results:
In cross-sectional analyses, youth-reported FI was associated with lower IE during adolescence (P = 0·02) and emerging adulthood (P < 0·001). Longitudinally, household FI, but not adolescent experience of FI, was associated with lower IE in emerging adulthood (P = 0·01). Those who remained food-insecure (P = 0·05) or became food-insecure (P = 0·02) had lower IE in emerging adulthood than those remaining food-secure. All effect sizes were small.
Conclusions:
Results suggest FI may exert immediate and potentially lasting impacts on IE. As evidence suggests IE is an adaptive approach conferring benefits beyond eating, it would be valuable for interventions to address social and structural barriers that could impede IE.
As the world’s population is ageing, improving the physical performance (PP) of the older population is becoming important. Although diets are fundamental to maintaining and improving PP, few studies have addressed the role of these factors in adults aged ≥ 85 years, and none have been conducted in Asia. This study aimed to determine the dietary patterns (DP) and examine their relationship with PP in this population.
Design:
This cross-sectional study (Kawasaki Aging and Wellbeing Project) estimated food consumption using a brief-type self-administered diet history questionnaire. The results were adjusted for energy after aggregating into thirty-three groups, excluding possible over- or underestimation. Principal component analysis was used to identify DP, and outcomes included hand grip strength (HGS), timed up-and-go test, and usual walking speed.
Setting:
This study was set throughout several hospitals in Kawasaki city.
Participants:
In total, 1026 community-dwelling older adults (85–89 years) were enrolled.
Results:
Data of 1000 participants (median age: 86·9 years, men: 49·9 %) were included in the analysis. Three major DP (DP1: various foods, DP2: red meats and coffee, DP3: bread and processed meats) were identified. The results of multiple regression analysis showed that the trend of DP2 was negatively associated with HGS (B, 95 % CI –0·35, –0·64, –0·06).
Conclusions:
This study suggests a negative association between HGS and DP characterised by red meats and coffee in older adults aged ≥ 85 years in Japan.
To conduct a comprehensive systematic review and meta-analysis of the available literature on the anthropometric nutritional status of South African infants and children, 0–18 years old and to report on trends of changes in nutritional status over the period 1997–2022.
Design:
Systematic review and meta-analysis.
Setting:
Review of the available literature on the anthropometric nutritional status of South African infants and children, 0–18 years old, over the period 1997–2022.
Participants:
South African infants and children, 0–18 years old.
Results:
Only quantitative data from ninety-five publications that described the nutritional status in terms of anthropometry were included. Most recent studies applied the WHO 2006 and 2007 definitions for malnutrition among children 0–5 years old and 5–19 years old, respectively. Meta-analysis of all prevalence data shows the highest stunting prevalence of 25·1 % among infants and preschool children, compared to 11·3 % among primary school-age children and 9·6 % among adolescents. Furthermore, the overweight and obesity prevalence was similar among children younger than 6 years and adolescents (19 %), compared to 12·5 % among primary school-age children. In national surveys, adolescent overweight prevalence increased from 16·9 % in 2002 to 23·1 % in 2011. Meta-regression analysis shows a decrease in stunting among children 6–18 years old and an increase in combined overweight and obesity in the 10–19 years age group.
Conclusion:
The double burden of malnutrition remains evident in South Africa with stunting and overweight/obesity the most prevalent forms of malnutrition among children.
We aimed to explore the relationship between socio-economic characteristics and sustainable dietary patterns.
Design:
Dietary data were derived from a web-based FFQ. Diet sustainability was evaluated using a modified Sustainable Diet Index, comprising nutritional, environmental and cultural components (higher scores expressing higher sustainability). The socio-economic position markers were education, household income and occupation status. Multi-adjusted linear and Poisson regression models were used to assess the cross-sectional association of the markers of socio-economic status with a sustainable diet and sustainability subcomponents, respectively.
Setting:
France.
Participants:
29 119 NutriNet-Santé participants.
Results:
Individuals with a more sustainable diet had slightly higher diet monetary cost, lower total energy intake and consumed less animal-based foods than their counterparts. Lower education level was associated with lower overall diet sustainability (βprimary v. postgraduate = -0·62, 95 % CI (-0·72, −0·51)) and nutrition, socio-cultural and environmental subscores. Manual workers and employees had a lower modified Sustainable Diet Index than intermediate professionals (βmanual workers v. intermediate professionals = -0·43, 95 % CI (−0·52, −0·33) and βemployees v. intermediate professionals = -0·56, 95 % CI (−0·64, −0·48)). Participants with the lowest v. highest incomes had a higher environmental subscore but a lower socio-cultural subscore, whereas the results were less marked for occupational status.
Conclusions:
Overall, our results documented associations between socio-economic status and the level of diet sustainability, arguing for the implementation of appropriate food policies to promote sustainable diets at lower cost.
One explanation for the relationship between TV viewing and obesity is that people may (over)eat while watching TV. The current study investigated associations between TV viewing and the time spent on (concurrent) eating in a naturalistic setting among a general population sample.
Design:
Preregistered secondary data analyses were performed of a diary survey in which respondents reported their time use in 10-min blocks for 7 d.
Setting:
Concurrent TV viewing and eating was operationalised as all blocks in which TV viewing and eating occurred simultaneously. Furthermore, the TV content respondents watched was coded as food-related (i.e. culinary content) or non-food related.
Participants:
The sample composed of 2292 adults (58·9 % female) in the Netherlands, aged ≥ 20 years, from all educational levels (18·1 % low, 29·8 % middle and 51·4 % high).
Results:
More than half of the respondents (51·3 %) reported concurrent TV viewing and eating at least once during the 7-d diary period. The average eating occasion was longer in duration while watching TV (v. without media use), and the total time spent on eating was longer on days of concurrent TV viewing and eating (v. days of eating without media use). The percentage of TV viewing time spent on concurrent eating did not differ between food-related and non-food-related TV content.
Conclusions:
Eating while watching TV was related to an increased time spent on eating. Even though energy intake was not assessed, these findings from a naturalistic setting provide further evidence that concurrent TV viewing and eating may contribute to overeating.
To (i) examine the consumption of highly processed foods (HPF) in relation to diet quality among Japanese adults and (ii) compare the results when dishes prepared away home are disaggregated into food ingredients before classification by processing levels and the results when they are not.
Design:
Cross-sectional analysis using 4-day dietary record data. Foods were categorised by level of processing using the framework developed by the University of North Carolina at Chapel Hill. Specifically, dishes prepared away from home were classified at both the food level (classified after disaggregation into ingredients) and dish level (classified without disaggregation). Diet quality was assessed using the Healthy Eating Index-2015 and Nutrient-Rich Food Index 9·3.
Setting:
Twenty areas in Japan.
Participants:
Adults aged 20–69 years (n 388).
Results:
Energy contribution of HPF was higher when dishes prepared away from home were classified at dish level than food level (48·3 % v. 32·9 %, P < 0·0001). Regardless of the classification method, cereals and starchy foods were the top food groups contributing to total energy intake from HPF. After adjusting for potential confounders, participants in higher tertiles of the energy contribution of HPF had lower total scores for Healthy Eating Index-2015 and Nutrient-Rich Food Index 9·3 (P for trend ≤ 0·007 for all), irrespective of the food- or dish-level classification.
Conclusions:
HPF accounted for at least one-third of energy intake of Japanese adults. Regardless of the classification methods for dishes prepared away from home, higher consumption of HPF was associated with lower diet quality.
To demonstrate the potential impact on population health if policies designed to reduce population trans fatty acid (TFA) intake are successfully implemented in the Eurasian Economic Union (EAEU) in line with the WHO’s guidelines to lower intake of TFA as a percentage of total energy intake to less than 1 %.
Design:
A projection exercise was conducted to estimate reductions in CVD-related deaths in countries of the EAEU if TFA policies are implemented in the EAEU. Plausibly causal, annual effects (in %) of Denmark’s TFA policy on the evolution of CVD mortality rates were applied to project the potential effects of recently announced TFA policies in Armenia, Belarus, Kazakhstan, Kyrgyzstan and the Russian Federation under three TFA exposure scenarios.
Settings:
Member States of the EAEU: Armenia, Belarus, Kazakhstan, Kyrgyzstan and the Russian Federation.
Participants:
Data used for the projection exercise were based on estimates from natural experimental evidence from Denmark. National CVD mortality rates used were from WHO and the Organisation for Economic Cooperation and Development datasets.
Results:
In all countries and in all scenarios, deaths averted were ≤ 5 deaths/100,000 in year 1 and rose in years 2 and 3. The highest projected impacts in the high-exposure scenario were seen in Kyrgyzstan (39 deaths/100 000), with the lowest occurring in Armenia (24 deaths/100 000).
Conclusion:
This study demonstrates the potential population health gains that can be derived from effective policies to reduce TFA in line with WHO guidance. Monitoring and surveillance systems are needed to evaluate the effectiveness of the TFA reduction policies in a national context.