



Introduction
How did cognition evolve in animals? How did some animals acquire complex brains and cognitive abilities, while others did not? At a large evolutionary scale, the phylogenetic distribution of complex brains and cognition is restricted to only three (Chordata, Mollusca and Euarthropoda) of approximately 34 bilaterian phyla of living animals today (Table 1; Figs. 1, 2; Patton, Reference Patton2008; Roth, Reference Roth2015). Within these three phyla, the distribution is even further limited to only one (Cephalopoda) of eight classes of mollusks and only one (Vertebrata) of three chordate subphyla (Table 1; Appendix A). In contrast, there is presently no evidence to suggest that brain and cognitive complexity is confined to any of the three major euarthropod clades (Pancrustacea, Chelicerata and Myriopoda).
Putative examples of complex cognition in three lineages

The phylogenetic relationship of 17 phyla with red asterisks denoting phyla that contain lineages with complex brains (Fig. 2) and cognition (Table 1). Phylogeny follows that of Dunn et al. (Reference Dunn, Giribet, Edgecombe and Hejnol2014) with modifications from Pisani et al. (Reference Pisani, Pett, Dohrmann, Feuda, Rota-Stabelli, Philippe, Lartillot and Wörheide2015) and Nielsen (Reference Nielsen2019) as to the position of Porifera. Relationships shown here should be regarded as tentative, as there is still debate and uncertainty in the field. Filled circles depict branch nodes of common ancestors, including the original node of multicellular life (∼750 – 800 mya)(Erwin, Reference Erwin2020), often imagined as a hollow ball of flagellated cells or ‘choanoblastaea’ (Nielsen, Reference Nielsen2008). Note that all phyla with bilateral symmetry share an ancient (∼600 mya, Erwin Reference Erwin2020) common bilaterian ancestor, but that bilaterians have subsequently diverged into one deuterostome and two protostome (Spiralia/Trochozoa and Ecdysozoa) clades, each containing one lineage with brain and cognitive complexity. Animal illustrations by Megan Miazgowicz.

Examples of complex brains in (A) a generic avian vertebrate, (B) a hexapod euarthropod (bee) and (C) the octopus, a cephalopod mollusk. A relatively simple protostome brain with unfused cerebral ganglia (CG) is illustrated for a non-cephalopod (gastropod) mollusk in D. Colored areas indicate different brain regions that are common to animals with complex brains (see key and Appendix A). Small dots in B represent dense clusters of Kenyon cells in euarthropod mushroom bodies, one of the diagnostic features for the adaptive filter architectures that may be common to complex brains (see Brain traits in Appendix B). Brains in A, C and D are oriented along the anterior (a)-posterior (p) body axis, whereas that in B is along the dorsal (d) – ventral (v) axis. The laminated retina of the optic vesicle (eyeball) is not traditionally included as a vertebrate brain structure but is treated as such here. For further details on brain organization across the phylogenetic spectrum, see Appendix A. Illustrations by Megan Miazgowicz, based on figures in Bullock and Horridge (Reference Bullock and Horridge1965), Hochner & Glanzman (Reference Hochner and Glanzman2016), Loesel et al. (Reference Loesel, Wolf, Kenning, Harzsch, Sombke, Minelli and Giuseppe2013) and Young (Reference Young1971).

Among cognitively complex (CC) lineages, several non-human vertebrates are well-known for their complex brains and cognitive abilities, including dolphins (Marino et al. Reference Marino, Connor, Fordyce, Herman, Hof, Lefebvre, Lusseau, McCowan, Nimchinsky, Pack, Rendell, Reidenberg, Reiss, Uhen, Van der Gucht and Whitehead2007), chimpanzees (Matsuzawa, Reference Matsuzawa2009), and some birds (e.g., parrots and crows) (Pepperberg, Reference Pepperberg and Tallerman2005; Emery and Clayton, Reference Emery and Clayton2004). The octopus, a cephalopod mollusk, is the veritable poster child for brain complexity among invertebrates (Mather and Dickel, Reference Mather and Dickel2017), but there are many other, much smaller invertebrates in the phylum Euarthropoda, also known for their brain and cognitive complexities (Perry et al., Reference Perry, Barron and Chittka2017; Pfeffer and Wolf, Reference Pfeffer and Wolf2020). In Pancrustacea, these include insects like honeybees (Chittka, Reference Chittka2017) and dragonflies (Mischiati et al., Reference Mischiati, Lin, Herold, Imler, Olberg and Leonardo2015), and in Chelicerata, spiders (Jackson and Cross, Reference Jackson, Cross and Casas2011; Japyassu and Laland, Reference Japyassú and Laland2017), especially the jumping spiders (Salticidae)(Aguilar-Arguello and Nelson, Reference Aguilar-Arguello and Nelson2021).
Numerous comparative studies have identified different factors (selection pressures) in the evolution of big (often used as a proxy for complex) brains in different animals (Healy and Rowe, Reference Healy and Rowe2007; Dunbar and Shultz, Reference Dunbar and Shultz2007, Reference Dunbar and Shultz2017; Uomini et al., Reference Uomini, Fairlie, Gray and Griesser2020; Sayol et al, Reference Sayol, Collado, Garcia-Porta, Seid, Gibbs, Agorreta, San Mauro, Raemakers, Sol and Bartomeus2020; Aguilar-Arguello & Nelson, Reference Aguilar-Arguello and Nelson2021). For example, factors involving complex ecological (e.g., unpredictability of food resources over time and space) and social (e.g., group living) conditions appear to play key roles in the evolution of flexible behaviors and more complex brains and cognition. But as Healy and Rowe (Reference Healy and Rowe2007) point out, there are a bewildering number of behavioral, ecological, social, life history and other factors that appear to be correlated with larger, more complex brains in different animal groups. Indeed, it is likely that the evolution of brain and cognitive complexity is a mosaic process involving multiple factors that differ for different animal groups (Barret, Henzi and Bartor Reference Barrett, Henzi and Barton2022). As such, various selection pressures may help explain how different, closely related groups of animals (e.g., mammalian vertebrates) might diverge in their evolutionary trajectories, leading to the expansion of brains and cognitive complexity in some mammals (e.g., primates) relative to others (e.g., rodents). However, no single factor or even combination of factors can explain how or why only three, distantly-related lineages – vertebrates, eaurthropods and cephalopod mollusks - appear to have the potential for expansion in the first place.
To explain the latter phenomenon, we look for intrinsic properties that might have enabled animals in CC lineages to expand their brain and cognitive capacities when the ‘right’ conditions (selection pressures) presented themselves. That is, we search for a set of embodied traits that CC lineages share and that, at the same time, set them apart from all other non-CC lineages. Trestman (Reference Trestman2013, Reference Trestman, Andrews and Beck2018) hypothesized that CC lineages can be characterized by a unique set of integrated body, sensory and motor traits that enable complex, goal-directed body actions, and that the resulting cognitive ‘toolkit’ for controlling these actions laid the neural groundwork for complex forms of cognition. Because this hypothesis is largely based on informal, qualitative assessments of the fossil record, we seek to supplement theory in this paper with a more rigorous distribution of 35 traits in five categories (body, sensory, brain, motor and behavioral/cognitive) across not only the three CC lineages, but also 14 non-CC lineages. In doing so, we aim to evaluate whether and how a narrative of the parallel evolution of mind and body together holds at the full scale of the history and diversity of animal life.
We begin with a brief overview of our approach (Section 1), followed by the key findings of the trait distributions (Section 2) and how we use them in a two-dimensional framework (across time and multiple traits) to understand the evolution of brains and cognition across all phyla (Sections 3 and 4). Cognitive outliers that do not quite fit the common mold of CC and non-CC distinctions are discussed in Section 5, and detailed methods and additional results that support our working premises and framework are presented in Sections 6 and 7. A discussion of limitations and potential pitfalls of the proposed framework, as well as gaps in our knowledge and directions for future research follows in Section 8. We finish with a summary and conclusions section.
1. Overview
1A. To define (or not define) complexity
If we are to understand how complex brains and cognition evolved in only three lineages, we must have some way of recognizing complexity when we see it. To our knowledge, there are presently no universally recognized standards or characteristics for doing so, although there are plenty of notions as to what complexity entails.
Perhaps the most common and enduring notion of cognitive complexity is that associated with intelligence (Morgan, Reference Morgan1882; Thorndike, Reference Thorndike1898; Jerison, Reference Jerison1973; Emery and Clayton, Reference Emery and Clayton2004; Reznikova, Reference Reznikova2007; Roth, Reference Roth2015; Seed and Mayer, Reference Seed, Mayer, Call, Burghardt, Pepperberg, Snowdon and Zentall2017; Zentall Reference Zentall and Sternberg2020), defined as “the ability to reason, plan, solve problems, think abstractly, comprehend complex ideas, learn quickly and learn from experience” (Gottfredson’s Reference Gottfredson1997). Many other concepts, such as mental time travel (remembering the past and imagining the future), innovation and behavioral flexibility (e.g., inventing new behaviors to solve problems), theory of mind (knowledge of intent in other beings), consciousness (awareness of internal states and external surroundings), and tool use have also been associated with complex cognition in humans and other animals (Table 1; Emery and Clayton, Reference Emery and Clayton2004; Laland and Seed, Reference Laland and Seed2021).
Developing common standards is difficult for several reasons, not the least of which is that cognition, in general, is a very fuzzy concept, one that involves different defining characteristics in different disciplines (Bayne et al, Reference Bayne, Brainard, Byrne, Chittka, Clayton, Heyes, Mather, Ölveczky, Shadlen and Suddendorf2019), and one that, arguably, may not even be amenable to any strict categorical definition (Allen, Reference Allen2017). Similarly, finding objective standards for characterizing brain complexity across the diversity of vertebrate and invertebrate brains is challenging, made all the more difficult by fundamental differences in how protostome (invertebrates) and deuterostome (vertebrates and their allies) brains develop, and the varied and often confusing terminology used to describe invertebrate brain structures, sometimes even within the same phylum (see Appendix A).
In this paper, we attempt to circumvent this class of problems by identifying brain, cognitive and other traits that can be widely applied (and recognized) across lineages and that, by all appearances, vary from simple to complex. We then let the phyletic distributions of these traits tell us which, if any, are unique to CC lineages and which are not (see Sections1B and 6A for further detail).
1B. Working premises and general approach
We start with two premises: that cognition is embodied (Clark, Reference Clark1999) and that complex brains and cognition have evolved in only three lineages – vertebrates, cephalopod mollusks and euarthropods. We then selected a wide range of body, sensory, brain, motor, and behavioral/cognitive traits (5 - 8 in each category) that meet several key conditions for a good operational definition (see section 6A). In essence, we are trying to discover the defining characteristics of CC lineages, i.e., the embodied trait profiles that distinguish them from non-CC phyla. Thus, we determined the presence or absence of 35 traits in the three CC lineages, as well as in non-CC lineages, including three non-bilaterian phyla (Porifera, Ctenophora and Cnidaria) and eleven bilaterian phyla (Fig. 1). We started with a phylum-level analysis for non-CC lineages because we had no objective basis for selecting subphylum levels. We then let the distribution of all 35 traits across non-CC and CC lineages determine, which, if any, traits are unique to CC lineages. Finally, information from trait distributions were applied to a two-dimensional framework for understanding how different behavioral and cognitive outcomes might be understood in terms of a unique combination of body, sensory, brain and motor traits (first dimension), and how changes in the combination of traits led to increasing levels of cognitive complexity over time (second dimension).
2. Key findings
At least five important findings emerge from the distribution of multiple traits across CC and non-CC lineages. First, CC lineages do indeed share a set of non-cognitive (body, sensory, brain and motor) traits that is unique to them and that is uniquely associated with complex behavioral and cognitive traits (Sections 2A,B). Second, these non-cognitive traits, which we regard as pivotal to the emergence of complex cognitive traits, all have one thing in common – they are all involved in active visual sensing, which includes visual reafference for monitoring self-action and the visuomotor control of object-oriented actions (Sections 2C,D). Third, a two-dimensional framework (across traits and over time), woven from the information in the trait distributions, can explain the parallel but independent acquisition of pivotal traits in CC lineages as the completion of several major transitions involving increasing levels of complexity, each defined by a distinct combination of traits (Sections 3 and 4). Fourth, pivotal trait combinations are diagnostic of CC lineages, whereas other trait combinations, at lower levels of complexity in the framework, are characteristic of non-CC lineages, indicating that certain trait combinations occur more frequently than others, perhaps because traits are linked (Section 3A). Fifth, although vertebrates, cephalopod mollusks and euarthropods may have been the only three lineages to have acquired (and retained) the entire set of pivotal traits, one highly mobile group of annelids (Errantia polychaetes) has some but not all of them, providing an interesting example of how lineages can arrive at their current levels of brain and cognitive complexity through both progressive addition and regressive loss of traits (Sections 3 and 5).
2A. Multi-trait pyramids: Building brains and cognition from the ground up
Phyletic distributions of different traits are compiled into a single pyramid, with each building block of the pyramid representing a different trait, the length of which is proportional to the number of phyla (or lineages) that share that trait (Fig. 3A). Keeping in mind that each trait is common to all three CC lineages, the bottom of the pyramid represents very primitive (foundational) traits that are broadly shared with non-CC lineages. In contrast, the top of the pyramid (advanced traits) depicts more recently derived traits that are either unique to CC lineages or shared with only one other non-CC phylum. Filling the gap between foundational and advanced traits is a set of intermediate traits that are neither unique to CC lineages nor broadly shared with non-CC lineages.
(A) Pyramid of multiple traits that CC lineages share with non-CC lineages, (B) phylogenetic affinities of CC with non-CC lineages in each major bilaterian clade in terms of number of accumulated traits, and (C) the relationship between the number of intermediate and advanced traits in each lineage to show a clear separation of CC and non-CC lineages. The length of each horizontal bar in A represents the total number of lineages that share a given body, sensory, brain, motor, or behavioral/cognitive traits, the latter of which include central place foraging (CPF), and unlimited associative learning (UAL) abilities. For multiple lineages with the same number of intermediate or advanced traits in C, trait numbers have been displaced by a small fraction on either the x- or y-axis to separate individual data points. Within the non-CC cluster, Onychophora (On) has the highest number of intermediate traits, whereas Cnidaria (Cn) and Echinodermata (Ec) are the two phyla with one advanced trait. The dashed line in C is a curvilinear fit (a running average) to the data.

CC lineages clearly outstrip non-CC lineages in terms of total number of traits, as well as the number of traits in each category (Fig. 3B). As might be expected, non-CC lineages with close phylogenetic affinities with CC lineages have greater numbers of total shared traits than other non-CC lineages in the same clade (bracketed groups in Fig. 3B). These include sister groups to Chordata, Mollusca and Euarthropoda (Echinodermata, Annelida, and Onychophora, respectively)(Fig. 1).
When the number of intermediate traits is plotted as a function of the number of advanced traits for each lineage, three trends emerge (Fig. 3C). First, CC lineages can be easily distinguished from the vast majority of non-CC lineages. Although the number of both advanced and intermediate traits contribute to the separation, the number of intermediate traits vary widely among non-CC lineages, whereas the number of advanced traits provide the clearest separation between CC and non-CC lineages. Second, Annelida stands out as a phylum that is somewhere in between CC and non-CC lineages. Third, the relationship between the number of intermediate and advanced traits across lineages is curvilinear rather than linear. The curvilinear relationship is indicative of a cumulative process in which lineages tend to accumulate intermediate traits before acquiring advanced traits. Exceptions include cnidarians and echinoderms, each acquiring one advanced trait without having acquired all intermediate traits (see Section 5 for further discussion of these outliers). Finally, the appearance of more complex behavioral (e.g., central place foraging) and learning traits (unlimited associative learning, UAL) at the top of the pyramid suggest that a combination of several body, sensory, brain and motor traits, and not just one (as found in echinoderms and cnidarians), are pivotal to more complex behaviors and cognitive abilities.
A very interesting and somewhat unexpected finding is that Annelida stands out as sharing more advanced (4 out of 9) and intermediate (11 out of 11) traits with CC lineages than any other non-CC phylum (Fig. 3). As such, animals in this phylum can be thought of as being either on the evolutionary cusp of acquiring the full set of advanced traits, or on the tail end of a regressive loss of these traits, ideas that we explore in Sections 3C and 5. In any event, the ability of these traits to identify outliers like annelids gives us confidence that the distribution outcome was not entirely constrained by our trait selection criteria and working premises, and that the multi-trait analysis is capable of revealing surprises.
2B. The relevance of pivotal traits to active visual sensing and visuomotor control
Among advanced traits is a subset of non-cognitive traits that align with advanced behavioral/ cognitive traits in CC lineages (Fig. 3A) and that we call ‘pivotal’ because of their potential for providing a neural and sensorimotor foundation for the emergence of complex cognition. Pivotal traits (flexible limbs, high resolution eyes, laminated brain structures, high-speed locomotion, eye mobility and 3D rotational senses) can be functionally united in terms of their involvement in active visual sensing. Active sensing can be defined as the use of behavior (motor outputs) to acquire or modulate sensory information (Stamper et al., Reference Stamper, Madhav, Cowan, Fortune, Carlson, Sisneros, Popper and Fay2019). It is fundamental to theories of how cognition emerges from the interactions of an animal with its own environment (Llinas, Reference Llinas and The2001; Varela et al., Reference Varela, Thompson and Rosch2018), and has long been recognized as an important strategy for acquiring information (Gibson, Reference Gibson1950, Reference Gibson1962; von Holst & Mittelstaedt, Reference von Holst and Mittelstaedt1950; Brembs, Reference Brembs2009; Schroeder et al. Reference Schroeder, Wilson, Radman, Scharfman and Lakatos2010; Egelhaaf et al., Reference Egelhaaf, Boeddeker, Kern, Kurtz and Lindemann2012).
Some animals, like echolocating bats and dolphins (Au and Simmons, Reference Au and Simmons2007), or electro-locating fish (Nelson and MacIver, Reference Nelson and MacIver2006), use specialized motor systems for producing a specific stimulus energy, in these examples, high frequency sounds and low-frequency electric fields, for the purpose of probing the environment. But for most animals and for visual senses, in particular, active sensing involves the movement of the head, body or eyes to modify sensory feedback. The swimming or flying motions of fish and insects, for example, produces a form of visual feedback (sensory reafference) known as optic flow, which can be used in closed-loop fashion to guide animals through cluttered environments or with respect to each other in a school of fish or a swarm of bees. Similarly, the independent movement of the head or eyes can be used in task-specific ways to e.g., track a moving prey, search for an item of interest, reach for, grasp or manipulate an object, or extract specific information, such as motion parallax cues for depth perception (Horridge, Reference Horridge1986). Head and eye movements can also be used to redirect attention (visual gaze) to novel stimuli or items of particular salience, such as predators or prey. Accordingly, the design of visual processing regions, like first order, laminated visual regions (a pivotal brain trait), is heavily influenced by the tight coupling between vision and behavior (Zeil et al, Reference Zeil, Boeddeker and Hemmi2008) (see also Appendix C on visuomotor pathways for different behaviors).
Perhaps somewhat surprisingly, the primary and likely first function of mobile eyes was not to track moving objects or direct attention to them, but rather to prevent object images from blurring when animals rapidly move their head or body (Walls, Reference Walls1962; Land, Reference Land1999, Reference Land2019). As Walls (Reference Walls1962) so aptly put it, “the original function of eye muscles was not really to move the eye but rather to hold it still with respect to the environment”. Since images produced by low-resolution eyes are already crude, image blur is primarily a problem for animals with high-resolution vision, and these animals use very similar strategies to prevent image blur (Land, Reference Land2019). They use body motion sensors, like the three-dimensional rotational accelerometers found in the semicircular canals of both vertebrates and cephalopod mollusks, to trigger compensatory eye movements for reflexively opposing the visual effects of turning the head or body (Land, Reference Land2015, Reference Land2019) (see Appendix B: Sensory traits).
As the above discussion reveals, active visual sensing relies on many elements, including high-resolution eyes capable of detecting objects, compensatory eye movements to prevent image blur, and motion sensors to trigger compensatory eye movements. In addition, first order, laminated visual structures in the brain extract the relevant spatiotemporal features that are necessary for object detection in the first place and that allow animals to detect relative movement and movement direction between self and an object of interest (see Section 2D). Finally, the capacity for high-speed locomotion frames the adaptive significance of compensatory eye movements in animals with high-resolution vision.
The importance of these combined pivotal traits to active visual sensing has profound implications, as active sensing also enhances learning abilities, fundamental to the evolution of cognitive complexity (Ginsburg and Jablonka, Reference Ginsburg and Jablonka2021). Animals in control of incoming sensory information learn more quickly than those that passively receive it (Brembs & Heisenberg, Reference Brembs and Heisenberg2000; Wolf & Heisenberg, Reference Wolf and Heisenberg1991). As but one example, active visual sensing is critical to the developmental learning abilities of human infants, who often manipulate the apparent size or position of an object within their central field of view, either by moving closer to the object or by repositioning the object closer to them (Suanda et al, Reference Suanda, Barnhart, Smith and Yu2019; Yu and Smith, Reference Yu and Smith2012).
With respect to learning, adaptive filter architectures (an intermediate brain trait, nominally shared with only two other non-CC phyla) are integral to active sensing (Fig. 3A). Adaptive filter networks use continuous sensory feedback generated by body movements to build knowledge and expectations (i.e., to learn) about the consequences of an animal’s own actions, making it easier for them to predict the consequences of future actions (Montgomery & Bodznick, Reference Montgomery and Bodznick2016, see also Appendix B: Brain traits).
2C. The significance of high-resolution eyes and first-order processing areas
Distal sensing and ‘true’ eyes are often linked together as key traits in the evolution of mind and complex cognition (Llinas, Reference Llinas and The2001; Godfrey-Smith, Reference Godfrey-Smith2020; Trestman, Reference Trestman2013; Feinberg and Mallatt, Reference Feinberg and Mallatt2018; Ginsburg and Jablonka, Reference Ginsburg and Jablonka2019, Reference Ginsburg and Jablonka2021). However, there are a number of reasons for thinking that distal sensing is not the only, or even most important advantage of ‘true’ (image-forming) eyes. One, several other senses – long-range olfactory and auditory senses, as well as short-range flow senses - provide animals with the ability to sense stimulus sources at a distance (see Appendix B: Sensory Traits). Two, since animals in many lineages possess multiple forms of distal sensing, distal sensing per se is not a characteristic that can distinguish CC from non-CC lineages. Three, image-forming eyes can be either low- or high-resolution. Although low-resolution eyes might enable animals to detect a suitable habitat at some distance away, high-resolution eyes can do considerably more, such as determine the identity and direction of a small moving object (Nilsson, Reference Nilsson2009). Four, depth perception based on stereopsis and binocular disparities between the two eyes is possible for animals with frontal vision like cats and primates, but for many others, even those with forward-looking eyes, binocular depth perception is not possible (Martin, Reference Martin2009; Land, Reference Land2019). In fact, the octopus, perhaps the most cognitively complex of all invertebrates, relies on monocular vision (Pungor and Niell, Reference Pungor and Niell2023). Thus, many species, even if they have high-resolution vision, cannot gauge distance unless motion cues are generated, either by the movements of the receiver or the stimulus source moving closer to or further away from the receiver (Kral, Reference Kral2003).
In short, distal sensing by image-forming eyes likely provided an adaptive advantage, but only with the aid of motion. Thus, we propose that the pivotal importance of ‘true’ (image-forming) eyes to cognition was not so much in terms of distal sensing abilities, but in terms of object vision and active sensing abilities, and the information processing demands that high- (but not low-) resolution eyes place on first-order visual processing areas in the brain. According to Nilsson (Reference Nilsson2013), the information processing demands of high-resolution eyes is approximately three orders of magnitude higher than those imposed by low-resolution eyes and four to eight orders higher than those imposed by non-imaging photoreceptive organs. Thus, first-order visual structures can be seen as complex brain structures that have evolved in parallel with the high processing demands of complex (high-resolution) eyes. Seen in this light, information-processing demands depend less on the complexity of information in the animal’s surrounding environment or the complexity of the problem to be solved, but more on the complexity of sense organs that deliver information to the brain and the complexity of body parts (e.g., flexible limbs) that have to be moved. This bottom-up perspective is at the core of embodied cognition (Pfeifer et al, Reference Pfeifer, Iida and Lungarella2014).
In this regard, the computational power of the vertebrate retina and the optic lobes of euarthropods and cephalopod mollusks, is nothing short of remarkable (Gollisch & Meister, Reference Gollisch and Meister2010). These laminated structures consist of several cell layers, beginning with a layer of photoreceptive cells and ending with a layer of efferent cells that send their ultimate computational results to mid- and high-level motor centers in the motor hierarchy (Fig. 4). Efferents form two major visuomotor pathways in the brains of CC lineages that, among other things, underlie fundamentally different types of orienting behaviors and cognitive abilities (Section 8; Appendix C.2). As the information travels to higher brain centers, the projections typically remain in retinotopic register, preserving the spatial structure of peripheral maps at each processing station along each of the two pathways.
Laminated visual centers that preserve the spatial order of photoreceptive inputs as retinotopic maps and that use parallel processing in different layers to extract different spatiotemporal features of high-resolution visual inputs. Projections from efferent neurons follow two major pathways that culminate in mid- (yellow) and high-level (blue) motor regions in vertebrate, euarthropod and cephalopod mollusk brains. Layers include the photoreceptive layer (red), intermediate processing layers of interneurons with lateral interconnections (blue) and efferent layers (green). Efferent cell layers provide the main outputs to other regions of the brain. Inspired by the text and figures in Sanes & Zipursky (Reference Sanes and Zipursky2010).

Laminated structures support multiple parallel but interacting subsystems (local circuits) that extract different salient features for directing biologically relevant behaviors (Fig. 4) (Sanes and Zipursky, Reference Sanes and Zipursky2010). The mammalian retina, for example, has at least 15 distinct efferent neurons (retinal ganglion cells), each of which encodes a different feature (Gollisch & Meister, Reference Gollisch and Meister2010; Masland, Reference Masland2001; Wassle, Reference Wassle2004). Examples of features that are extracted by local circuits in the retina and optic lobes of CC animals include: (1) light/dark edges and object boundaries, (2) polarized light directions, (3) different directions of narrow-field (small object) motion, (4) different translational (fore/aft, left/right and up/down) and rotational (pitch, roll and yaw) directions of wide-field (optic flow) motion, (5) the motion of approaching objects, (6) trajectories of objects in motion, and (7) missing, but anticipated elements in a spatiotemporal series of visual events (the so-called omitted stimulus response) (Gollisch & Meister, Reference Gollisch and Meister2010; Krapp, Reference Krapp, Bleckmann, Mogdans and Coombs2014; Wiederman et al., Reference Wiederman, Fabian, Dunbier and O’Carroll2017; Cheong et al, Reference Cheong, Siwanowicz and Card2020).
Our interpretation is that local circuits underlying features 1, 3, 5 and 6 function as elements involved in the identification and classification of objects. Features 6 and 7 are crucial components of, and precursors to advanced cognitive abilities related to anticipation and future planning. Feature 4 additionally plays a role in cognitive constructs of self by providing visual reafferent (optic flow) information on self-directed motions. Finally, motion direction, whether it is the direction from which a small entity enters the visual field, the direction of global optic flow as animals swim or fly through the environment, or the predicted direction of an object already in motion, is a common theme to features 3 – 6. None of these features could be extracted if it were not for retinotopic (or more generally, topographic) maps that preserve the spatial order of photoreceptor inputs in all three CC lineages. These maps are created in the sensory periphery by the physics of how lenses refract and direct light onto photoreceptor arrays, but they are often preserved at higher brain levels of the motor hierarchy, especially mid-level centers in the visuomotor hierarchy that direct egocentric orienting behaviors (Fig. 4, see also Appendix C.2).
Feature extraction is fundamental to object detection and thus, to intentionality, the ability to perceive, learn about, or conceptualize compound objects (Ginsburg and Jablonka, Reference Ginsburg and Jablonka2019). Feature extraction also reduces redundancy and noise. By extracting spatiotemporal features that are essential to the animal’s survival, laminated structures whittle down incoming information into a more manageable subset of efferent outputs that can be more efficiently processed by higher brain centers (e.g., Atick and Redlich, Reference Atick and Redlich1990). Some efferent neurons even rely on a form of predictive coding, which arises from lateral inhibitory circuits, and that suppresses predictable features, while also enhancing novel and unexpected information (Hosoya et al., Reference Hosoya, Baccus and Meister2005; Johnston et al., Reference Johnston, Seibel, Darnet, Renninger, Orger and Lagnado2019; Srinivasan et al., Reference Srinivasan, Laughlin and Dubs1982).
It is often argued, for good reason, that advanced cognitive abilities rely on higher-order brain regions, such as the cerebral cortex in humans (Rakic, Reference Rakic2009; Hofman, Reference Hofman2019). However, here we see how low-order visual areas can have a huge impact on the cognitive capacity of higher order brain regions. Not only do they extract spatiotemporal features that enable object and motion vision, but they also provide rudimentary predictive abilities, a key theme of complex cognition, as well as a key operating principle of the brain (Clark, Reference Clark1999; Emery & Clayton, Reference Emery and Clayton2004; Hull, Reference Hull2020; Llinas, Reference Llinas and The2001; Trestman, Reference Trestman2023).
2D. Pivotal traits: Laying the groundwork for complexly active bodies
Trait distributions identified in this study both confirm and augment the suite of body, sensory and motor traits hypothesized by Trestman (Reference Trestman2013) to be uniquely important for complexly active bodies. Trestman’s suite included (1) appendages with several degrees of freedom, (2) distal senses (e.g., true eyes) and (3) the motor capacity for manipulating objects. The proposed thread binding all these traits together was a capacity for fine, sensorimotor (and brain) control of goal-directed movements of the body and various body parts (e.g., legs, fins, chelipeds, mouthparts etc.) These traits are very similar in principle, if not identical, to four of the current study’s traits - two distributed as advanced/pivotal traits (flexible limbs and high-resolution eyes) and two as intermediate traits (3D mobility and object manipulation) (Fig. 3A).
Augmenting the originally hypothesized traits are several additional pivotal traits (3D body motion sensors, laminated, retinotopically organized visual centers in the brain, and motor capacities for mobile eyes and high-speed locomotion). As discussed in Sections 2B and C, all of these pivotal traits interact in ways that are critical to active visual sensing and the visuomotor control of body actions. Thus, they produce the physical and cognitive capacity for object-oriented and spatially complex actions in three dimensions. As such, we regard pivotal body, sensory, brain and motor traits as the ‘tipping points’ on the pyramidal groundwork that enabled animals in CC lineages to transition from slow and largely reactive motion in two dimensions to rapid and more proactive motion in three dimensions.
3. A multi-trait, transitional framework for understanding the evolution of brains and cognition over time
In order to better understand how brains and cognition evolve, we provide a hypothetical framework of multi-trait transitions along the ‘road to complex cognition’, divided into five parallel tracts – body, sensory, brain, motor and behavioral/cognitive (Fig. 5). In thinking about the relationship of these five tracts, motor traits should be regarded as indicators of the motor capacities enabled by body, sensory and brain traits. The fifth tract should be regarded as the cognitive and behavioral correlates of these sensorimotor abilities. The framework is also divided into five inter-transitional levels of complexity, each of which corresponds to a different combination of multiple traits leading to different behavioral and cognitive outcomes. The combined traits at the highest level of complexity (Level 4) are informed by the unique combination of traits identified as advanced in CC lineages (Fig. 3A), whereas those at lowest level are anchored by the primitive traits of the earliest metazoans, representing ground zero in terms of complexity (Level 0). Thus, each inter-transitional stage represents an increasing level of complexity, ranging from 0 to 4.
Hypothetical framework for understanding the cognitive and behavioral outcomes of different combinations of body, sensory, brain and motor traits. Each row in the two-dimensional framework represents a different level of complexity determined by the combination of traits, whereas each column depicts transitions in the level of complexity over time for each parallel tract. See Table 2 for criteria that distinguish photoreceptor classes (I – IV) in the sensory tract, section 4E for a description of parameters in the motor tract (motor distance, MD and sensory distance, SD), and section 6B and Appendix B for details on non-associative (NA), limited associative (LA) and unlimited associative (UAL) learning abilities as cognitive traits.

Multi-trait transitions are organized around key changes in body plan traits (orange tract in Fig. 5), which are then hypothetically linked to other traits and trait transitions in the sensory, brain and motor tracts. Given the apparent importance of high-resolution eyes and laminated visual regions in the brain (Fig. 3A), vision is the focal point of the sensory tract and a major organizational construct. It revolves around the classification scheme of Nilsson (Reference Nilsson2009, Reference Nilsson2013) in which visual traits are categorized according to their functional capacities, based on discrete anatomical criteria, but also and perhaps most importantly, on their cognitive (informational) and behavioral relevance (Table 2). The beauty of this classification scheme is that each successive class of photosensors can be regarded as cumulative building blocks in the evolution of complex eyes and visual capabilities in both vertebrate and invertebrate lineages (Nilsson, Reference Nilsson2022).
Characteristics of different classes of light-sensitive organs (after Nilsson, Reference Nilsson2009, Reference Nilsson2013).

3A. The trait-linkage hypothesis
The hypothetical framework of Fig. 5 suggests several testable hypotheses. One is that there is a general tendency for certain traits to be linked together in time to produce different levels or permutations of cognitive and behavioral complexity. A corollary of this hypothesis is that transitions in one trait tract (e.g., from low- to high-resolution eyes in the sensory tract) are loosely linked in time to transitions in parallel tracts (e.g., from unlaminated to laminated visual regions in the brain tract and from unjointed to jointed/flexible limbs in the body tract). If traits and trait-transitions are indeed linked, one would expect to find different levels of complexity, defined by a distinct combination of traits, in different groups of animals. Table 3 provides preliminary evidence of how body, visual and brain traits are linked at different complexity levels in several subphylum taxa (classes) of animals in both CC and non-CC lineages (see Sections 6D and 7C for further details). Table 3 also lends further support to our decision to treat cephalopod mollusks (complexity level 4) as a CC lineage that is separate from other non-CC mollusk classes like Gastropoda (level 3) or Polyplacaphora and Bivalvia (level 1), and likewise, our decision to lump all three major euarthropod clades into a single CC lineage (complexity level 4) at the phylum level.
Animal classes that have body, visual and brain traits at the same level of complexity. Body traits - striated muscle (SM), nerve tissue/system (NS), bilateral symmetry (BS), paired appendages (PA), and flexible limbs (FL). See Table 2 for visual traits

3B. Evolutionary scenarios for the multi-trait framework
How well does the multi-trait framework of Fig. 5 fit with the current evidence and hypotheses of how various traits evolved in different animal groups? The evolution of the brain and nervous system is currently viewed through the lens of two competing hypotheses. One is that complex brains in CC lineages had a single (monophyletic) origin – that is, they were inherited from a single, common bilaterian ancestor (the bilaterian node in Fig. 1)(Hirth, Reference Hirth2010; Holland et al., Reference Holland, Carvalho, Escriva, Laudet, Schubert, Shimeld and Yu2013). The competing hypothesis is that complex brains in CC lineages had multiple (polyphyletic) origins (Moroz, Reference Moroz2009, Reference Moroz2015). Depending on the relative position of sponges and ctenophores (comb jellies) on the phylogenetic tree, neurons and the nervous system are also thought to have had either a monophyletic or polyphyletic origin (Moroz, Reference Moroz2009; Liebeskind et al, Reference Liebeskind, Hillis, Zakon and Hofmann2016).
The multi-trait framework cannot resolve the issue of monophyletic vs polyphyletic origins of brains or nervous systems, but it can be applied to both scenarios. To illustrate this point, we assume that sponges (Porifera) are the sister group to the common ancestor of all other phyla, as shown in Fig. 1, and that the nervous system evolved only once from this common ancestor. The mixed mono/polyphyletic scenario depicted in Fig. 6 thus illustrates a monophyletic origin of foundational traits, such as neurons (after transition 1) and bilateral symmetry (after transition 2), followed by a polyphyletic origin of intermediate and advanced traits, such as paired appendages after transition 3, and complex sensory (high-resolution eyes) and brain features (laminated visual structures) after transition 4. This mixed scenario may or may not turn out to be correct, but it is consistent with the current thinking on the polyphyletic origin of image-forming eyes (Nilsson, Reference Nilsson2009; Gehring, Reference Gehring2014).
Mixed mono- and polyphyletic scenarios for how CC and non-CC lineages may have transitioned from one level of multi-trait complexity to the next, with each level of complexity being the outcome of one of four transitions (see Table 3 for levels of complexity exemplified by different lineages). Complexity levels ascribed to each lineage (in parentheses) are based on the information in Table 3. Scenario in A illustrates the parallel pathways followed by all three CC lineages, resulting in the progressive addition of traits that are accumulated over each of four transitions to produce increasing levels of complexity, culminating in complexity level 4, as illustrated in Fig. 5. Scenario B illustrates how the ancestors of some non-CC lineages may have reached CC status in the same way as CC lineages, but with subsequent loss of advanced traits later in time, resulting in a reverse transition from complexity level 4 to 3. Scenario C depicts progressive addition of traits, but with different non-CC lineages completing less than four transitions. Note that phyla at lower complexity levels, such as Tardigrada and Onychophora, could have theoretically attained their current level of complexity (in this case, level 3) by either failing to complete all transitions, as illustrated in C, or by regressive losses (transition reversals), as illustrated in B.

Figure 6 also illustrates the while all three CC lineages completed the last of several transitions to acquire advanced traits (Fig. 6A), many non-CC lineages did not (Fig. 6C). Some may have initially followed similar paths leading to the acquisition of advanced traits, only to lose all (e.g., Tardigrada, Fig. 6B) or only some of them later on (e.g., Annelida, see Section 3C). Others completed none (e.g., Porifera), one (e.g., Ctenophora), two (e.g., Rotifera) or three (e.g., Onychophora) transitions to acquire different numbers of foundational and intermediate traits, but no advanced traits (Fig. 6C).
As Fig. 6A illustrates, all three CC lineages appear to follow the same general progressive sequence of transitions to acquire advanced traits. However, this does not mean that they completed the sequences during the same time period or that transitions were always stepwise. For example, the path from less to more complex body traits (limbless to flexible limbs) in euarthropods appears to involve a discrete intermediate step involving the acquisition of unjointed limbs (Transition 3) before the transformation to jointed limbs (transition 4)(see Sections 4C and D). A similar, stepwise path to flexible limbs is less clear for vertebrates and cephalopod mollusks (see Section 4D). Moreover, it seems that euarthropods acquired their flexible limbs much earlier than either vertebrates or cephalopod mollusks (see Section 4D). These examples are a stark reminder that evolutionary histories are varied and determined by a complicated set of interacting factors that we don’t yet fully understand.
Nevertheless, we think the two-dimensional framework of Fig. 5 is a useful construct. It should not be interpreted as an orderly, one-way road map that describes the evolutionary history (path taken) of all lineages, but rather as an overall framework from within which the evolution of brains and cognitive abilities can be understood in terms of an interaction of multiple traits. This interaction produces increasing levels (or different permutations) of complexity that roughly unfold in the same sequence to produce cumulative effects in many, if not all lineages. The framework also suggests that multiple traits are linked and that certain combinations of traits are more frequently expressed than others (see Section 7C, Table 3).
3C. Selection factors and constraints in the evolution of pivotal traits
What selection factors might be operating in the evolution of multiple pivotal traits in the three CC lineages? Since most, if not all, pivotal traits appear in the fossil record by the end of the Cambrian (Fig. 7; Trestman Reference Trestman2013), the Cambrian explosion is highly relevant. The Cambrian explosion is perhaps best characterized as a rapid increase in the number of different body forms, which gave rise to all of the known phyla of today. But as Trestman (Reference Trestman2013) points out, it also describes a rapid increase in the complexity of body features, such as articulated appendages, multi-faceted eyes, and even differentiated brain structures, as evidenced from the fossil record (Fig. 7, Section 4D).
Evolutionary timeline for some of the key traits and events discussed in this paper.

Suffice-it-to-say, many factors, interacting in complex ways, likely triggered or fueled the Cambrian explosion (reviewed by Smith and Harper, Reference Smith and Harper2013). These include abiotic factors, such as increasing levels of available oxygen and ambient light, a rising sea level and global warming, as well as biotic factors like the advent of bilateral symmetry, the emergence of complex food webs, and an escalating arms race involving the coevolution of predators and prey.
So, how does body complexity fit into this overall picture? Parker (Reference Parker2003) argued that complex, image forming eyes were key factors in the Cambrian explosion, rapidly increasing the visual abilities of early euarthropods, fueling or even triggering the arms race. As Shubin, Tabin and Carroll (Reference Pungor and Niell1997) so cleverly put it, however, the ‘arms’ race could also be regarded as a ‘limbs’ race to build better (more flexible and varied) appendages for multiple purposes. Needless-to-say, eyes and limbs function together as an integrated whole in visually guided behaviors. In this respect, Trestman (Reference Trestman2013, Reference Trestman, Andrews and Beck2018) proposed that the brain’s ability to extract spatiotemporal features of the visual world transformed the evolution of limbs and other active body parts in a distinctive way. Without sufficient sensory information and brain capacity to guide them, flexible limbs would have been of little functional use for complex, three-dimensional motion. Once these abilities were acquired, the adaptive value of flexible limbs (and variations in their morphology) for a wide variety of other, spatially complex tasks (e.g., grasping and manipulating objects) would have increased, leading to increased diversification of active body parts and speciation, a pattern clearly observed in Cambrian arthropods, and in the subsequent evolutionary radiations of vertebrates and cephalopods.
The evolution of pivotal traits is also constrained by the laws of physics and gene regulatory networks. As but one example of the former, physical principles constrain the ways in which light rays from different directions can be focused and redirected onto photoreceptor arrays to form visual images, with lenses being by far the most commonly adopted solution in the animal kingdom (Land, Reference Land2012). In contrast, gene regulatory networks constrain body plans by controlling the developmental processes, including the differentiation of the body along different body axes, as well as different internal tissue organizations like brains and exterior body parts, including heads, trunks and limbs (Carroll, Reference Carroll2008).
It now appears that much of the regulatory genome pre-dates the origin of bilaterian clades, appearing as early as almost a billion years ago (Erwin, Reference Erwin2020)(Fig. 7), suggesting that all phyla inherited very similar, if not identical genetic toolkits. Limb development, for example, appears to be controlled by the same gene regulatory networks in both vertebrates and invertebrates (Panganiban et al., Reference Panganiban, Irvine, Lowe, Roehl, Corley, Sherbon, Grenier, Fallon, Kimble, Walker, Wray, Swalla, Martindale and Carroll1997; Pueyo & Couso, Reference Pueyo and Couso2005; Shubin et al., Reference Pungor and Niell1997; Tarazona et al., Reference Tarazona, Lopez, Slota and Cohn2019), as does eye development (Halder et al., Reference Halder, Callaerts and Gehring1995; Gehring, Reference Gehring2004, Reference Gehring2011; Fernald, Reference Fernald2006; Vopalensky and Kozmik, Reference Vopalensky and Kozmik2009; Joly et al. Reference Joly, Recher, Brombin, Ngo and Hartenstein2016). Moreover, the eye toolkit not only regulates eye morphogenesis, but also that of nearby structures, including the head and target neuropils in the brain, ensuring that all these bits and pieces are developed in proper relationship to one another (Gehring, Reference Gehring2004, Carroll, Reference Carroll2008, Shubin et al, Reference Shubin, Tabin and Carroll2009; Joly et al., Reference Joly, Recher, Brombin, Ngo and Hartenstein2016). Finally, shared gene regulatory networks control the organization and development of different brain regions, structures and even corresponding circuitries, resulting in functional similarities between several vertebrate and invertebrate brain regions (Tomer et al., Reference Tomer, Denes, Tessmar-Raible and Arendt2010; Strausfeld and Hirth, Reference Strausfeld and Hirth2013; Wolff and Strausfeld, Reference Wolff and Strausfeld2015; Bridi et al., Reference Bridi, Ludlow, Kottler, Hartmann, Vanden Broeck, Dearlove, Göker, Strausfeld, Callaerts and Hirth2020)(see Appendix A).
Genetic mechanisms can also explain how some Annelids have come to have some, but not all advanced traits (Fig. 3). Fossil annelids (∼500 mya) appear to have had more complex neuroanatomical features than some of their more modern descendants, indicating that the nervous system was subsequently reduced several times over millions of years (Heuer et al., Reference Heuer, Müller, Todt and Loesel2010; Parry and Caron, Reference Parry and Caron2019). According to Isaeva and Rozhnov (Reference Isaeva and Rozhnov2021), regressive loss of traits via loss of individual genes, most notably Hox genes, is rather common among Metazoans. The simplification of non-CC tardigrade and nematode body plans (including the brain) is another putative example of trait loss due to the loss of Hox genes (Smith et al., Reference Smith, Boothby, Giovannini, Rebecchi, Jockusch and Goldstein2016; Minelli, Reference Minelli and Wanninger2015; Sommer, Reference Sommer and Wanninger2015; Isaeva and Rozhnov, Reference Isaeva and Rozhnov2021). Finally, secondary loss of advanced traits can even occur within CC lineages – the loss of limbs in snakes and many other vertebrate classes (Lande, Reference Lande1978), for example, or the loss of eyes/vision in both invertebrate and vertebrate species that inhabit dark environments like the deep sea, subterranean caves or underground burrows (Sumner-Rooney, Reference Sumner-Rooney2018).
4. A story of evolutionary transitions over time
To illustrate the plausibility of our multi-trait framework, we provide a ‘just-so’ story to fill in some of the needed details for a fuller understanding of Fig. 5. It is inspired by the ideas of many who have written about the evolution of mind (e.g., Llinas, Reference Llinas and The2001; Godfrey-Smith, Reference Godfrey-Smith2020; Ginsburg and Jablonka, Reference Ginsburg and Jablonka2021) and eyes (Land, Reference Land2015, Reference Land2019; Nilsson, Reference Nilsson2009, Reference Nilsson2013, Reference Nilsson2022). Where possible, we provide concrete examples and supporting evidence from the fossil record. However, this story is not meant to be, nor can it be, correct in every detail.
4A. Transition 1: From undifferentiated tissues to differentiated nerve and muscle cells
The development of specialized nerve cells (neurons) for inter-cell communication and a nervous system of interconnected neurons is widely held to be a key innovation in metazoan evolution (Nielsen, Reference Nielsen2008) - one that enabled major advances in the way that information is encoded, transmitted, processed and used in the guidance of behavior. In essence, neurons function as analog-to-digital-to-analog converters, with input and output regions (the dendrites and axon terminal, respectively) having analog properties. Analog properties enable fine-scale integration of different inputs and likewise, outputs that can vary continuously in strength. Between input and output regions of the neuron is a single transmission line (axon) that supports all-or-none action potentials, a digital signal with temporal coding properties that propagates over long distances without degradation in strength. Regardless of whether the nervous system arose only once or multiple times (see Section 3B), the remarkable appearance of the polarized (one-way transmission of information) neuron with its combined analog and digital features had a major impact on the ability of animals to acquire and process information.
In parallel with the development of neurons was the development of striated muscle, although there is some controversy as to exactly when and how many times it arose (Burton, Reference Burton2008; Seipel and Schmid, Reference Seipel and Schmid2005; Steinmetz et al., Reference Steinmetz, Kraus, Larroux, Hammel, Amon-Hassenzhal, Houlistone, Wordheid, Nickel, Degan and Technau2012). Striated muscles have two important properties. One is that they are capable of rapid contraction and the second is that they depend on nerve stimulation for contraction, opening the door for rapid, but finely controlled, muscle-powered movements. Before the advent of muscle-based locomotion, animals relied on relatively slow and cumbersome ciliary or flagellar mechanisms, but as Biewener & Patek (Reference Biewener and Patek2018) put it, the capacity for animal motion “exploded” when actin and myosin were assembled into striated muscle cells.
Shortly after or concomitant with the advent of neurons and striated muscles, neurons became further differentiated into different neuron types, each for a dedicated function, consistent with the idea of a nervous system, rather than just one or two isolated nerve or sense cells. Neurons can be broadly classified into three types: (1) specialized sensory neurons (e.g., photoreceptors) for transducing stimulus energy (light, sound etc.) into the electrochemical currency of neuron language, (2) motor neurons for controlling the timing and amplitude of muscle cell contractions, and (3) interneurons for integrative handshaking between sensory and motor neurons.
Before specialized neurons, sensorimotor integration was strictly intracellular (Gehring, Reference Gehring2014; Randel & Jékely, Reference Randel and Jékely2016), as is still evidenced in the photoreceptive cells of extant sponge and cnidarian larvae (Gühmann et al., Reference Gühmann, Jia, Randel, Verasztó, Bezares-Calderón, Michiels, Yokoyama and Jékely2015; Kojima et al., Reference Kojima, Terakita, Ishikawa, Tsukahara, Maeda and Shichida1997). Interneuron populations in the distributed nervous systems of non-bilaterians were probably small, functioning as low-level controllers in the sensorimotor control and guidance of simple behaviors. The potential for mid- and high-level motor controllers (and thus multi-stage motor hierarchies) (Fig. 3; Appendices A and B) would not appear until brains were formed and further differentiated.
As neurons differentiated into different neuron types, individual photoreceptors were likely being organized into small clusters to form the first multicellular, light-sensitive ‘organs’ but without much directional sensitivity. Classified by Nilsson (Reference Nilsson2009, Reference Nilsson2013) as Class I detectors (Table 2), these rudimentary organs support a few simple abilities, such as the ability to respond to an overhead predator because of the shadow it casts (shadow response), or the ability to move from light to dark areas and vice versa during diel vertical migrations. As a modern-day example, comb jellies (Ctenophora) relying on nondirectional photoreceptors can move from a well-lit area to a darker area, but they do so by increasing overall motor activity (Baiandina et al., Reference Baiandina, Kirin and Krivenko2022), presumably to increase the probability of eventually landing in a darker place.
4B. Transition 2: From non-bilateral to bilateral symmetry
The advent of bilateral symmetry was arguably one of the most consequential steps in metazoan evolution in terms of its impact on animal lifestyle, behavior and other body traits, including the nervous system (Nielsen, Reference Nielsen2008; Erwin, Reference Erwin2020; Manuel, Reference Manuel2009)(see Body traits in Appendix B). Bilateral symmetry resulted in two orthogonal axes of polarity and differentiation – anterior/posterior (head/trunk) and dorsal/ventral (back/belly). These, in turn, enabled three other parallel transitions: (1) a nervous system transition from brainless, distributed nerve nets to a central nervous system (CNS) with a bilaterally-symmetric brain in the head and nerve cord/s down the body, (2) a sensory transition from widely-distributed sensors (or sense cells) around the body circumference to clustered, typically bilaterally-paired sensors on the head and (3) a locomotor transition from unpolarized directions of locomotion with respect to the main body axis to headfirst movements aligned with the longitudinal body axis. With little evidence for bilateral animals much before the Cambrian (Degan et al, Reference Degan, Isozaki, Xingliang, Jian and Maruyama2014), bilateral symmetry and associated traits likely played a critical role in the rapid diversification of bilaterian lineages during the Cambrian explosion (see Section 3C).
There are many reasons for treating bilateral symmetry, along with associated traits, as foundational building blocks in the evolution of advanced cognitive abilities, as argued previously by others (e.g., Llinás, Reference Llinas and The2001; Godfrey-Smith, Reference Godfrey-Smith2020; Ginsburg and Jablonka, Reference Ginsburg and Jablonka2021; Barron et al., Reference Barron, Halina and Klein2023). First, a central brain becomes the ‘master controller’ (Barron et al., Reference Barron, Halina and Klein2023) of the body, enabling local control of individual body parts as well as coordinated control of multiple body parts during complex actions. Second, the clustering of sensors on the head (cephalization) sets the stage for animals being able to detect obstacles, habitats or other animals that are in line with their forward motion.
The coupling of forward-looking sensing abilities with polarized (headfirst) locomotion also sets the stage for the evolution of forecasting abilities – i.e., being able to detect things before they are encountered so that plans can be made, in advance, to e.g., engage, avoid or ignore what’s ahead. Bilateral symmetry also confers improved ability to change directions (Hollo and Novak, Reference Hollo and Novak2012). In essence, bilateral symmetry trumps asymmetry and other symmetries in terms of maneuverability, giving animals the enhanced capacity to execute pre-calculated motor plans to avoid or pursue distant targets.
4C.Transition 3: From limbless bodies to bodies with paired appendages
The evolution of muscle-powered, paired appendages gave animals at least three major advantages: (1) a faster mechanism of locomotion, (2) increased overall maneuverability during locomotion via braking and steering actions of appendages, and (3) a modifiable platform for the diversification of appendage functions (see Appendix B). Lobopods, the first paired appendages in euarthropods, date back to the earliest, now extinct Lobopodians (ca.540 mya) (Ortega-Hernández, Reference Ortega-Hernández2015), whereas pectoral and pelvic fins, the first paired appendages in vertebrates evolved with the first jawed vertebrates about a 100 million years later (Brazeau & Friedman, Reference Brazeau and Friedman2015).
At some point in time, multicellular animals must have transitioned from the two-dimensional world of the seafloor biomats during the Ediacaran to a three-dimensional world in the early Cambrian, when the first known pelagic eumatazoans emerged (Shixue et al., Reference Shixue, Steiner, Maoyan, Erdtmann, Huilin, Liangzhong and Weber2007; Vannier et al., Reference Vannier, Garcia-Bellido, Hu and Chen2009) (Fig. 7). A pelagic lifestyle would have placed increased demands on three-dimensional processing of sensory information from both interoceptors (e.g., body motion sensors) and exteroceptors (e.g., eyes). The ability to get off the benthos and maneuver mid-water was likely enabled or at least improved by the development of jet propulsion and appendicular forms of locomotion (see modes of locomotion under motor traits in Appendix B).
With increased locomotion speeds and maneuverability came upgrades in the visual abilities of animals to sense conditions at greater distances and in greater detail. The invagination of photoreceptors into lens-less cups on the skin surface and/or the addition of new structures, like lenses (albeit still unfocused), enabled animals to parse spatial differences in ambient light intensity and thus, to form crude, low-resolution images of large, nearby environmental features (Class III photoreceptors, Table 2). Elaborations of eyes and visual processing regions in the brain were likely accompanied by corresponding elaborations of descending visuomotor pathways and motor hierarchies in the brain (Butler, Reference Butler2000). These elaborations not only allowed animals to avoid obstacles when moving at moderate speeds (see also Section 4E), but also enabled more general forms of visually guided behaviors, including habitat selection (Nilsson Reference Nilsson2013, Reference Nilsson2022). Low-resolution vision also enabled a form of active visual sensing, unlike anything possible with non-imaging eyes, in which animals could control, by their own movements, the flow of incoming sensory information, thereby gaining additional time-dependent information about the features of the surrounding environment and the animal’s own relationship to them (Nilsson, Reference Nilsson2022).
Body movement also produces a form of visual reafference known as optic flow (Krapp, Reference Krapp, Bleckmann, Mogdans and Coombs2014), which greatly enhanced the available sensory information (Brembs, Reference Brembs2009; Egelhaaf et al., Reference Egelhaaf, Boeddeker, Kern, Kurtz and Lindemann2012; Heisenberg, Reference Heisenberg1994) and enabled animals to monitor self-motion (Nilsson, Reference Nilsson2009). Optic flow is the apparent motion of the visual surround when an animal moves relative to a stationary background. It is used as feedback control for closed-loop behaviors (Krapp, Reference Krapp, Bleckmann, Mogdans and Coombs2014; Zeil et al., Reference Zeil, Boeddeker and Hemmi2008) and plays an important role in many different behaviors, especially in flying and swimming organisms that move rapidly through a three-dimensional world. In flying insects, for example, optic flow aids in course correction after being blown off course, in collision avoidance when flying through a cluttered environment (Srinivasan, Reference Srinivasan1992; Srinivasan et al., Reference Srinivasan, Lehrer, Kirchner and Zhang1991, Reference Srinivasan, Zhang, Lehrer and Collett1996), and more generally, in the control of flight speed and various flight maneuvers (e.g., landings) (Linander et al., Reference Linander, Dacke and Baird2015; Mauss & Borst, Reference Mauss and Borst2020). Once sensory feedback is available for monitoring the consequences of an animal’s actions and memories of these consequences can be stored, the stage is arguably set for predicting the consequences of future actions.
Optic flow poses a problem, however, when flying or swimming animals are buffeted about or swept downwind/downstream by wind or water currents. Since the earliest bilaterians were exposed to shifting currents on the seafloor (Darroch et al., Reference Darroch, Rahman, Gibson, Racicot and Laflamme2017), they would have been confronted with the problem of distinguishing between optic flow caused by their own actions and that imposed by the water currents around them. The same is true for body motion detected by inertial sensors. Thus, the selective pressures for developing neural strategies, such as adaptive filters and motor efference copy (also known as motor corollary discharge), to distinguish between self- and exogenously imposed body movements would have evolved (see Appendix B: Brain traits). Neural solutions like these have been proposed as one of the first steps towards body self-awareness (Jékely et al., Reference Jékely, Godfrey-Smith and Keijzer2021; Montgomery & Bodznick, Reference Montgomery and Bodznick2016) and even consciousness (Merker, Reference Merker2005; Vallortigara, Reference Vallortigara2021).
Increased mobility also enhanced depth perception. In fact, many animals, even those with forward-looking eyes and binocular overlap, rely on motion cues for depth perception (see Section 2B). This would certainly have been the case for early euarthropod lineages during the Cambrian explosion, since the fossil evidence indicates that they had laterally placed, widely spaced eyes that were probably incapable of depth perception using binocular overlap. Depth perception cues include changes in the apparent size of an object as the distance between receiver and the object changes, and motion parallax cues in which the images of nearby objects translate faster across the field of view than those of far-away objects when an animal moves. Head bobbing to acquire depth perception cues, for example, is a behavior used by a variety of CC animals, including birds, praying mantises and octopuses (Kral, Reference Kral2003; Mather & Alupay, Reference Mather and Alupay2016; Nyakatura and Andrada, Reference Nyakatura and Andrada2014).
4D. Transition 4: The emergence of flexible limbs
The unjointed appendages (lobopods) of eaurthropod ancestors are thought to have transitioned to jointed legs some 510 – 570 mya (Shubin et al., Reference Pungor and Niell1997). Fossil forms of nectocaridids with body features similar to those of cephalopods, suggest that flexible tentacles in mollusks may have evolved around the same time (∼530 mya) (Smith, Reference Smith2013, Reference Smith2020), potentially from a mobile foot (a creeping pedal sole) from benthic snail-like ancestors (Shigeno et al., Reference Shigeno, Sasaki, Moritaki, Kasugai, Vecchione and Agata2008). However, the affinity of nectocaridids with cephalopods is uncertain, and modern coleoids with internalized shells for increased mobility (squid, octopus, cuttlefish) did not appear until some 100 years later in the mid-Palaeozoic (Kröger et al., Reference Kröger, Vinther and Fuchs2011; Pohle et al., Reference Pohle, Kröger, Warnock, King, Evans, Aubrechtová, Cichowolski, Fang and Klug2022). Add yet another 100 million years or so for the final step in the evolution of flexible vertebrate limbs - the so-called fins-to-limbs conversion during the water-to-land transition.
The evolution of flexible limbs is perhaps the most complicated in vertebrates because it involved several parallel tracts of independent evolution of median unpaired and lateral paired fins, each characterized by increasing degrees of complexity and differentiation (Coates, 1994; Reference Coates2003; Larouche et al., Reference Larouche, Zelditch and Cloutier2017; Stewart et al., Reference Stewart, Bonilla, Ho and Hale2019; Zhikun et al., Reference Zhikun, Qiang, Ferron, Keating, Junqing, Donoghue and Min2022). Lateral paired, pectoral and pelvic fins eventually gave rise to forelimbs and hindlimbs, respectively, and this ‘fins-to-limbs’ conversion just prior to the water-to-land transition (∼360 mya) was the last major step in the evolution of flexible tetrapod limbs (Coates et al., Reference Coates, Jeffery and Ruta2002). Tetrapod forelimbs differ from pectoral fins of primitive aquatic vertebrates in having mobile wrists, ankles and digits. However, the pectoral fin joints in Devonian tetrapod-like fish fossils indicate several degrees of freedom, including rotation, flexion, extension, protraction and retraction (Shubin et al., Reference Shubin, Daeschler and Jenkins2006). Thus, limb flexibility may have been well underway in paired fins before the water-to-land transition that resulted in tetrapod limbs.
The advent of flexible limbs, however or whenever it occurred, was accompanied by the corresponding development of neuromuscular (and in cephalopod mollusks, also hydrostatic) control systems, which together were a transformative innovation that contributed to the incredible success of Euarthropods (Shubin et al., Reference Pungor and Niell1997, Reference Shubin, Daeschler and Jenkins2006; Boxshall, Reference Boxshall2004, Esteve-Altava et al., Reference Esteve-Altava, Pierce, Molnar, Johnston, Diogo and Hutchinson2019) and cephalopod mollusks (Tarazona et al., Reference Tarazona, Lopez, Slota and Cohn2019). In euarthropods, the structurally and functionally diverse antennae, mouth parts, walking legs, swimmerets and grasping appendages were all derived from a basic jointed limb structure that defines the phylum (Shubin et al, Reference Pungor and Niell1997). Although the flexible limbs of cephalopod mollusks and vertebrates may not have diversified into as many structurally different appendages as those found in euarthropods, they were nevertheless multifunctional, being used in locomotion, communication, capturing prey, defensive maneuvers, tactile (and in some cases, chemo) sensing, and grasping, pushing, pulling and otherwise manipulating objects (Kennedy et al., Reference Kennedy, Buresch, Boinapally and Hanlon2020).
The vertebrate jaw, which has been likened to an ‘opposable thumb for your face’ (Jane Sheldon, as quoted in Godfrey-Smith, Reference Godfrey-Smith2020), is a different type of flexible body part capable of complex actions, analogous to the mouth parts that evolved from flexible forelimbs in euarthropods. This important vertebrate innovation, appearing before the final fins-to-limbs conversion, may be particularly useful to vertebrates like fish and birds with forelimbs (fins and wings) that have limited manipulative abilities. New Caledonian crows, for example, use their beaks to manufacture and manipulate tools (Table 1), while some parrots use theirs to grasp tree limbs in a novel form of arboreal locomotion coined ‘beakiation’ (Dickinson et al., Reference Dickinson, Young and Granatosky2024).
With the emergence of flexible limbs came a transition from low- to high-resolution eyes for better visuomotor control of limbs, although it is unclear whether high-resolution eyes or limb flexibility came first. Anamalocaris, a large, free-swimming apex predator (now extinct) dating back to ∼515 mya, had large compound eyes with high-spatial resolution (Paterson et al., Reference Paterson, Garcia-Bellido, Lee, Brock, Jago and Edgecombe2011) and jointed, frontal limbs with high flexibility for grasping prey (Briggs, Reference Briggs1994; De Vivo et al., Reference De Vivo, Lautenschlager and Vinther2021).
In any event, high-resolution eyes, which greatly increased information processing demands (Table 2, Section 2C), would have been accompanied by parallel expansion of brain processing areas, which include the optic lobes of invertebrates and the vertebrate retina. Simple, two or three-layered structures expanded to multi-layered structures with the number of interconnections increasing exponentially, as evidenced in the developing visual system of larval lamprey (Rubinson, Reference Rubinson1990; Suzuki and Grillner, Reference Suzuki and Grillner2018). The expansion to multiple layers would have been accompanied by changes in visuomotor pathways and behaviors, perhaps like those that allow the transition from passive filter feeding in larval lamprey to visually guided, active predation by adults (Rubinson, Reference Rubinson1990). Such an expansion leads to a massive increase in the computational power of these laminated visual regions (Section 2C), perhaps the single most important brain feature to develop on the road to complex cognition.
Low-resolution eyes made visually guided orientation to the environment possible via crude optic flow images. High-resolution vision, especially when coupled with flexible limbs with greater degrees of freedom and range of motion, dramatically increased the diversity, precision and complexity of spatiotemporally controlled, visually guided behaviors. Equipped with local computational networks that encoded features such as object edges and motion direction, animals could now extract salient information from their visual surroundings with greater efficiency (sec. 4.3). They could also better determine the visual consequences of their own movements relative to discrete objects or entities (animate or inanimate). Much of this would not have been possible without the parallel evolution of mobile eyes to stabilize visual images and prevent image blur as animals moved at higher speeds through their environment (Land, Reference Land2015, Reference Land2019). High-resolution vision, aided by both (a) eye mobility and (b) translational and rotational body-motion sensors needed to trigger compensatory movements of the eye (Section 2C), gave animals the newly evolved potential for detecting, discriminating, locating, manipulating or pursuing small targets (objects) of interest. As Nilsson (Reference Nilsson2022) put it, ‘object vision’ gave them a whole ‘new world’.
4E. The interaction of motor and sensory traits in the evolution of proactive behaviors
The transition from colliding into something (no advance planning) to proactively avoiding it (advance planning) likely spans several of the trait transitions covered here and depends heavily on the interaction of motor and sensory factors, as illustrated for active sensing by weakly electric fish (Snyder et al. (Reference Snyder, Nelson, Burdick and Maciver2007). The sensorimotor ability of animals to react to environmental features depends on both the sensing range (how far away features can be detected) and distance range of motion during a single locomotor cycle (e.g., the active burst/passive coast cycle of many swimming animals) before motion is halted by drag or friction (the so-called stopping distance). Although these can be measured as three-dimensional sensory and motor volumes (MacIver & Finlay, Reference MacIver and Finlay2022; Snyder et al., Reference Snyder, Nelson, Burdick and Maciver2007), the ramifications of overlapping and different-sized sensory and motor volumes can best be illustrated for the simplified case of a 2-dimensional, unidirectional motion pathway and sensory range. If the longest distance at which an animal can detect an oncoming feature or obstacle (the sensory distance, SD) is less than the motor stopping distance (MD), the animal will collide with the obstacle (SD<MD, collision mode, prior to Transition 2 in the motor tract of Fig. 5). If the sensory distance is equal to the stopping distance, then the animal can react, but only barely (SD=MD, reactive mode, between Transition 2 and 3 in Fig. 5). But if the sensory distance is greater than the stopping distance, then the animal can act proactively to e.g., put on the brakes and/or turn to avoid collision or encounter (SD>MD, proactive mode after Transition 3 in Fig. 5). In terms of visually guided behaviors, animals with Class I photodetectors are thus stuck in collision mode (unable to avoid obstacles, since they cannot form visual images of either near or far objects). For small animals moving at slow speeds, collisions are not a problem. The same cannot be said for the larger, faster animals that would appear later. This is because the collision force (= mass x acceleration) is much greater for them than for their smaller, slower counterparts. The short-range flow-sensing or electroreceptive abilities of weakly electric fish to detect obstacle-created distortions in their own, self-generated flow or electric field (Windsor, Reference Windsor, Bleckmann, Mogdans and Coombs2013; Snyder et al, Reference Snyder, Nelson, Burdick and Maciver2007) might be good examples of the intermediate reactive mode or a very short-range proactive mode, but long-range, proactive abilities would not have been possible until animals acquired high-resolution, image-forming eyes. Because the transmission of light in air is far greater than that in water, the visual range of animals that made the water to land transition much later in time (see Fig. 7) would become even greater and especially critical to the evolution of vertebrate brains (MacIver & Finlay, Reference MacIver and Finlay2022).
5. Cognitive outliers: Advanced traits in non-CC lineages
A subset of advanced traits can be found in three non-CC phyla. Annelids have one advanced behavioral/cognitive trait (construction behavior), as well as three other advanced traits in sensory (high-resolution eyes), brain (laminated visual regions), and motor (eye mobility) categories. In contrast, cnidarians (e.g., box jellyfish) and echinoderms (e.g., brittle stars) have no advanced traits in the behavioral/cognitive category but one each in either the motor or body category (high-speed locomotion and flexible limbs, respectively). The converse, of course, is that all three of these phyla are missing five or more of the entire set of nine advanced traits. In addition, both cnidarians and echinoderms lack one very important foundational trait: a brain. As a result, cnidarians and echinoderms land in the non-CC cluster of lineages, even though they each possess one pivotal trait (Fig. 3C).
In this regard, it is reasonable to ask if the transitional scenarios depicted in Figs. 5 and 6 can explain the acquisition of advanced traits in these outliers. The answer is a tentative yes for annelids and echinoderms, but a definite no for cnidarians. As discussed earlier (Section 3C) and depicted in Fig. 6B, a reasonable case can be made for the progressive acquisition of intermediate and advanced traits (via transitions 1 – 4) in the ancestors of annelids, followed by a subsequent regressive loss of some advanced traits to explain the retention of only four remaining advanced traits.
Limb development in both vertebrates and echinoderms involves widely shared gene regulatory networks that are flexible enough to produce different body plans and different numbers of appendages (Section 3C) The capacity for multiple limbs in these deuterostome lineages involves five growth zones in the developing embryo (Isaeva & Rozhnov, Reference Isaeva and Rozhnov2021). In echinoderms, these are at the distal end of each arm, whereas in vertebrates, one is at the posterior end of the body (the tail bud), and the other four at limb buds that become the paired forelimbs and hindlimbs (Isaeva & Rozhnov, Reference Isaeva and Rozhnov2021). The further differentiation of limb buds into articulated (flexible) elements is another matter that involves timing and other factors in vertebrates (Zeller, Reference Zeller2010; McQueen and Towers, Reference McQueen and Towers2020), which may differ for echinoderms because of the repetitive and regenerative nature of arm elements (Czarkwiani et al., Reference Czarkwiani, Ferrario, Dylus, Sugni and Oliveri2016).
If annelids and echinoderms followed paths similar to those of vertebrates and other CC lineages to acquire their advanced traits (see Fig. 6), it is quite obvious that Cnidarians did not. As non-bilaterians, they didn’t even complete transition 2, much less transitions 3 and 4. Rather, these box jellyfish acquired their advanced trait (high-speed locomotion in the form of jet propulsion, see motor traits in Appendix B) in a different way that did not involve bilateral symmetry or flexible limbs. This underscores the dependency of motor capacities on the combination of body, sensory and brain traits (Section 3; Fig. 5) and illustrates that body traits other than flexible limbs can lead to increased speed (see Table of locomotion mechanisms in Appendix B under motor traits). Regardless of how advanced traits were acquired in these three outliers, we fully expect that there will be a wide range of cognitive abilities with many permutations arising from different trait combinations.
In this regard, cnidarians and echinoderms are very instructive, especially since they don’t have a brain. Like echinoderms, cnidarians are without a head and paired sensors at the helm, but they are equipped with multiple sensors (including low-resolution, image-forming eyes) that are grouped into clusters called rhophalia at each of the four corners of their box-shaped bodies (Nakanishi et al., Reference Nakanishi, Hartenstein and Jacobs2009). Thus, a limited visual capacity for guiding their rapid, jet-propelled movements is present, but bilateral symmetry and appendages for optimizing 3D maneuverability (Hollo and Novak, Reference Hollo and Novak2012) are not.
Brittle stars (class Ophiuroidea) stand out among echinoderms as having very flexible limbs capable of manipulating objects, albeit rather clumsily (see Motor traits in Appendix B). They also have an unusual combination of traits at arguably different levels of complexity, with flexible limbs being at complexity level 4, visual traits at level 2 and brain/nervous system traits at level 1 (see complexity level criteria in Table 3). This combination of traits makes for a slow, and rather ungainly, but nevertheless synchronized and bilaterally symmetric rowing movement of four arms in the direction of the fifth arm (Astley, Reference Astley2012) (see also Body and motor traits in Appendix B). The synchronized rowing movements produce higher locomotion speeds (1 – 2 cm/s) than most other echinoderms with inflexible or less flexible limbs (e.g., starfish)(Clark et al., Reference Clark, Kanauchi, Kano, Aonuma, Briggs and Ishiguro2019). Nevertheless, central integration in brittle stars and other echinoderms is minimal, and despite the basic bilaterian organization of their larval nervous systems (Hinman and Burke, Reference Hinman and Burke2018), adult echinoderms do not have anything like a head or brain. Moreover, brittle stars never reach the high speeds of cnidarians or other animals in CC lineages (> = 1 m/s)(see Appendix B: Motor traits) – perhaps because they have no image forming eyes to guide them at higher speeds, and additionally, no brain for central coordination of fast rowing movements.
The third of the non-CC phyla, Annelida, is of particular interest because it contains a large and diverse clade of animals called polychaetes or bristleworms, known for their bristle-like extensions (setae or chaetae) at the end of each paired appendage (parapodium). Polychaetes can be further subdivided into two paraphyletic groups, one that is non-mobile (Sedentaria) and one that consists of semi-pelagic and highly mobile forms (Errantia) (Weigert & Bleidorn, Reference Weigert and Bleidorn2016). The latter group contributes most of the advanced traits to this phylum, resulting in annelids sharing significantly more traits with CC lineages than other phyla (Fig. 3A,B). Errantia are also distinguished by their impressive ambush predation, which places them above many adult animals in CC lineages in the food chain. In terms of sheer body size, the largest polychaetes stand out from animals in other non-CC phyla. While difficult to operationalize, the predatory and territorial-aggressive behaviors of errant polychaetes may be some of the most rapid, energetic, and visually guided behaviors documented for non-CC animals (Britayev & Martin, Reference Britayev and Martin2021; Lachat & Haag-Wackernagel, Reference Lachat and Haag-Wackernagel2016).
With respect to flexible limbs, it is interesting to note that the articulated setae at the end of unjointed parapodia in polychaetes (see body traits in Appendix B) is a characteristic that sets them apart from their less-mobile cousins. Moreover, the setae appear to confer some enhanced walking and swimming abilities, including speed, even though the setae operate in a passive fashion, having no innervated muscles for independent control (Merz & Edwards, Reference Merz and Edwards1998). Assuming that our hypothesis about pivotal traits is correct, it is entirely possible that the ‘big three’ could become the ‘big four’ if it is later discovered that one or more species in Errantia have additional advanced traits, such as 3D rotational sense organs, high-speed locomotion or complex behavioral/cognitive traits (e.g. unlimited associative learning abilities).
On the contrary, highly mobile members in this annelid phylum might simply represent an intermediate stage between the extremes of non-CC and CC lineages (Fig. 3C), owing to the likely regressive loss of some but not all advanced traits (see Section 3C) and the resulting mix of traits at different levels of complexity (Fig. 5; Section 7C). Vanadis tagensis, for example, is an errant polychaete that has level 4 sensory (high-resolution eyes) and brain (laminated retina) traits, combined with level 3 body traits (unjointed appendages with chaetae) (Hermans & Eakin, Reference Hermans and Eakin1974). In any event, we think Errantia is an interesting annelid group with an unusual mix of combined traits that deserves further attention.
6. Methods
Here we fill in some of the details of our approach. This includes our operational criteria for selecting traits for the purpose of distinguishing between CC and non-CC lineages (Sections 6A), considerations that went into selecting traits in different categories (Section 6B), how we searched the literature for traits and how we assigned them to different lineages (Section 6D), and finally, methods for evaluating the trait-linkage hypothesis (Section 6E).
6A. Trait selection criteria
An overarching principle in the selection of all traits was their ability to satisfy three of four key conditions for a good operational definition, as outlined by Levitis et al. (Reference Levitis, Lidicker and Freund2009). First and foremost, traits must be (1) broadly applicable to a wide range of species, both human and non-human, vertebrate and invertebrate (universality condition) and (2) easily observed or measured and thus, more likely to be reported in the literature (observability condition). Traits should also be capable of distinguishing between the phenomenon of interest (in our case, CC lineages) and all other phenomena (non-CC lineages). This means that traits should be (3) present in all CC lineages (inclusivity condition), but (4) absent in non-CC lineages (exclusivity condition).
We let the distribution of traits inform us about which, if any traits, met the exclusivity condition, but we proactively eliminated traits that did not meet the inclusivity condition. Body segmentation, color vision and olfactory glomeruli (an organizational feature in some 1st-order olfactory regions of the brain) are examples of traits that stand out as being absent in mollusks (Redl et al Reference Redl, Scherholz, Wollesen, Todt and Wanninger2016; Hanlon and Messenger, Reference Hanlon, Messenger, Hanlon and Messenger2018; Cummins and Wyeth, Reference Cummins, Wyeth, Di Cosmo and Winlow2014; Scaros et al., Reference Scaros, Croll and Baratte2018), and traits like these were excluded for the purpose of meeting the inclusivity condition.
In addition to the considerations discussed in Section 6B for each trait category, we also included traits originally hypothesized by Trestman (Reference Trestman2013, Reference Trestman, Andrews and Beck2018) to be important for the emergence of complex cognition in CC lineages. These are traits that are associated with complex, goal-directed body actions, and include one body trait (flexible limbs), two sensory traits (image-forming eyes, divided into high- and low-resolution types, in lieu of ‘true’ eyes), and two motor traits (object manipulation and 3D mobility). These traits were included for the express purpose of determining whether they were exclusive to CC lineages, as hypothesized, or also shared with other non-CC lineages.
Because our approach involves the distributions of traits in several parallel tracts (see Fig. 5), traits in one category (section 6B) might be considered to be redundant with those in another. Appendicular locomotion (a motor trait), for example, is at least somewhat, if not entirely redundant with paired appendages (a body trait). This is largely because motor capacities depend on body traits, as well as sensory and brain traits. The same can largely be said for behavioral/cognitive abilities, which theoretically rely on traits in all the other categories. Thus, there will be common functional threads connecting parallel tracts (Fig. 5) and trait categories. Although there is very little redundancy within each trait category, there is partial overlap in a few cases - e.g., 3D mobility is subsumed under the mobility trait, and likewise, flexible appendages are subsumed under paired appendages. In these cases, animal lineages with 3D mobility/flexible appendages also have mobility/paired appendages, but not all lineages with mobility/paired appendages have 3D mobility/flexible appendages.
6B. Trait categories
Traits for determining multi-trait distributions across lineages were drawn from five parallel tracts of metazoan evolution that are potentially important to mind-body connections (Fig. 5): (1) body plan and body part traits, (2) sensory traits that guide motor actions, (3) organizational features of the brain that determine how sensorimotor information is integrated, (4) motor abilities related to locomotion and the movement of body parts (appendages, heads, and eyes), and (5) cognitive capacities, as indicated by different behavioral and learning traits. Further information on criteria for assigning different traits to each lineage/phylum can be found under each trait category in Appendix B.
6B.1 Body traits
Revolve around major body plan innovations during the evolution of metazoans (Nielsen, Reference Nielsen2008). These include the appearance of (1) differentiated neurons and nerve tissue, (2) mesoderm and striated muscle, (3) bilateral symmetry and associated traits (e.g., a brain and central nervous system), and (4) a through-gut. Two other traits – (5) paired (unjointed) appendages and (6) jointed (or otherwise flexible) limbs - represent important de nova traits that led to increased body flexibility, maneuverability and range of motion.
6B.2 Sensory traits
Emphasize exteroceptors (e.g., eyes) and some interoceptors (body motion senses) that are easy to identify across phyla. Eight sensory traits were included, (1) one of which represents a combination of two or more senses that afford multimodal sensing abilities, and the rest of which represent individual sensory channels, including (2) olfactory, (3) auditory/vibratory, and (4) flow senses. Visual senses were subdivided into (5) low- and (6) high-resolution eyes, according to the classification scheme of Nilsson (Reference Nilsson2009)(Table 2). Body-motion senses were likewise divided into sensors that detect (7) translational and (8) rotational motions, giving some consideration as to whether motion sensing was possible in one, two or all three dimensions.
6B.3 Motor traits
Focus on three categories of motor actions, all of which are broadly subsumed in a wide range of behaviors. The first five traits (mobility, 3D mobility, polarized locomotion, appendicular locomotion, and high-speed locomotion (> = 1 m/s)) all revolve around locomotion, which entails the movement of the entire body from one place to another, with multiple ways of achieving this (see Motor traits in Appendix B). The sixth trait, object manipulation, involves object-oriented, body-part movements, which entail the independent movement of limbs, mouth and other body parts towards objects of interest. Finally, the last trait, eye mobility, involves the independent movement of the eyes (or retina) within the head to track items of interest and to prevent image blur during rapid (accelerating) movements.
6B.4 Brain traits
Were mostly based on the regional differentiation of the brain into distinct parts (Fig. 3) as an outward, easily observed, but relatively crude indicator of functional modularity and complexity (Leise, Reference Leise1990; Shih et al., Reference Shih, Sporns, Yuan, Su, Lin, Chuang, Wang, Lo, Greenspan and Chiang2015). The term structured was borrowed from Heuer et al (Reference Heuer, Müller, Todt and Loesel2010) to describe brains that are differentiated into recognizable structures (see further criteria under Brain traits in Appendix B). Other traits revolve around individual structures with similar functions that could be recognized across all three CC lineages, including (1) dedicated, first-order brain regions that process inputs from sense organs, with visual and olfactory regions being the easiest to identify, (2) motor hierarchies that consist of low, mid and high-level brain regions that control motor actions, (3) structures associated with learning and memory that are distributed along the motor hierarchy and finally, (4) multisensory integration areas, also distributed along the motor hierarchy (Fig. 3, Appendices A and B). One other trait, the so-called ‘adaptive filter’ architecture, was based on strikingly recognizable cellular features found in the brains of all three CC lineages and associated with learning and prediction functions (see brain traits in Appendix B for further detail).
6B.5 Behavioral and cognitive traits
Are inextricably linked and can be used as observable indicators of how various body, sensory, brain and motor traits interact (see Fig. 6). Cognitive traits depend on behaviors to reveal them – either in the form of natural behaviors that are observed in the wild or in terms of natural or trained behaviors used in experimental settings to measure cognitive abilities. For this analysis, we selected two naturally occurring behaviors and three experimentally determined learning abilities that, from all appearances, vary from simple to complex. The two natural behaviors, central place foraging and construction behaviors represent relatively complex behaviors that emphasize place (or navigational) and object-oriented skills, respectively. Learning abilities are divided into three categories that range from simple to complex, as envisioned by Ginsburg and Jablonka (Reference Ginsburg and Jablonka2021). The simplest form is non-associative learning, which includes habituation and sensitization. At the other end of the continuum is unlimited associative learning, a well-studied suite of experimentally determined learning abilities that, among other things, enable animals to learn novel, object-oriented and goal directed behaviors (Birch et al., Reference Birch, Ginsburg and Jablonka2020; Ginsburg and Jablonka, Reference Ginsburg and Jablonka2019, Reference Ginsburg and Jablonka2021). Limited associative learning is intermediate, and includes classical conditioning and simpler forms of operant conditioning.
6C. Literature searches and trait assignments to different lineages
Several databases (e.g., Web of Science, Google Scholar) and search terms for each of the 595 (35 traits x 17 lineages) combinations were used to search the literature. Search terms included trait-based (e.g., eyes, photoreceptors) and taxonomic descriptors, such as the phylum, subphylum, or scientific and common names of exemplar species in each lineage (e.g., velvet worms for the phylum Onychophora). Additional search terms and data bases were added if a given trait could not be initially documented in a given lineage to reduce the possibility of ‘absence of evidence’ errors (see Section 8).
Selected traits were sometimes characteristic of all taxa within a given lineage, but often they were not. In such cases, the trait was credited to the lineage if it occurred in at least one taxon; this could be at the subphylum, class, order, family or even species level. Thus, a trait assignment to any given lineage does not mean that all members of that lineage possess this trait. The distributions of body, sensory and motor traits were generally easier to determine than those of brain or cognitive traits, largely because the former are more easily observed and thus, more frequently reported. In more difficult cases, we opted for liberal criteria to err on the side of inclusivity rather than exclusivity. Finally, in some taxa, particularly aquatic invertebrates, an individual trait might be found in one or more, but not all stages of an animal’s life cycle. In these cases, trait assignment was based on the presence or absence of the trait in the adult, reproductive stage. However, this somewhat arbitrary choice (larval or adult) had little impact on the overall results (see Section 2B). Detailed descriptions of individual traits and the criteria that were used to assign them to different lineages can be found in Appendix B along with a supplemental spreadsheet file (Trait distributions.xls) that shows the assignment of individual traits to each of the 17 lineages.
6D. Methods for evaluating the trait linkage hypothesis
As discussed in Section 3, the multi-trait, transitional framework of Fig. 5 suggests that there are different stages of complexity, each defined by a combination of different character states in multiple trait categories, and that, furthermore, multiple traits and trait-transitions are linked in time. If true, one might expect to find evidence of linked traits at different levels of complexity in different animal groups. As a preliminary demonstration of the plausibility of this hypothesis, we subdivided the 17 lineages into 65 classes, using www.catalogueoflife.org as a source of taxonomic classification. We then tabulated the number of classes in which we could find animals that had multiple traits at the same level of complexity, as defined in Tables 2 and 3 and as depicted in Fig. 5. Further criteria for defining levels of brain complexity can be found in Appendix B (under Brain traits).
Assigning complexity levels to different animal classes is not without its difficulties. For example, unlike vertebrates, many if not most invertebrates, especially euarthropods, have more than just a single pair of photoreceptive organs – a pair of lateral compound or single-lens eyes, plus other photosensitive organs, called by various names – e.g., median ocelli and Nauplis eyes (Strausfeld et al., Reference Strausfeld, Ma, Edgecombe, Fortey, Land, Liu, Cong and Hou2016). The former differ from the latter in at least three important ways - (1) the way in which light is refracted and directed by the lens/lenses to an underlying array of photoreceptive cells that preserve the spatial order of incoming light, (2) in the photoreceptor projections to dedicated, first-order visual regions of the protocerebrum (optic lobes), which processes this information, while also preserving the retinotopic order of the inputs (Fig. 3B, Strausfeld et al., Reference Strausfeld, Ma, Edgecombe, Fortey, Land, Liu, Cong and Hou2016), and (3) their overall function in the visual guidance of behaviors. In contrast, other light-sensitive organs, some of which also have lenses, provide more diffuse inputs to the central region of the protocerebrum, functioning more as part of a light-sensitive, modulatory pathway than as a visual pathway (Strausfeld et al., Reference Strausfeld, Ma, Edgecombe, Fortey, Land, Liu, Cong and Hou2016).
For animals with more than one pair of photosensitive organs, we applied three rules of thumb. One, we used Table 2 and the original assignment of complexity levels by Nilsson (Reference Nilsson2013) to different lineages as a general guideline. Two, the presence of photosensors with the highest level of complexity superseded all other sensor types in terms of assigning visual complexity levels to any given taxon. For example, animals with compound or single lensed eyes and laminated visual regions were classified as level 4, regardless of what other photosensitive organs might be present. Three, behavioral evidence of visual capacities, if available, carried greater weight than other, less-observable diagnostic criteria in Table 2. In the final analysis, the broad categories used in this analysis do not capture the full extent of functional diversity and behavioral uses of multiple photosensitive organs in the animal kingdom (as discussed in Nilsson, Reference Nilsson2013). Nevertheless, they are based on a combination of objective and observable traits and serve a useful purpose for estimating both informational and behavioral capacity, which are at the heart of cognitive complexity.
7. Additional results with discussion
7A. Trait distributions
Figure 8 shows that trait distributions across lineages in each category range from narrow to broad, illustrating that our criteria for selecting traits were relatively even-handed in identifying a mix of traits that were not only shared with CC lineages but also non-CC lineages. Several other points are worth making about these distributions. One is that the wide distribution of many body traits (e.g., nerve tissue, striated muscle, bilateral symmetry, and cephalization/brains), is completely expected, as these are the primitive, defining characteristics of bilaterian body plans (Nielsen, Reference Nielsen2008; see Appendix B: Body traits). Likewise, mobility and polarized locomotion are also primitive characteristics of bilaterians, and these depend on foundational body traits, such as neurons, striated muscle and bilateral symmetry. Distal sensing abilities - olfaction, vision, audition and flow sensing are also primitively shared traits, as are multimodal sensing capabilities. The presence of a brain (no matter how rudimentary, see Appendix A) is also a shared characteristic of most bilaterians (a trait linked to bilateral symmetry), but brains that are structured and divided into recognizable parts with distinct functions (Fig. 3) are more rarely shared.
The number of lineages that share a given trait in different trait categories: Body (A), sensory (B), brain (C), motor (D), and behavior/cognition (E). Note that the cephalization/CNS/brain trait in the body category could easily double as a brain trait (i.e., presence or absence of a brain), thus extending the maximum number of lineages that share a trait in the brain category from a non-majority (8) to a majority (11).

7B. Dichotomous trees for distinguishing CC from non-CC lineages
Another way to look at different trait contributions is from the perspective of a dichotomous key in which different lineages are peeled off from the main road to CC status by asking if a given trait is present or absent (Fig. 9). Focusing on body traits first, different lineages can be seen to exit the road to CC status via various off-ramps (Fig. 9A). Sponges (Porifera) take the first off-ramp due to lack of both striated muscle and a nervous system, both foundational traits, whereas animals like bristleworms (Annelida), water bears (Tardigrada) and velvet worms (Onychopora) take the last off-ramp due to the lack of flexible limbs, a pivotal trait. The dichotomous key also accounts for the uneven distribution of CC attributes within chordate and mollusan phyla, with non-vertebrate chordates and non-cephalopod mollusks taking the off-ramps associated with lack of paired appendages, an intermediate trait, or flexible appendages, an advanced trait. Keeping the same foundational body traits (striated muscle/nervous system, bilateral symmetry, and cephalization) at the bottom of the dichotomous key, but switching in different sensory (Fig. 9b), motor (Fig. 9c) or brain (Fig. 9d) traits at intermediate or pivotal levels produces similar results, suggesting that traits from different categories may be linked in a parallel fashion. Regardless of how one analyzes the distribution of traits, lineages with animals that possess all of the pivotal traits reach CC status, whereas those without any or with some, but not all, do not. Furthermore, complex cognitive (unlimited associative learning) and behavioral (central place foraging and construction behaviors) traits are, with but one exception (construction behavior in Annelida), found only in the three CC lineages, lending further support to the idea that the ‘big three’ are among the few lineages to exhibit complex cognition.
Dichotomous keys showing various off-ramps from the main road to CC status. More narrowly distributed traits are at the top of the tree to show pivotal body (A), sensory (B), brain (C) or motor (D) traits. More widely distributed, foundational traits are towards the bottom and in some instances, intermediate traits are in the middle Note that Echinodermata is technically classified as a bilaterian phylum owing to the bilateral symmetry of their larval forms.

7C. Frequency of linked traits at different stages of complexity
The results of the trait-linkage analysis revealed that a majority (∼58%) of classes in the 17 lineages studied here had animals with body, visual and brain traits all at the same level of complexity (Table 3; see also supplemental materials, Complexity level.xls, for the ‘raw data’ and assignment of traits). In contrast, only 3% of classes had animals with all three traits at different levels of complexity. The remaining 39% had two out of three traits matched in complexity, most often with the third category just one level higher or lower than the two matched categories.
As might be expected, examples of matched traits at the lowest levels of complexity (0 and 1) came from non-bilaterian phyla - sponges (Porifera) and comb jellies (Ctenophora), respectively, with animals from two out of six classes of cnidarians (hydra and corals/anemones) also exhibiting level 1 complexity across the board. In contrast, matched traits at the highest level came from CC lineages, with 64% of euarthropod classes and 90% of vertebrate classes having matched, level 4 traits. Among mollusks, only 1 (Cephalopoda) out of 5 classes (20%) had matched, level 4 traits (Table 3).
Evidence of matched level 4 traits can also be also found in the fossil record. The extinct Anamalocaris (∼515 mya) has large complex eyes with high spatial resolution and jointed frontal appendages (Briggs, Reference Briggs1994; Paterson et al., Reference Paterson, Garcia-Bellido, Lee, Brock, Jago and Edgecombe2011). Similarly, complex brain features in the form of nested optic neuropils (laminated visual structures) can be found in fossil arthropods with jointed appendages from the Cambrian period (Xiaoya et al., Reference Xiaoya, Xianguang, Edgecombe and Stausfeld2012).
Classes with matched level 2 or 3 traits were found in non-CC lineages only, including two classes of non-cephalopod mollusks (Table 3). Fossil lobopodians, believed to be the ancestor to panarthropods (euarthropods, tardigrades and onychophorans) (Smith and Ortega-Hernández, Reference Smith and Ortega-Hernández2014), also exhibit matched level 3 characteristics in the form of paired (but unjointed) appendages and small simple (not large faceted) eyes similar to those found in their modern-day tardigradian and onychophoran descendants.
Among classes that exhibited sequential combinations of traits, level 2/3 combinations were the most frequent (11 classes in 5 phyla), followed by level 3/4 combinations (5 classes in 2 phyla) and lastly, one class only for 1/2 (Staurazoa, phylum Mollusca) and 0/1 (Myzozoa, phylum Cnidaria) combinations. All in all, the vast majority of classes sampled (86%) had evidence for either the same level of complexity across all three trait categories (37 classes) or two out of three at the same level with the third at a sequential level (18 classes), while the remaining 14% had a combination of traits that were either all different (2 classes) or two at the same level with the third at a non-sequential level (7 classes).
Mollusks were particularly instructive for the diversity of combinations represented (Table 3) and the correspondence between complexity level and combined body and motor traits. Clams (Bivalvia), for example, are at level 2 on the complexity scale and are without limbs and mostly immobile, whereas octopuses (Cephalopoda) have highly flexible limbs and are extremely mobile (complexity level 4). Pelagic nudibranchs (Gastropoda), some of which use paired, parapodial flaps to propel themselves through the water (Farmer, Reference Farmer1970) are arguably somewhere in between bivalves and cephalopods at complexity level 3.
8. Caveats, knowledge gaps and directions for future research
In this paper, we focus on a combination of pivotal traits that we believe tipped the evolutionary scale towards more complex cognitive abilities. All of these traits can be functionally united by their contributions to visuomotor skills. When combined, they represent a profile of traits that is unique to CC lineages. This does not mean, however, that there couldn’t be other traits, equally unique, that are associated with cognition in different ways and that might tell a complementary or even different story. In this regard, the ability to operationalize various traits so that they can be identified in different taxa represents both a limitation of the multi-trait approach and a challenge going forward. Particularly problematic in this regard are brain traits.
Indeed, there are several brain traits that have potential relevance to cognition but that we did not/could not include because of insufficient criteria by which to identify them in a wide variety of taxa. This is largely due to the distributed nature of brain circuits and functions. The dopaminergic rewards circuitry, important to the valuation of a given stimulus (i.e., whether it is potentially beneficial or deleterious), is one example of a distributed circuitry that is important for associative learning, but difficult to localize to any one brain region (Porcelli et. al., Reference Porcelli, Lewis and Delgado2012; Huber et al., Reference Huber, Panksepp, Nathaniel, Alcaro and Panksepp2011; Perry & Barron, Reference Perry and Barron2013; Wise Reference Wise2004; Alikaya et al., Reference Alikaya, Rack-Wildner and Stauffer2018). Neurosecretory (neuroendocrine) functions that control homeostasis and the general behavioral state of animals (Tosches & Arendt, Reference Tosches and Arendt2013) is another category of traits that provide important internal state information, such as the reproductive or emotional state of an animal, both important to decision making (e.g., McCall and Singer, Reference McCall and Singer2012; Perry and Baciadonna, Reference Perry and Baciadonna2017; Porcelli and Delgado, Reference Porcelli and Delgado2017; Spencer, Reference Spencer2017). Cognitive processes that provide top-down, predictive control of the autonomic nervous system, which regulates the energy store of animals for behaviors like ‘fight or flight’ vs ‘rest and digest’, is yet another class of traits that has emerged in vertebrates (Feldman Barrett and Finlay, Reference Feldman Barrett and Finlay2018) and perhaps other CC lineages (Trestman, Reference Trestman2023). As our final example, the division of outputs from laminated visual regions of the brain into two major visuomotor pathways (Fig. 4) may turn out to be a hallmark feature of CC lineages, one that underlies fundamentally different types of egocentric (where things are relative to self) vs allocentric (where things are relative to other things) behaviors (Appendix C.2). This division of labor is currently well-documented for vertebrates and euarthropods (Milner and Goodale, Reference Milner and Goodale2006; Sanes and Zipursky, Reference Sanes and Zipursky2010) but more difficult to assess in cephalopod mollusks and non-CC phyla.
The focus in this paper on high-resolution vision, as one of several pivotal traits associated with active visual sensing, does not exclude the possible importance of other senses to the evolution of cognitive abilities. Jacobs (Reference Jacobs2012, Reference Jacobs2023), for example, makes a compelling case for the importance of olfaction and olfactory-based memory to the evolution of associative learning and long-range navigational skills. Likewise, many other individual traits, as well as combined traits, contributed important tools to the cognitive toolkit. Motor hierarchies, in particular, function as global scaffolds for many distributed functions, such as learning and memory and multi-sensory integration. Although beyond the scope of this paper, some of these ideas are explored further in Appendix C for the interested reader.
The sheer volume of trait x lineage (35 x 17 = 595) combinations that had to be documented from the literature increases the potential for trait assignment errors. Although we tried our best to assign traits correctly, it is possible that some traits were incorrectly assigned, especially for some of the less well-studied, non-CC phyla. In particular, we acknowledge that the absence of evidence for a trait in the literature is not evidence for its absence in any given lineage. Apart from expanding search terms and data bases to minimize the possibility of missing evidence for a trait in a given lineage, we could not always be certain that the apparent absence of a trait was real or simply a consequence of not yet being investigated, reported and/or found by us in the literature.
Absence of evidence is less likely to be a problem for foundational and intermediate traits, because their distributions are already broad, and thus, a further broadening by new data discoveries or revised criteria is unlikely to change the proposed significance of narrowly distributed pivotal traits. However, a significant broadening in the phyletic distribution of pivotal traits could pose a serious challenge to the proposed importance of these traits to the emergence of complex cognition.
Among pivotal traits, flexible limbs are the least vulnerable to absence of evidence errors, as these are easily observed and well documented in all lineages. High-resolution eyes are also relatively easy to discern, although some assumptions are involved (Nilsson, Reference Nilsson2013, Reference Nilsson2022) (Table 2). The laminated structure of 1st order visual regions, in so far as we know, associated with high-resolution eyes only, is also fairly easy to observe and document. However, it is possible that complex inter-cellular organizations normally associated with laminated structures (Fig. 4) have gone undetected in some phyla, particularly those with smaller brains, simply because there were no obvious signs of lamination. Dong & Allison (Reference Dong and Allison2021), for example, discuss how some of the complexity of cell-cell interactions in the hagfish retina may have been missed because of the absence of distinct lamination.
Data on locomotion speed were difficult to find in some phyla (see Table 1 in Appendix B: Motor traits), but physical considerations (e.g., body size, presence or absence of paired appendages) make it unlikely that there will be any big surprises in the distribution of this trait either, with the possible exception of polychaete annelids, which continue to surprise us. Two other pivotal traits – mobile eyes and 3D rotational senses are also fairly well documented (Land, Reference Land2015, Reference Land2019; Budelmann, Reference Budelmann, Atema, Fay, Popper and Tavolga1988; Budelmann and Young, Reference Budelmann and Young1984), although the anatomical and mechanistic diversity of rotational senses – e.g., wing halteres in flying (diptherian) insects and semi-circular canals in vertebrates and many aquatic invertebrates (see Appendix B: Sensory traits) - may hinder identification of this sense in some cases. Finally, although data exist on non-associative and limited associative learning abilities in annelids, very little, if anything, is known about unlimited associative learning abilities in this diverse phylum.
As a final note on the absence of evidence problem, a future discovery of pivotal traits in a few more phyla might simply underscore how different phyla, like Annelida, Echinodermata and Cnidaria, can have some, but not all of the pivotal traits and still not reach the threshold or heights of cognitive complexity (Section 5). Cognitive complexity must be viewed in the overall context of combined traits and evolutionary histories, not just single pivotal traits.
Moving forward, a more rigorous examination of the trait-linkage hypothesis for the evolution of complex cognition is needed (see Section 3A and 7C). Does it have merit and if so, does trait linkage extend to all types of phenotypic traits (body, sensory, and brain) or only some (e.g., high resolution eyes are linked with laminated visual regions of the brain, but not with flexible limbs)? Why is it that many, but not all classes of animals have linked traits? If traits are linked, what is the mechanism and relative importance of selection pressures vs physical and developmental constraints (e.g., gene regulatory networks)(see Section 3C) to the linkage of traits?
Finally, what new insights might be gained from applying the multi-trait approach to understanding the evolution of brains and cognitive abilities at lower taxonomic levels? Can the cognitive abilities of primates relative to other mammals be understood in terms of a unique combinations of traits, such as opposable thumbs, orbital convergence and brain features associated with binocular vision (Barton, Reference Barton2004)? What about visuomotor skills involving good hand-eye coordination, such as arboreal brachiation by primates (Polet and Bertram, Reference Polet and Bertram2021) or everyday human activities involving hands (Land and Hayhoe, Reference Land and Hayhoe2001)? How do visuomotor skills comport with distinguishing characteristics of the retina (Grünert and Martin, Reference Grünert and Martin2020; Hahn et al., Reference Hahn, Monavarfeshani, Qiao, Kao, Kölsch, Kumar, Kunze, Rasys, Richardson, Wekselblatt, Baier, Lucas, Li, Meister, Trachtenberg, Yan, Peng, Sanes and Shekhar2023) or other visual areas of the brain (Barton, Reference Barton1998; Kaas and Balaram, Reference Kaas and Balaram2014)? Can the features of embodied, visuomotor control systems in vertebrates, such as cortico-cerebellar connections, explain cognitive differences between humans and other primates (Barret, Henzi and Barton, Reference Barrett, Henzi and Barton2022)? Likewise, can embodied visuomotor skills explain more advanced cognitive abilities (e.g., tool use) in some (e.g., crows), but not all birds? Many factors are likely involved in the evolution of complex brains and cognition in different animal groups (see Introduction), but the multi-trait embodied approach may reveal some surprising factors not previously considered or envisioned.
Summary and conclusions
Our results reveal a robust division of lineages into cognitively complex and non-complex groups according to trait composition. The distribution of traits indicates that there is a cluster of advanced traits unique to CC lineages, as well as intermediate and foundational traits more widely shared by CC and non-CC lineages alike. Foundational traits include nerve tissue, striated muscle, non-visual and visual senses capable of distal sensing, and a central nervous system and brain. Advanced traits that are pivotal to the evolution of complex cognition include high-speed locomotion, flexible limbs, high resolution eyes coupled with laminated brain structures for processing their inputs, mobile eyes and motor reflexes to stabilize visual images and body motion sensors for detecting 3D body rotations and triggering compensatory eye movements. Whereas foundational and intermediate traits enabled powered mobility in two dimensions at low speeds, advanced pivotal traits enabled powered mobility and object manipulation in three dimensions at higher speeds, as well as the ability to see objects while moving.
In general, the results of our multi-trait analysis add substantial support to the hypothesis that the brain architecture necessary for (a) processing three-dimensional, spatiotemporal properties of the visual world and (b) controlling object-oriented behaviors laid the neural groundwork for more advanced cognitive abilities. Critically important to this ability is the organization of 1st-order laminated visual structures in the brain, which enables serial and parallel processing of high-resolution visual inputs. These 1st order structures contribute to the future evolvability of complex cognition in at least three important ways: (1) they provided a neural scaffold for local neural circuits, which extract biologically relevant spatiotemporal features of the visual surround, such as well-defined edges and the direction of moving targets, (2) they reduced information processing demands of higher order brain regions by removing predicted or irrelevant information, extracting and passing on that which was most relevant to the animal’s survival, and (3) they provided spatial order in the form of retinotopic maps of visual space, which are often preserved in higher brain centers associated with complex cognition.
We propose a hypothetical trait-transition and linkage framework within which different levels and permutations of cognitive complexity in multiple lineages can be understood in terms of synergistic interactions between multiple traits. Each inter-transitional stage represents a different combination of traits that increase in their level of complexity after each transition. To achieve the highest level of brain and cognitive complexity, CC lineages completed the maximum number of transitions to acquire advanced traits. In contrast, non-CC lineages either (a) completed fewer transitions, remaining stuck at lower levels of complexity or (b) having completed the maximum number of transitions, lost some of their acquired advanced traits later on, ending up at a lower level of complexity. Although the framework describes an overall trend in which increasing levels of cognitive complexity run parallel to increasing levels of body, sensory and brain complexities in CC lineages, it is by no means a one-way road map for the evolution of cognition. Rather, the evolution of cognition in different animal groups can only be understood in terms of a complicated evolutionary history that might involve long pauses between transitions, merging and/or reversals of trait transition sequences, and misalignments in transition times between parallel tracts.
Acknowledgements
We would like to thank Vern Bingman, Juan Bouzat, Simona Ginsburg, Eva Jablonka, Catherine McCormick, John Montgomery, Pat Sharp and three anonymous reviewers for reading tortuously long drafts of this manuscript and providing valuable feedback to improve it. We also thank the BBS editor, Barb Finlay, for her many helpful suggestions on how to improve the readability of the paper, especially as it relates to reaching a broader audience across multiple disciplines. In addition, S.C. would like to thank Paul Patton for sparking her initial interest in this topic with discussions and lectures on the evolution of brain and mind in her neuroethology class.
Competing Interests
The authors declare none.
Funding
This research received no specific grant from any funding agency, commercial or not-for-profit sectors.
Supplementary material
To view supplementary material for this article, please visit https://doi.org/10.1017/S0140525X24000335
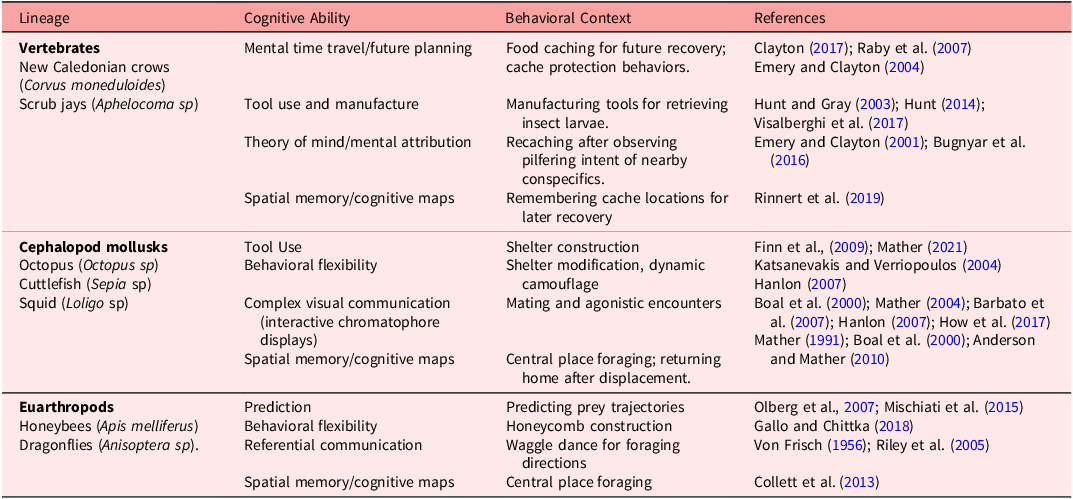


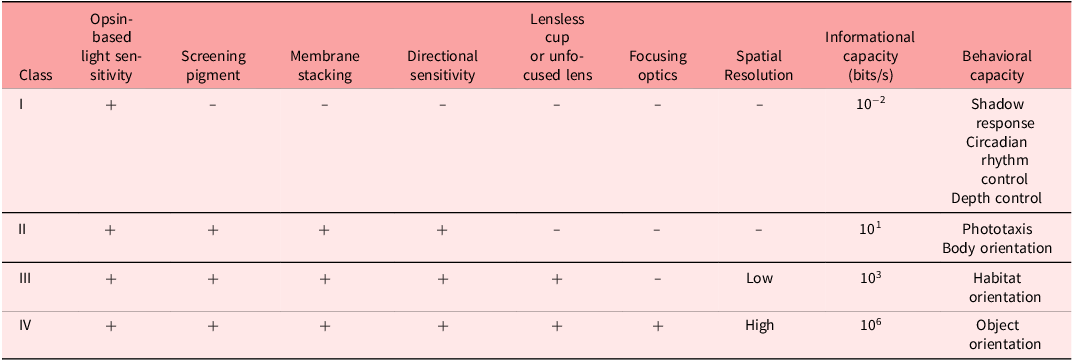
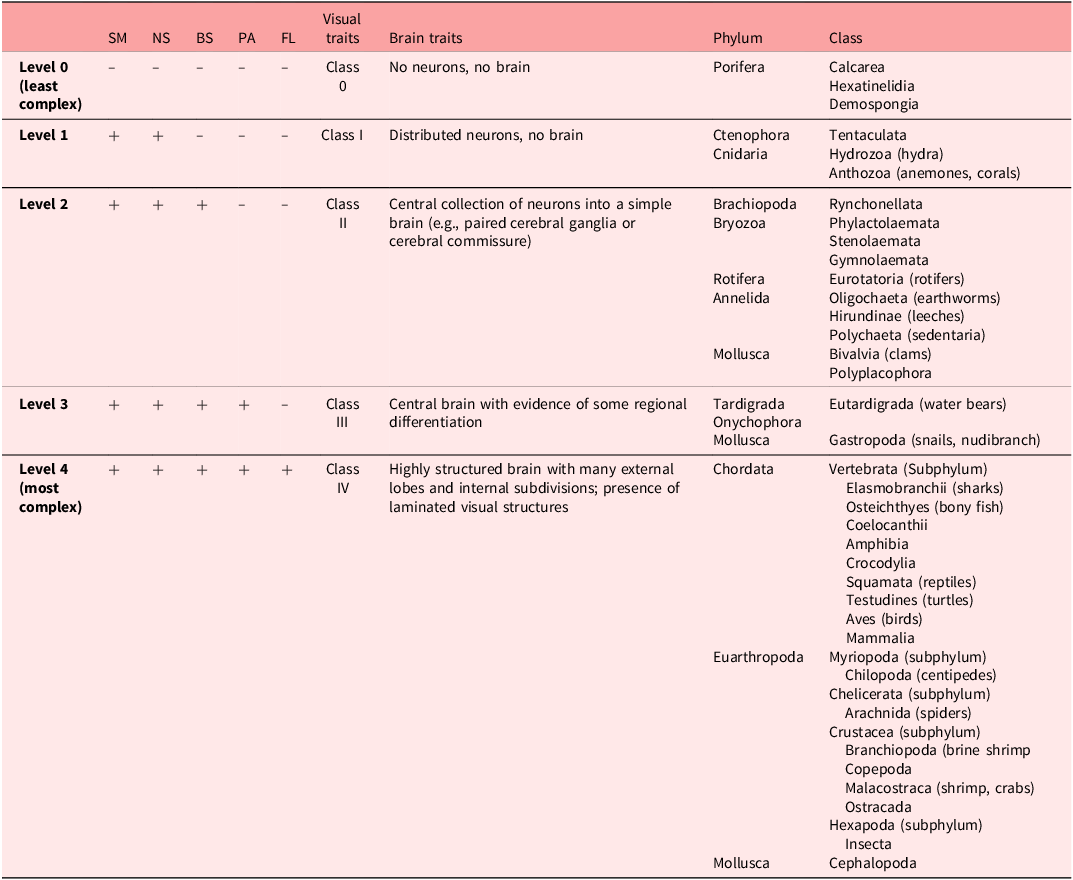




Target article
A multi-trait embodied framework for the evolution of brains and cognition across animal phyla
Related commentaries (20)
Beyond the sea squirt’s brain: cognition as inseparable from sensory-motor action
Challenging the central brain dogma: new experimental insights from the moon jellyfish (Aurelia spp.)
Cognition and valence as chicken and egg: Motivational force evolved alongside cognition
Cognition in motion: Functional internal models as an evolutionary scaffold in cognitive control
Complex brains allow functioning in a complex environment by using information
Complex cognition in context
Considering REM sleep-like stages among the traits defining cognitively complex lineages
Evolution of social “cognitive cell” adaptations in unicellular organisms with complex mating traits
From biological vision to artificial intelligence: The role of foundational predictive processing
Giving body to the multitrait framework
How to build a phylogenetic bridge to charismatic cognition
Neural evolution as the key to major transitions in cognitive evolution
On bodies, brains, and behaviour (and a little bit of magic)
On modes of learning in apex cognition
Pain and the evolutionary origins of subjective experience
SARA-C: A core mechanism underlying g in evolution and development
Social cognition: A crucial indicator of higher-order cognitive ability across the animal phyla
There is more diversity than unity within and between the three “cognitively complex lineages”
Tracing life-mind continuity in pivotal traits – world models and isomorphism
What’s “Complex” about complex cognition?
Author response
Multi-trait convergent trends in the evolution of brains and cognition