






No CrossRef data available.
Article contents
Practical guidelines for gut microbiome analysis in microbiota-gut-brain axis research
Published online by Cambridge University Press: 15 July 2019
Abstract
The microbiota-gut-brain (MGB) axis field is at an exciting stage, but the most recent developments in microbiota research still have to find their way into MGB studies. Here we outline the standards for microbiome data generation, the appropriate statistical techniques, and the covariates that should be included in MGB studies to optimize discovery and translation to clinical applications.
Information
- Type
- Open Peer Commentary
- Information
- Copyright
- Copyright © Cambridge University Press 2019
References
Bolyen, E., Rideout, J. R., Dillon, M. R., Bokulich, N. A., Abnet, C., Ghalith, G. A. Al, Alexander, H., Alm, E. J., Arumugam, M., Bai, Y., Bisanz, J. E., Bittinger, K., Brejnrod, A., Brislawn, C. J., Brown, T.C., Callahan, B. J., Mauricio, A., Rodríguez, C., Chase, J., Cope, E., Da Silva, R., Dorrestein, P.C., Douglas, G. M., Duvallet, C., Edwardson, C. F., Ernst, M., Fouquier, J., Gauglitz, J. M., Gibson, D. L., Gonzalez, A., Huttley, G. A., Janssen, S., Jarmusch, A. K., Kaehler, B. D., Kang, K. B., Keefe, C. R., Keim, P., Kelley, S. T., Ley, R., Loftfield, E., Marotz, C., Martin, B., Mcdonald, D., McIver, L. J., Melnik, A. V., Metcalf, J. L., Morgan, S. C., Morton, J. T., Naimey, A. T., Navas-Molina, J. A., Nothias, L. F., Orchanian, S. B., Pearson, T., Peoples, S. L., Petras, D., Preuss, M. L., Pruesse, E., Rasmussen, L. B., Rivers, A., Robeson, M. S., Rosenthal, P., Segata, N., Shaffer, M., Shiffer, A., Sinha, R., Song, S. J., Spear, J. R, Swafford, A. D., Thompson, L. R., Torres, P. J., Trinh, P., Tripathi, A., Turnbaugh, P. J., Ul-Hasan, S., van der Hooft, J. JJ., Vargas, F., Vázquez-Baeza, Y., Vogtmann, E., von Hippel, M., Walters, W., Wan, Y., Wang, M., Warren, J., Weber, K.C., Williamson, C. HD., Willis, A. D., Xu, Z. Z., Zaneveld, J. R., Zhang, Y., Knight, R., Caporaso, G. J. (2018) QIIME 2: Reproducible, interactive, scalable, and extensible microbiome data science. PeerJ Preprints 6:e27295v2. Available at: https://doi.org/10.7287/peerj.preprints.27295v1.Google Scholar
Cenit, M. C., Sanz, Y. & Codoñer-Franch, P. (2017) Influence of gut microbiota on neuropsychiatric disorders. World Journal of Gastroenterology 23(30):5486–98. Available at: https://doi.org/10.3748/wjg.v23.i30.5486.Google Scholar
Costea, P. I., Zeller, G., Sunagawa, S., Pelletier, E., Alberti, A., Levenez, F., Tramontano, M., Driessen, M., Hercog, R., Jung, F. E., Kultima, J. R., Hayward, M. R., Coelho, L. P., Allen-Vercoe, E., Bertrand, L., Blaut, M., Brown, J. R.M., Carton, T., Cools-Portier, S., Daigneault, M., Derrien, M., Druesne, A., De Vos, W. M., Finlay, B. B., Flint, H. J., Guarner, F., Hattori, M., Heilig, H., Luna, R. A., Van Hylckama Vlieg, J., Junick, J., Klymiuk, I., Langella, P., Le Chatelier, E., Mai, V., Manichanh, C., Martin, J. C., Mery, C., Morita, H., O'Toole, P. W., Orvain, C., Patil, K. R., Penders, J., Persson, S., Pons, N., Popova, M., Salonen, A., Saulnier, D., Scott, K. P., Singh, B., Slezak, K., Veiga, P., Versalovic, J., Zhao, L., Zoetendal, E. G., Ehrlich, S. D., Dore, J., Bork, P. (2017) Towards standards for human fecal sample processing in metagenomic studies. Nature Biotechnology 35(11), 1069–1076.Google Scholar
Cussotto, S., Strain, C. R., Fouhy, F., Strain, R. G., Peterson, V. L., Clarke, G., Stanton, C., Dinan, T. G. & Cryan, J. F. (2018) Differential effects of psychotropic drugs on microbiome composition and gastrointestinal function. Psychopharmacology. Published online August 28, 2018. Available at: https://doi.org/10.1007/s00213-018-5006-5.Google Scholar
David, L. A., Maurice, C. F., Carmody, R. N., Gootenberg, D. B., Button, J. E., Wolfe, B. E., Ling, A. V., Devlin, A. S., Varma, Y., Fischbach, M. A., Biddinger, S. B., Dutton, R. J. & Turnbaugh, P. J. (2014) Diet rapidly and reproducibly alters the human gut microbiome. Nature 505(7484):559–63. Available at: https://doi.org/10.1038/nature12820.Google Scholar
Falony, G., Joossens, M., Vieira-Silva, S., Wang, J., Darzi, Y., Faust, K., Kurilshikov, A., Bonder, M. J., Valles-Colomer, M., Vandeputte, D., Tito, R. Y., Chaffron, S., Rymenans, L., Verspecht, C., De Sutter, L., Lima-Mendez, G., D'Hoe, K., Jonckheere, K., Homola, D., Garcia, R., Tigchelaar, E. F., Eeckhaudt, L., Fu, J., Henckaerts, L., Zhernakova, A., Wijmenga, C. & Raes, J. (2016) Population-level analysis of gut microbiome variation. Science 352(6285):560–64. Available at: https://doi.org/10.1126/science.aad3503.Google Scholar
Falony, G., Vieira-Silva, S. & Raes, J. (2018) Richness and ecosystem development across faecal snapshots of the gut microbiota. Nature Microbiology 3(5):526–28. Available at: https://doi.org/10.1038/s41564-018-0143-5.Google Scholar
Forslund, K., Hildebrand, F., Nielsen, T., Falony, G., Le Chatelier, E., Sunagawa, S., Sunagawa, S., Prifti, Edi, Vieira-Silva, S., Gudmundsdottir, V., Krogh Pedersen, H., Arumugam, M., Kristiansen, K., Voigt, A., Vestergaard, H., Hercog, R., Costea, P., Kultima, J., Li, J., Jorgensen, T., Levenez, F., Dore, J., Nielsen, B. H., Brunak, S., Raes, J., Hansen, T., Wang, J., Dusko, E. S., Bork, P. & Pedersen, O. (2015) Disentangling type 2 diabetes and metformin treatment signatures in the human gut microbiota. Nature 528(7581):262–66. Available at: https://doi.org/10.1038/nature15766.Google Scholar
Gloor, G. B., Macklaim, J. M., Pawlowsky-Glahn, V. & Egozcue, J. J. (2017) Microbiome datasets are compositional: And this is not optional. Frontiers in Microbiology 8:2224. Available at: https://doi.org/10.3389/fmicb.2017.02224.Google Scholar
Gorard, D., Gomborone, J., Libby, G. & Farthing, M. (1996) Intestinal transit in anxiety and depression. Gut 39:551–55.Google Scholar
Knudsen, K., Haase, A., Fedorova, T. D. & Charlotte, A. (2017) Gastrointestinal transit time in Parkinson's disease using a magnetic tracking system. Journal of Parkinsons Disease 7:471–79. Available at: https://doi.org/10.3233/JPD-171131.Google Scholar
Lewis, S. J. & Heaton, K. W. (1997) Stool form scale as a useful guide to intestinal transit time. Scandinavian Journal of Gastroenterology 32(9):920–24. Available at: https://doi.org/10.3109/00365529709011203.Google Scholar
Lyte, M. & Cryan, J. F. (2014) Microbial endocrinology: The microbiota-gut-brain axis in health and disease. Springer.Google Scholar
Maier, L., Pruteanu, M., Kuhn, M., Zeller, G., Telzerow, A., Anderson, E. E., Brochado, A. R., Fernandez, K. C., Dose, H., Mori, H., Patil, K. R., Bork, P. & Typas, A. (2018) Extensive impact of non-antibiotic drugs on human gut bacteria. Nature 555(7698):623–28. Available at: https://doi.org/10.1038/nature25979.Google Scholar
Sinha, R., Abu-Ali, G., Vogtmann, E., Fodor, A. A., Ren, B., Amir, A., Schwager, E., Crabtree, J., Ma, S., Abnet, C. C., Knight, R., White, O. & Huttenhower, C. (2017) Assessment of variation in microbial community amplicon sequencing by the Microbiome Quality Control (MBQC) project consortium. Nature Biotechnology 35(11):1077–86. Available at: https://doi.org/10.1038/nbt.3981.Google Scholar
Valles-Colomer, M., Darzi, Y., Vieira-Silva, S., Falony, G., Raes, J. & Joossens, M. (2016) Meta-omics in inflammatory bowel disease research: Applications, challenges, and guidelines. Journal of Crohn's and Colitis 10(6):735–46. Available at: https://doi.org/10.1093/ecco-jcc/jjw024.Google Scholar
Valles-Colomer, M., Falony, G., Darzi, Y., Tigchelaar, E. F., Wang, J., Tito, R. Y., Schiweck, C., Kurilshikov, A., Joossens, M., Wijmenga, C., Claes, S., Van Oudenhove, L., Zhernakova, A., Vieira-Silva, S. & Raes, J. (2019) The neuroactive potential of the human gut microbiota in quality of life and depression. Nature Microbiology 4:623–32. Available at: https://doi.org/10.1038/s41564-018-0337-x.Google Scholar
Vandeputte, D., Falony, G., Vieira-Silva, S., Tito, R. Y., Joossens, M. & Raes, J. (2015) Stool consistency is strongly associated with gut microbiota richness and composition, enterotypes and bacterial growth rates. Gut 65:57–62. Available at: https://doi.org/10.1136/gutjnl-2015-309618.Google Scholar
Vandeputte, D., Kathagen, G., D'Hoe, K., Vieira-Silva, S., Valles-Colomer, M., Sabino, J., Wang, J., Tito, R. Y., De Commer, L., Darzi, Y., Vermeire, S., Falony, G. & Raes, J. (2017b) Quantitative microbiome profiling links gut community variation to microbial load. Nature 551(7681):507–11. Available at: https://doi.org/10.1038/nature24460.Google Scholar
Vandeputte, D., Tito, R. Y., Vanleeuwen, R., Falony, G. & Raes, J. (2017c) Practical considerations for large-scale gut microbiome studies. FEMS Microbiology Reviews 41(1):S154–67. Available at: https://doi.org/10.1093/femsre/fux027.Google Scholar
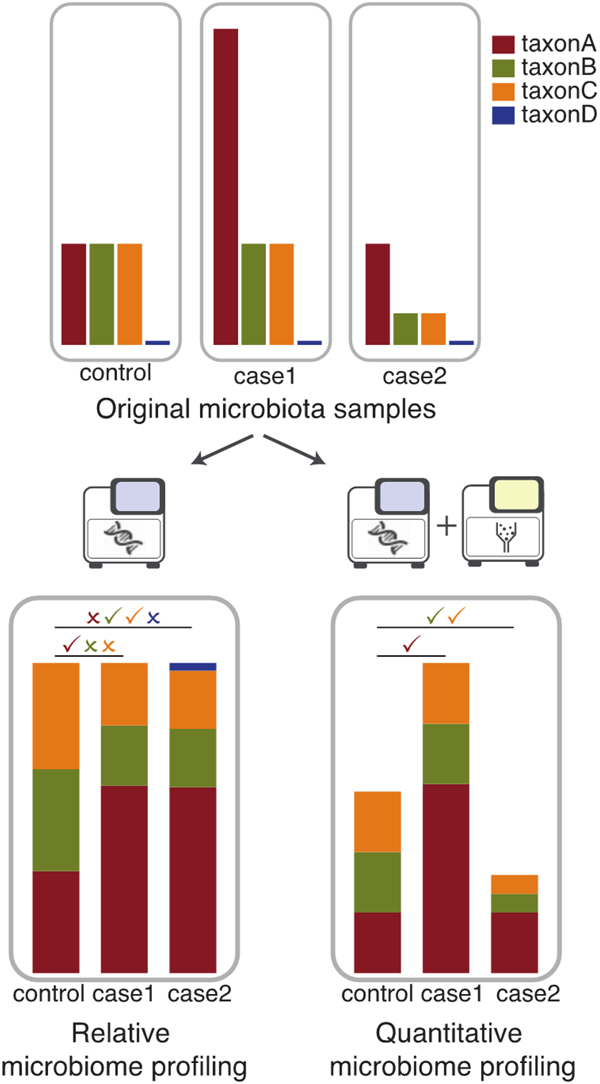
Figure 1. Implications of the compositionality of microbiota data. Three illustrative samples (top) – one from a control (control) and two from patients (case 1 and case 2) – each containing four different microbial taxa, are analyzed by relative (bottom left) or quantitative (bottom right) microbiome profiling. In the original sample, although case 1 has an increased absolute abundance of taxon A, case 2 has decreased abundances of taxa B and C. Relative microbiome profiling results in very similar profiles for the two cases, and alongside the true differences in taxa abundances (true positives: ✓), additional apparent differences are also detected (false positives: ×). In addition, assuming even sequencing depth, samples with reduced microbial density (case 2) are more deeply sampled than the high abundance counterpart (case 1), leading to the detection of taxon D in case 2. In contrast, with quantitative microbiome profiling (coupling DNA sequencing [light blue] with cell count determination by flow cytometry [yellow]), the original absolute abundances of microbial taxa are recreated (although subsampled), and therefore, the information on directionality of the changes is recovered.
Target article
Related commentaries (19)
A call for mapping the development of the microbiota-gut-brain axis during human infancy
Beyond a gut feeling: How the immune system impacts the effect of gut microbiota in neurodevelopment
Nourishing the gut microbiota: The potential of prebiotics in microbiota-gut-brain axis research
Practical guidelines for gut microbiome analysis in microbiota-gut-brain axis research
The parent-offspring microbiome and neurobehavioral development
In their comprehensive review of microbiota-gut-brain (MGB) axis research, Hooks et al. raise concerns about the belated adoption of appropriate methods for studying microbiota composition. Recommendations exist – but only rarely find their way into MGB studies. Here, we point out current efforts of standardization and innovation that improve microbiota interpretability and reproducibility and provide guidelines for their application in MGB research.
Microbiome data generation involves multiple decisions concerning sample collection and storage conditions, nucleic acid extraction protocol, sequencing techniques, and pre-processing that are important to generate high-quality data and reproducible results (Costea et al. Reference Costea, Zeller, Sunagawa, Pelletier, Alberti, Levenez, Tramontano, Driessen, Hercog, Jung, Kultima, Hayward, Coelho, Allen-Vercoe, Bertrand, Blaut, Brown, Carton, Cools-Portier, Daigneault, Derrien, Druesne, De Vos, Finlay, Flint, Guarner, Hattori, Heilig, Luna, Van Hylckama Vlieg, Junick, Klymiuk, Langella, Le Chatelier, Mai, Manichanh, Martin, Mery, Morita, O'Toole, Orvain, Patil, Penders, Persson, Pons, Popova, Salonen, Saulnier, Scott, Singh, Slezak, Veiga, Versalovic, Zhao, Zoetendal, Ehrlich, Dore and Bork2017). Suggestions to optimize and standardize microbiome profiling have been published (Costea et al. Reference Costea, Zeller, Sunagawa, Pelletier, Alberti, Levenez, Tramontano, Driessen, Hercog, Jung, Kultima, Hayward, Coelho, Allen-Vercoe, Bertrand, Blaut, Brown, Carton, Cools-Portier, Daigneault, Derrien, Druesne, De Vos, Finlay, Flint, Guarner, Hattori, Heilig, Luna, Van Hylckama Vlieg, Junick, Klymiuk, Langella, Le Chatelier, Mai, Manichanh, Martin, Mery, Morita, O'Toole, Orvain, Patil, Penders, Persson, Pons, Popova, Salonen, Saulnier, Scott, Singh, Slezak, Veiga, Versalovic, Zhao, Zoetendal, Ehrlich, Dore and Bork2017; Sinha et al. Reference Sinha, Abu-Ali, Vogtmann, Fodor, Ren, Amir, Schwager, Crabtree, Ma, Abnet, Knight, White and Huttenhower2017; Valles-Colomer et al. Reference Valles-Colomer, Darzi, Vieira-Silva, Falony, Raes and Joossens2016; Vandeputte et al. Reference Vandeputte, Tito, Vanleeuwen, Falony and Raes2017c), and, although no complete consensus is achieved, adhering to and following up on such guidelines and being aware of limitations when comparing studies are crucial. Data analysis techniques are also continuously updated, and microbiome data analysis is no exception. A pitfall of microbiome data, ignored or underestimated until recently, is that the data are compositional. That is to say that abundances of microbial groups are expressed as proportions (of reads mapping that group in relation to the total sequenced library). The application of naive normalization and statistics to such compositional data can lead to erroneous results (Vandeputte et al. Reference Vandeputte, Kathagen, D'Hoe, Vieira-Silva, Valles-Colomer, Sabino, Wang, Tito, De Commer, Darzi, Vermeire, Falony and Raes2017b). Compositionality-robust statistics were therefore recently introduced in microbiota research (Gloor et al. Reference Gloor, Macklaim, Pawlowsky-Glahn and Egozcue2017) and have become the new standard in the field and implemented in the most popular pipelines for microbiome data analysis (Bolyen et al. Reference Bolyen, Rideout, Dillon, Bokulich, Abnet, Ghalith, Alexander, Alm, Arumugam, Bai, Bisanz, Bittinger, Brejnrod, Brislawn, Brown, Callahan, Mauricio, Rodríguez, Chase, Cope, Da Silva, Dorrestein, Douglas, Duvallet, Edwardson, Ernst, Fouquier, Gauglitz, Gibson, Gonzalez, Huttley, Janssen, Jarmusch, Kaehler, Kang, Keefe, Keim, Kelley, Ley, Loftfield, Marotz, Martin, Mcdonald, McIver, Melnik, Metcalf, Morgan, Morton, Naimey, Navas-Molina, Nothias, Orchanian, Pearson, Peoples, Petras, Preuss, Pruesse, Rasmussen, Rivers, Robeson, Rosenthal, Segata, Shaffer, Shiffer, Sinha, Song, Spear, Swafford, Thompson, Torres, Trinh, Tripathi, Turnbaugh, Ul-Hasan, van der Hooft, Vargas, Vázquez-Baeza, Vogtmann, von Hippel, Walters, Wan, Wang, Warren, Weber, Williamson, Willis, Xu, Zaneveld, Zhang, Knight and Caporaso2018).
Still, when interpreting variation in microbiota composition determined by metagenomic approaches, it is important to keep in mind that the information about the microbial densities in the original sample is lost. Without microbial load information, proportional data do not allow us to draw any conclusions regarding directionality of changes. For example, an increase in relative abundance of a single microorganism could just result from it maintaining its initial numbers in a generally decreasing community (Fig. 1). Recent innovations such as quantitative microbiome profiling (QMP) (Vandeputte et al. Reference Vandeputte, Kathagen, D'Hoe, Vieira-Silva, Valles-Colomer, Sabino, Wang, Tito, De Commer, Darzi, Vermeire, Falony and Raes2017b) tackle this issue by coupling flow cytometry cell count determination with sequencing, allowing us to recreate absolute abundance profiles from proportional sequence data (Fig. 1). Besides reducing the number of false positives detected in disease association studies, the method also facilitates relating microbial absolute abundances to quantitative physiological parameters. Determination of microbial loads showed that cell densities vary greatly even in healthy subjects but are generally reduced in patients with inflammatory bowel disease. Hence, reduced microbial density could be part of a microbiota signature of disease.
Implications of the compositionality of microbiota data. Three illustrative samples (top) – one from a control (control) and two from patients (case 1 and case 2) – each containing four different microbial taxa, are analyzed by relative (bottom left) or quantitative (bottom right) microbiome profiling. In the original sample, although case 1 has an increased absolute abundance of taxon A, case 2 has decreased abundances of taxa B and C. Relative microbiome profiling results in very similar profiles for the two cases, and alongside the true differences in taxa abundances (true positives: ✓), additional apparent differences are also detected (false positives: ×). In addition, assuming even sequencing depth, samples with reduced microbial density (case 2) are more deeply sampled than the high abundance counterpart (case 1), leading to the detection of taxon D in case 2. In contrast, with quantitative microbiome profiling (coupling DNA sequencing [light blue] with cell count determination by flow cytometry [yellow]), the original absolute abundances of microbial taxa are recreated (although subsampled), and therefore, the information on directionality of the changes is recovered.
Other variables can influence microbiota composition in an MG study besides the disease phenotype under investigation. In addition to confounders that are typically already taken into account in clinical studies (e.g., gender and age), microbiota-relevant factors should also be addressed in study design (e.g., by matching cases and controls) or by recording and factoring them in the statistical analyses. Gastrointestinal transit time, medication, diet, and inflammation markers should be highlighted (Falony et al. Reference Falony, Joossens, Vieira-Silva, Wang, Darzi, Faust, Kurilshikov, Bonder, Valles-Colomer, Vandeputte, Tito, Chaffron, Rymenans, Verspecht, De Sutter, Lima-Mendez, D'Hoe, Jonckheere, Homola, Garcia, Tigchelaar, Eeckhaudt, Fu, Henckaerts, Zhernakova, Wijmenga and Raes2016; Vandeputte et al. Reference Vandeputte, Falony, Vieira-Silva, Tito, Joossens and Raes2015). Transit time is linked to changes in total microbial loads and in abundance of specific taxa, as the microbial ecosystem goes through different stages of development as it progresses through and remains in the intestinal tract (Falony et al. Reference Falony, Vieira-Silva and Raes2018). Beyond the normal variation observed in healthy individuals, altered transit time is also characteristic of several diseases, including nervous system diseases, either being accelerated (e.g., anxiety disorders; Gorard et al. Reference Gorard, Gomborone, Libby and Farthing1996) or slowed down (e.g., Parkinson's disease; Knudsen et al. Reference Knudsen, Haase, Fedorova and Charlotte2017). Therefore, to capture the disease, but not transit time-associated microbiota variations, gastrointestinal transit time needs to be tracked in MGB studies, either by measurement (magnetic tracking systems) or by using proxies such as the Bristol stool scale (Lewis & Heaton Reference Lewis and Heaton1997) or stool moisture content (Vandeputte et al. Reference Vandeputte, Kathagen, D'Hoe, Vieira-Silva, Valles-Colomer, Sabino, Wang, Tito, De Commer, Darzi, Vermeire, Falony and Raes2017b). Additional important confounders in the MGB context include medications, several of which have been reported to affect microbiota composition, including psychotropic drugs (Cussotto et al. Reference Cussotto, Strain, Fouhy, Strain, Peterson, Clarke, Stanton, Dinan and Cryan2018). Effects of drugs on the microbiota can be direct, by affecting growth of specific microorganisms, or indirect, by inducing variations in transit time or host physiology (Forslund et al. Reference Forslund, Hildebrand, Nielsen, Falony, Le Chatelier, Sunagawa, Sunagawa, Prifti, Vieira-Silva, Gudmundsdottir, Krogh Pedersen, Arumugam, Kristiansen, Voigt, Vestergaard, Hercog, Costea, Kultima, Li, Jorgensen, Levenez, Dore, Nielsen, Brunak, Raes, Hansen, Wang, Dusko, Bork and Pedersen2015; Maier et al. Reference Maier, Pruteanu, Kuhn, Zeller, Telzerow, Anderson, Brochado, Fernandez, Dose, Mori, Patil, Bork and Typas2018), but in any case need to be disentangled from the disease signal. Diet can also be an important confounder (David et al. Reference David, Maurice, Carmody, Gootenberg, Button, Wolfe, Ling, Devlin, Varma, Fischbach, Biddinger, Dutton and Turnbaugh2014), especially if dietary behavioral changes are associated with the disease. Finally, inflammation has an impact on the microbiota (Cenit et al. Reference Cenit, Sanz and Codoñer-Franch2017) and may not be part of the disease manifestation. Although we acknowledge the challenges of assessing dietary intake in a systematic way or controlling for it in study design, both systemic inflammation markers (e.g., C-reactive protein) and specific markers for intestinal inflammation (fecal calprotectin) measurements are straightforward.
Finally, the “causality problem” highlighted by Hooks et al. can only be tackled in study design. Strategies such as transplanting/deleting microbiota components associated with the disease to induce/reverse phenotypes in model organisms can provide valuable insights. However, it remains difficult to disentangle direct and indirect contributions of the microbiota in disease onset or pathophysiology. One way to acquire more information on potential mechanisms underlying microbiota-host associations is assessing the metabolic potential of the microbial communities under study, which requires meta-genomic shotgun sequencing. Although computationally more challenging and only rarely performed in MGB studies, such data are very valuable to study the most direct of the proposed microbiota-driven route of MGB communication: the microbial synthesis and degradation of neuroactive compounds (Lyte & Cryan Reference Lyte and Cryan2014). Future research will become easier as context-specific tools are developed, such as the recent publication of neuroactive compound metabolism of the human gut microbiota (Valles-Colomer et al. Reference Valles-Colomer, Falony, Darzi, Tigchelaar, Wang, Tito, Schiweck, Kurilshikov, Joossens, Wijmenga, Claes, Van Oudenhove, Zhernakova, Vieira-Silva and Raes2019), which provides a catalog to facilitate future MGB shotgun meta-genomic analyses.
The MGB field is at an exciting and promising stage. An early adoption of the latest advances in microbiome research by the MGB community, with careful study design, appropriate analysis techniques, and taking into consideration known potential confounders, will promote reliable discovery and lead to earlier translation to clinical application.