



1. Introduction
Whether we are trying to find a friend amongst disembarking passengers or looking for a street name to establish our whereabouts, searching for targets is a ubiquitous part of our lives, and it involves fundamental cognitive mechanisms of perception, attention, and memory. Therefore, determining how we scan the visual environment for relevant information is a fundamental goal of vision science.
Visual search behaviour has been studied for a long time. For example, the very first issue of the Quarterly Journal of Experimental Psychology contained a paper on it (Mackworth Reference Mackworth1948), and Neisser wrote about finding a face in the crowd for Scientific American back in Reference Neisser1964. But the two most seminal years in the field of visual search probably lie in the 1980s. At the start of that decade, Treisman and Gelade (Reference Treisman and Gelade1980) published their classic Feature Integration Theory (FIT). At the end, Wolfe et al. (Reference Wolfe, Cave and Franzel1989), as well as Duncan and Humphreys (Reference Duncan and Humphreys1989) proposed their very influential alternatives, Guided Search (GS) and Attentional Engagement Theory (AET). These contributions made visual search a burgeoning research area. In fact, they have been so successful that a recent review of visual search, published almost 25 years later, still listed FIT, GS, and AET as the leading theories (Chan & Hayward Reference Chan and Hayward2013). However, although these dominant theoretical frameworks have inspired great advances in the study of visual attention, in our opinion, further progress is hindered by what appears to be an implicit yet central assumption, namely that the primary unit of selection in visual search is the individual item.
In the lab, the typical search experiment involves a single known target, which can range from a simple geometrical shape to a more complex alphanumeric character or an everyday object. Participants are usually instructed to determine its presence amongst a varying number of distractor items, although there are variants of the task in which the target is always present and observers make a decision on some orthogonally varied property (e.g., the identity of a letter inside of a target that is defined by colour). The effect of the number of distractor items on RT – the slope of the search function – is an important measure, because it indicates how efficiently observers detect the target. Although theories of visual search broadly recognize that there is a large amount of parallel processing within the visual field, this has had surprisingly little impact on what has been assumed to be the core process, namely the selection of individual items that are either rejected as distractors or recognized as a target. There are a number of promising alternative perspectives that ground the search process in eye fixations rather than covert selections of individual items. We argue that these approaches, when unified, provide a more comprehensive framework for explaining the oculomotor and manual response dimensions of visual search behaviour. The goal of this paper is to provide this unification.
2. Setting the stage: Feature Integration Theory and its assumptions
FIT was never intended as a theory of visual search proper, but rather used the visual search paradigm to test its predictions about the way early sensory processing produces object representations. Nevertheless, it is difficult to overestimate its influence on the formulation of the visual search problem. The fundamental distinction between search with flat slopes, where the time taken to find the target is independent of the number of distractors (e.g., / amongst |), and search with steeper slopes, where search time increases with set size (e.g., red / amongst green / and red |), had been made before (e.g., Jonides & Gleitman Reference Jonides and Gleitman1972). But Treisman and Gelade's (Reference Treisman and Gelade1980) FIT provided an attractive explanation. In its original version, visual features (e.g., colour, orientation, motion) are pre-attentively registered in parallel in separate feature maps. So, whenever the target differs from the distractors by a single feature (e.g., red amongst green), search time is independent of set size. Target presence is simply established by inspecting activity in the relevant feature map. Identifying a target that is a conjunction of features (e.g., red | amongst green | and red /), however, requires serially applied attention to bind the features together, using a map that contains the item locations. Consequently, whenever the target is defined by a combination of features, RTs increase with set size. Thus, FIT explained the quantitative difference between single feature and conjunction search slopes as a qualitative difference between parallel, “map”-based search and serial, “item”-based search. As we will see later, this qualitative distinction prompted an enduring empirical focus on the shallower end of the search slope spectrum as the most informative about the fundamental mechanisms of visual search. After all, somewhere between 0 ms/item and around 25 ms/item (for target-present trials) the transition to item search occurs. Consequently, search beyond this range has been considered to have little additional theoretical value.
FIT opened up an abundance of research questions. It predicted binding errors, where features are combined incorrectly (e.g., Treisman & Schmidt Reference Treisman and Schmidt1982). It also inspired a taxonomy of basic features, by providing the diagnostic of flat search slopes (see Wolfe & Horowitz Reference Wolfe and Horowitz2004, for an overview). And importantly, because of its fundamental distinction between parallel feature search and serial conjunction search, FIT encouraged other researchers to challenge the core of the theory by finding conjunctions of features that nevertheless yielded flat search slopes. Success in this endeavour (e.g., Nakayama & Silverman Reference Nakayama and Silverman1986; McLeod et al. Reference McLeod, Driver and Crisp1988; Wolfe et al. Reference Wolfe, Cave and Franzel1989) gave rise to new models (Duncan & Humphreys Reference Duncan and Humphreys1989; Wolfe et al. Reference Wolfe, Cave and Franzel1989) and to adaptations of FIT (Treisman & Sato Reference Treisman and Sato1990; Treisman Reference Treisman1991).
3. Popular alternative theories: Guided Search, Attentional Engagement Theory, and Signal Detection approaches
3.1. Guided Search
Guided Search, the hitherto most successful model, was conceived to challenge FIT's fundamental distinction between parallel feature and serial conjunction search. Wolfe et al. (Reference Wolfe, Cave and Franzel1989) adapted FIT such that information from the feature maps guides attention towards conjunctions as well. Across several updates (Wolfe Reference Wolfe1994; Reference Wolfe and Gray2007; Wolfe & Gancarz Reference Wolfe, Gancarz and Lakshminarayanan1996) the basic principle has remained unchanged: Guided Search combines signals from different feature maps into a single activation map via broadly tuned (“categorical”) channels (e.g., “red,” “green,” “vertical,” “horizontal”). The activation map holds the locations of the individual items, and attention is guided towards the location with the highest activation. If it contains the target, a target-present response follows. However, because of inherent noise, it may contain a distractor. In that case, attention is guided to the location with the next-highest activation. This continues until the target is found or search is terminated with a target-absent response.
Top-down weighting or filtering of the channels improves search efficiency. For example, for a green-horizontal target and distractors that are red-horizontal and green-vertical, output from the green and horizontal channels is selected. Because the target receives activation from two channels, while distractors receive enhancement from only one, attention can be more efficiently guided towards conjunction targets, allowing for relatively flat search slopes. Furthermore, top-down weighing of specific features explains why people often search through or ignore subsets of items (e.g., Kaptein et al. Reference Kaptein, Theeuwes and Van der Heijden1995; Watson & Humphreys 1997). Accordingly, there is no fundamental distinction between feature search and conjunction search, making both essentially item-based.
The latest version of Guided Search (4.0; Wolfe Reference Wolfe and Gray2007) differs from its best-known predecessor Guided Search 2.0 (Wolfe Reference Wolfe1994) in the way individual items are selected. In version 2.0, items were selected and processed individually in a purely serial fashion at a rate of 50 ms per item. In version 4.0, items are also selected individually and at a similar rate (20–40 ms per item), but they now enter a processing stream that itself takes between 150–300 ms to establish whether an individual item is the target. This component was added to account for findings from attentional dwell time studies, which suggest that items need this amount of time to be processed (Duncan et al. Reference Duncan, Ward and Shapiro1994; Theeuwes et al. Reference Theeuwes, Godijn and Pratt2004). The stream has a capacity of four items. Guided Search 4.0 is therefore no longer a purely serial model, but a serial–parallel hybrid, and is often referred to as the car wash model. Yet, even in version 4.0, the individual item remains at the heart of the search process. Although multiple potential targets are processed simultaneously, these candidates are still delivered one-by-one to the car wash. And despite the disavowal of the qualitative distinction between flat and steeper search slopes, the shallow end of the search slope spectrum continues its important theoretical role, because that is where visual properties that support top-down guidance are separated from those that do not, allowing conferral of the theoretically important concept of “feature status” on the former.
3.2. Attentional Engagement Theory
Another challenge to FIT came from Duncan and Humphreys (Reference Duncan and Humphreys1989), who also criticized the dichotomy between parallel and serial search, but on different grounds. In what later was called AET (Duncan & Humphreys Reference Duncan and Humphreys1992), they proposed a continuous search surface, where the combination of target–distractor and distractor–distractor similarity determines a range of search slopes. When distractors resemble the target, search times increase. When all distractors resemble each other, search times decrease. Hence, search must take the relationship between multiple items into account, rather than just the identity of single items.
It is fair to say that Duncan and Humphreys never envisaged a theory purely based on individual items. Instead, they proposed that search operates on “structural units” – segments in a hierarchically organized representation of the visual input that may be defined at various levels (from individual items to scene structures – see also Nakayama & Martini Reference Nakayama and Martini2011). These structural units compete for access to visual short term working memory (VSTM). The better the match with the target template, the higher the probability that a structural unit enters VSTM; the better the match with a distractor template, the lower this probability becomes. Changes in the selection probability of a structural unit spread in parallel to similar structural units throughout the display.
Yet, although AET was set up as a theory about structural units, its subsequent application to visual search has essentially been item-based. As Duncan and Humphreys (Reference Duncan and Humphreys1989, p. 446) state: “In an artificial search display it may seem reasonable to limit consideration to the few stimulus elements that are presented by the experimenter, but in a realistic, natural image the problem is more complex.” In their account of visual search data, they continue: “[T]here is the problem of classifying each single element in a display as target or non-target. In [AET] this involves matching each element against a template of possible targets” (p. 447). An item-based approach is also notable in SERR (Humphreys & Müller Reference Humphreys and Müller1993), a computational implementation of AET. Here, the individual identity of items (e.g., a particularly oriented T or L) is compared against templates specifying the identity of individual targets and distractors, although items can be strongly grouped if they are of the same identity. So a T is rapidly detected among Ls because the grouped Ls provide strong evidence for the presence of an L and will cause a match with the L-template. This is then followed by inhibition of all Ls, applied via their individual locations, leaving the T as the last uninhibited item. Consequently, the group process is still based on the identities and locations of individual items. Furthermore, the associated empirical work focused on relatively shallow search slopes. Of course, in principle, AET can be applied to structural units other than individual items or to more difficult search. So far, however, AET has not been extended beyond easier, item-based search.
3.3. Approaches based on Signal Detection Theory (SDT)
SDT approaches to visual search (e.g., Eckstein et al. Reference Eckstein, Thomas, Palmer and Shimozaki2000; Palmer et al. Reference Palmer, Verghese and Pavel2000; Verghese Reference Verghese2001) form a different class of theory and are explicitly formulated as a rejection of the two-stage architectures of FIT and Guided Search. Instead, SDT approaches assume a single, parallel stage during which the target and distractor items evoke noisy individual internal representations, with the target's representation scoring higher along the relevant feature dimension. Importantly, because of neural noise, there will be an overlap in the distribution of these individual internal representations. The more similar target and distractors are, the larger this overlap. Target-absent and target-present responses are based on a decision rule. A popular choice is the MAX-rule, where the decision is based on the single item with the largest feature score. The larger the number of distractors, the higher the probability that one of them evokes an internal representation that is target-like. Therefore, evidence for target presence decreases with set size.
Their fundamental opposition to FIT and Guided Search notwithstanding, SDT approaches so far have shared their item-based nature. Even though displays are processed in parallel, decisions are still based on the internal representations evoked by individual items. Moreover, in conjunction searches, the location of the individual items is used to combine the representations on different feature dimensions. Finally, as the main aim of SDT theories was to provide an alternative explanation for flat versus steeper slopes, they too have focused on the shallow end of the search spectrum.
4. The problem: Why items as the conceptual unit hinder more than help in understanding visual search
We hold that the focus on the item as the core unit of visual search is rather problematic for a number of reasons.
4.1. It ignores other ways of doing visual search
Item-based approaches limit the real-world applicability of results from the lab. In that sense, the adoption of the item as conceptual unit may have had an effect on the type of stimuli used as well: Item-based models make item-based predictions that are tested with item-based displays. Yet, although radiologists and security-screeners undoubtedly perform visual search tasks, it is not immediately clear how many “items” mammograms or airport security X-rays contain. Neider and Zelinsky (Reference Neider and Zelinsky2008) argued convincingly that it is impossible to objectively define set size in real-world scenes. Similarly, using the individual item as conceptual unit requires a distinction between texture displays (with many items, or all items forming a coherent surface) and search displays (with fewer items). Although Wolfe (Reference Wolfe1992) reported a dissociation between groups of stimuli that allow texture segmentation and individual items that allow efficient search, it remains unclear how many items are needed before a search display becomes a texture. We are not saying that proponents of item-based models ignore real world searches. On the contrary, the two main authors of the original Guided Search model, for example, regularly publish admirable work on search in real world scenes (Võ & Wolfe Reference Võ and Wolfe2012; Wolfe et al. Reference Wolfe, Võ, Evans and Greene2011b), medical imaging (Donnelly et al. Reference Donnelly, Cave, Welland and Menneer2006; Drew et al. Reference Drew, Evans, Võ, Jacobson and Wolfe2013a; Reference Drew, Võ, Olwal, Jacobson, Seltzer and Wolfe2013b; Evans et al. Reference Evans, Birdwell and Wolfe2013a), and luggage-screening (Godwin et al. Reference Godwin, Menneer, Cave and Donnelly2010; Menneer et al. Reference Menneer, Barrett, Phillips, Donnelly and Cave2007; Wolfe et al. Reference Wolfe, Horowitz and Kenner2005; Reference Wolfe, Brunelli, Rubinstein and Horowitz2013). However, as Wolfe et al. (Reference Wolfe, Võ, Evans and Greene2011b) pointed out, classic item-based models generally fail under these circumstances. To account for scene-based search, yet also preserve the item-based structure of Guided Search, Wolfe (Reference Wolfe and Gray2007; Wolfe et al. Reference Wolfe, Võ, Evans and Greene2011b) assumes a pathway for scene processing that is separate from item-based processing.
Conceptualizing search as being based on selecting individual items limits thinking about alternative ways to complete the task. The item as conceptual unit has made it tempting to view search as a process where items are compared against a template specifying the individual target item (e.g., Bundesen et al. Reference Bundesen, Habekost and Kyllingsbaek2005; Humphreys & Müller Reference Humphreys and Müller1993; Wolfe Reference Wolfe1994; Zelinsky Reference Zelinsky2008) and possibly also other types of target-defining information. This item-based template-matching then provides an underlying rationale for reporting visual search experiments in terms of RTs as a function of set size, where the slope measures the additional cost of having to compare an extra item to the template. However, item-based approaches encounter the problem that search slope estimates of individual item processing (typically 25–50 ms/item) are much lower than estimates of attentional dwell time from other paradigms, which have reported item-processing times of 200–300 ms (Duncan et al. Reference Duncan, Ward and Shapiro1994; Theeuwes et al. Reference Theeuwes, Godijn and Pratt2004). This is why Moore and Wolfe (Reference Moore, Wolfe and Shapiro2001) proposed the car wash model: Search slopes measure the rate at which individual items are entered into a processing stream, rather than processing duration itself, in the same way that the time between two cars entering a car wash can be shorter than the time it takes to wash an individual car. But this model is only necessary if one conceptualizes visual search as the problem of linking one item-based process (a fast serial search of 20 to 40 items per second) to another (a slow bottleneck of about 4 items per second).
In many visual search experiments though, the task is to decide whether the display contains a target – not whether any specific item is a target or a distractor. Conceptualizing the search process as a sequence of item-based present/absent decisions is potentially misleading, because checking whether a particular item is the target is not the only way to complete the task. For instance, looking for a difference signal between the target and its surrounding distractors might work too. This possibility was first recognized for simple feature searches, where “singleton detection mode” (search for any difference) has been distinguished from “feature search mode” (search for a specific feature; Bacon & Egeth Reference Bacon and Egeth1994; or feature relationship, Becker Reference Becker2010). Another promising alternative formulation was given by Rosenholtz et al. (Reference Rosenholtz, Huang and Ehinger2012a), who proposed that observers decide whether a particular fixated patch of the search display contains the target on the basis of pooled summary statistics computed across that patch. Evidence against single item approaches comes from a computational model of Najemnik and Geisler (Reference Najemnik and Geisler2008). They argued that human eye movement patterns during visual search are better explained by a model that fixates areas of the screen that maximize information about target-presence, than by a model that fixates the item most likely to be the target (see also Young & Hulleman Reference Young and Hulleman2013). Likewise, Pomplun and colleagues (Pomplun et al. Reference Pomplun, Reingold and Shen2003; Pomplun Reference Pomplun and Gray2007) reported that fixation patterns not only depend on the presence of particular relevant or irrelevant features, but also on the specific local ratios and spatial lay-outs of these features – that is, local statistics. They too found fixations often to be off-items. This behaviour was successfully captured in a model that assumes area activation rather than individual item activation. Thus, decisions about target-presence could very well be framed at the level of group-statistics of items, rather than at the level of individual items. Item-by-item search may actually be the exception. When search does proceed item-by-item, as demonstrated by fixations on each individual object, performance becomes very poor (Hulleman Reference Hulleman2010; Young & Hulleman Reference Young and Hulleman2013), with extremely steep search slopes and miss rates exceeding 20%. Performance in standard laboratory tasks is typically much better, suggesting less effort is involved than predicted by item-based theories. The idea of items processed in spatial clusters is not new. Pashler (Reference Pashler1987) already proposed search through clumps of items, and arrived at a fixed clump size of 8 items, with 75 ms for every between-clump switch, and a ±15 ms/item slope for within-clump search, although he also argued that it may vary with different types of a search.
One might argue that not all search tasks can be based on global statistics because some really do require the individual item. For example, tasks may involve a response to the precise location of the target, or to a relatively difficult to distinguish property that is varied orthogonally to the target-defining feature. This latter type of task is often known as compound search (Duncan Reference Duncan, Posner and Marin1985), and may partly involve processes that differ from a present/absent task (e.g., Olivers & Meeter Reference Olivers and Meeter2006). However, the fact that the individual target item is required at the end does not mean that the preceding search process is also item-based. Search could be conceived as consisting of multiple steps where statistical signals are used to select the rough area containing the target, more precise signals are then used to exactly locate it, finally followed by even more precise extraction of the response feature. The first steps are likely to be very similar across search tasks, while the later steps are likely to differ depending on what exactly is required from the target (see Töllner et al. Reference Töllner, Rangelov and Müller2012b, for direct evidence).
4.2. It overestimates the role of individual item locations
A main reason why individual items play such an important role in visual search theories is that their locations are necessary for effective feature binding (in FIT, but also in Eckstein et al. Reference Eckstein, Thomas, Palmer and Shimozaki2000; Itti & Koch Reference Itti and Koch2000; and Wolfe Reference Wolfe and Gray2007), or for collecting the features used in guiding attention and template-matching. Moreover, individual item locations are needed to inhibit previously inspected distractors. Yet, visual search is very robust against substantial displacement of items, at least for present/absent tasks. Horowitz and Wolfe (Reference Horowitz and Wolfe1998) reported largely intact search performance when items are randomly shuffled around the display every 100 ms. Furthermore, Hulleman (Reference Hulleman2009; Reference Hulleman2010) reported that search for a moving T amongst moving Ls remained comparable to search in static displays, even when dozens of items were moving smoothly in random directions at velocities of up to 10.8 deg/s (and tracking of all individual items is virtually impossible; Pylyshyn & Storm Reference Pylyshyn and Storm1988). Even occupying observers with an additional working memory task hardly affects search through such random motion displays (Hulleman & Olivers Reference Hulleman and Olivers2014). These results suggest that the exact location of individual items is less important than previously assumed by item-based accounts. Instead, they support the idea that present/absent decisions are based on parallel extraction of properties of groups of items within local areas; properties that are holistic or statistical in nature. An example is the pooling approach of Rosenholtz et al. (Reference Rosenholtz, Huang and Ehinger2012a) mentioned earlier. Here, summary statistics (for relative orientation, relative phase, correlations across scale, etc.) are computed across a patch of the search display. This means that the locations of individual items inside the patch are inherently less important than the location of the patch in the display. Item motion ceases to be a special case because individual location information is also discarded for static items. Finally, note that a pooling approach is less taxing on memory: no memory for individual items is needed, only for inspected areas.
4.3. It ignores a really difficult search
The influence of FIT's distinction between parallel feature-based search and serial item-based search has resulted in an unwarranted emphasis on the shallow end of the search slope spectrum. For example, in Wolfe's (Reference Wolfe1998b) analysis of more than 1 million search trials, 90% of the target-present slopes were below 40 ms/item. We suspect that more difficult search tasks are used only sparingly because of the FIT-derived idea that search becomes completely item-by-item once you have crossed the 25 ms/item barrier (T vs L; 2 vs 5; as most explicitly stated by Wolfe Reference Wolfe and Gray2007). Once this item-by-item stage has been reached, there is little extra theoretical insight to be gained from even slower search, because any additional slowing cannot be due to the core search process.
Furthermore, it appears that slope differences at the shallow end are still given a qualitative interpretation; they are seen as diagnostic for visual properties that support top-down guidance and thus have “feature status.” For example, Wolfe (Reference Wolfe and Gray2007, p. 106) writes that a T is easily discriminable from an L, just like a \ is easily discriminable from |. Yet search for T is inefficient (25–50 ms/item), and search for \ is parallel (0–10 ms/item). Thus, within the Guided Search framework, the conclusion is that orientation guides attention, while T or L junctions do not, and therefore that somewhere between 10 and 25 ms/item there is an important transition. Note further that Guided Search thus explicitly dissociates discriminability from feature guidance (cf. Beck Reference Beck1972; Beck & Ambler Reference Beck and Ambler1973): An easily discriminable visual property is not necessarily a guiding property. This is counterintuitive because one would expect that the visual system will use properties that it finds easily discriminable.
The focus on the shallow end of the search slope spectrum has led to an explanatory gap at the steep end. For example, search for T amongst Ls is considered a prototypical example of a task where differences between target and distractor are at an absolute minimum. Both consist of the same two lines and only the relative position of these lines determines whether an item is a target or a distractor. The associated slope values of 25 ms/item and 50 ms/item (target-present and target-absent, respectively) should therefore constitute an upper limit for the steepness of search slopes. However, Wolfe (Reference Wolfe1998b) reported searches with slopes much steeper than 25–50 ms/item, even up to 100–250 ms/item. This makes additional hypotheses necessary. For example, very slow search may be due to hard to discriminate objects (perhaps requiring serial extraction of features within an item, thus slowing down the car wash), or due to eye movements. Such discriminability and eye movement influences may indeed be fundamental to hard search, but, as we will argue later, the same factors may in fact explain all search slopes. That is, there is no need for additional hypotheses to explain steep slopes, but for a single hypothesis that explains all slopes.
The explanatory gap becomes even wider if one considers that if a slope distinction that suggests qualitative differences actually exists, it appears to occur at the high end of the slope spectrum, at values of around 100 ms/item or more. Up to a few tens of milliseconds per item, search is quite robust against item motion, but very slow search (of 140 ms/item) breaks down when items move (Hulleman Reference Hulleman2009; Reference Hulleman2010; Young & Hulleman Reference Young and Hulleman2013). In contrast, very slow search is robust in gaze-contingent displays where only the fixated item is unmasked, whereas easy to moderate search becomes much slower and more error-prone when the number of unmasked items is reduced (Young & Hulleman Reference Young and Hulleman2013). Easier and very hard search also differs in terms of RT distributions. Young and Hulleman (Reference Young and Hulleman2013) found that for easy (0 ms/item) and intermediate search (±20 ms/item target-present), the standard deviation of the RTs was larger for target-absent trials than for target-present trials (see also the searches of up to about 40 ms/item for target-present in Wolfe et al. Reference Wolfe, Horowitz and Palmer2010a). On the other hand, the pattern is reversed for hard search (±140 ms/item target-present): Here, the standard deviation of the RTs is largest for target-present trials (Young & Hulleman Reference Young and Hulleman2013). Later we will explain what we believe to be the origin of this differential robustness to motion, differential robustness to visible area size and reversal in variability in RTs. The point for now is that the emphasis on the differences at the shallow end of the search slope spectrum has resulted in an underappreciation of the similarities between searches at that end, as well as their differences with searches at the steep end.
4.4. It ignores the eye
Understandably, when trying to explain the difference between feature search and conjunction search, or between guided search and unguided search, researchers have had to control for eye movements as a possible confound. In this sense, eye movements have traditionally been considered a nuisance phenomenon, rather than a crucial component of the search process. Although Treisman and Gelade (Reference Treisman and Gelade1980) acknowledged the role serial fixations may play in search performance, Treisman (Reference Treisman1982) claimed that “serial search […] is centrally rather than peripherally determined; it represents successive fixations of attention rather than eye movements” (p. 205–206), and later iterations of FIT (e.g., Treisman & Sato Reference Treisman and Sato1990; Treisman Reference Treisman1991) no longer mention eye movements. Pashler (Reference Pashler1987), when discussing the possibility that items are processed in clumps rather than individually, decided that this was “not due to eye movements, in any interesting sense” (p. 200). Wolfe (Reference Wolfe and Pashler1998a) shared this view: “While interesting, eye movements are probably not the determining factor in visual searches of the sort discussed in this review – those with relatively large items spaced fairly widely to limit peripheral crowding effects” (p. 14). Similarly, the AET and SDT approaches also did not account for eye movements. Even though these opinions were expressed decades ago, they continue to reflect mainstream thinking in the field.
Many models of search (e.g., Itti & Koch Reference Itti and Koch2000; Wolfe Reference Wolfe and Gray2007) have equated eye movements with covert shifts of attention, in the sense that overt shifts, when executed, simply follow the covert shifts. Stated the other way around, covert visual search is like overt visual search, but without the eye movements. The fact that search can proceed without eye movements is used as an argument that search is de facto independent of eye movements (see Carrasco Reference Carrasco2011, and Eimer Reference Eimer2015, for more recent iterations of this view). This does not mean that these researchers deny that eye movements exist – or influence search – rather, they do not assign eye movements a central, explanatory role in modelling search behaviour. The equating of overt to covert shifts is convenient, as it allows eye movements to be disregarded. Visual search becomes a homogeneous sequence of shifts of attention, with the entire display at its disposal, rather than an amalgamation of different viewing episodes, each with their own start and end point, and each with their own spatial distribution of information. As support, Wolfe (Reference Wolfe and Gray2007) cites studies showing that, with appropriately scaled items, search with and without eye movements is comparable (Klein & Farrell Reference Klein and Farrell1989; Zelinsky & Sheinberg Reference Zelinsky and Sheinberg1997). Yet, because covert shifts are assumed to operate at a faster pace than overt shifts, additional assumptions are needed (Itti & Koch Reference Itti and Koch2000; Wolfe Reference Wolfe and Gray2007). As Wolfe (Reference Wolfe and Gray2007, p. 107) states, “the essential seriality of eye movements can point toward the need for a serial selection stage in guided search.”
We agree that search can occur without eye movements (if the display allows), and that attention can be directed covertly – something we will return to in the General Discussion. However, there are also clear differences between eye movements and covert attentional shifts. The latter are limited by the physiology of the retina, whereas the former are used to surmount those limitations. Emphasising the similarity between eye movements and covert shifts of attention by suggesting that, with appropriately scaled items, searches with and without eye movements yield similar results, ignores the reverse argument, namely that this similarity might not hold in most other situations, where items are typically not appropriately scaled. Under free viewing conditions there is a strong positive correlation between number of fixations and both task difficulty and RT (e.g., Binello et al. Reference Binello, Mannan and Ruddock1995; Motter & Belky Reference Motter and Belky1998a; Young & Hulleman Reference Young and Hulleman2013; Zelinsky & Sheinberg Reference Zelinsky, Sheinberg, Findlay, Walker and Kentridge1995; Reference Zelinsky and Sheinberg1997). Moreover, even when search could proceed without eye movements, participants still prefer to make them (Findlay & Gilchrist Reference Findlay, Gilchrist and Underwood1998; Zelinsky & Sheinberg Reference Zelinsky and Sheinberg1997). The dominant models of search so far do not account for this fact, because they start from the position that successful search can occur without eye movements.
As argued by others (Eckstein Reference Eckstein2011; Findlay & Gilchrist Reference Findlay, Gilchrist and Underwood1998; Reference Findlay, Gilchrist, Jenkins and Harris2001; Reference Findlay, Gilchrist and Underwood2005; Pomplun Reference Pomplun and Gray2007; Rao et al. Reference Rao, Zelinsky, Hayhoe and Ballard2002; Zelinsky Reference Zelinsky1996; Reference Zelinsky2008), the findings listed above suggest that eye movements are a fundamental part of visual search, and that any model without them is necessarily incomplete. We believe that not accounting for eye movements is not simply an omission or a matter of taste, but the logical consequence of adopting the individual item as the conceptual unit in visual search, with further consequences for visual search theory. For example, when eye movements are in principle unnecessary, and simply interchangeable with covert shifts of attention, the increase in number of fixations with increasing search difficulty becomes an epiphenomenon, necessitating the formulation of additional hypotheses – for example, feature binding, differential guidance, or differential attentional dwell times. As we will argue instead, it is more straightforward to assume that search RTs are directly related to the number of fixations. Then all that needs explaining is why some searches yield more fixations than others.
Taking eye movements into account requires acknowledging why they are needed to begin with. Consequently, the assumption that the entire search display is processed with the same detail no longer holds (Eckstein Reference Eckstein2011). This assumption has been crucial to one of the main arguments for item-based feature binding accounts, namely that distinctions made equally easily in foveal vision (T vs. L, / vs. |, 2 vs. 5) yield very dissimilar search slopes (e.g., Wolfe & Horowitz Reference Wolfe and Horowitz2004; Wolfe Reference Wolfe and Gray2007). In other words, the argument here is that perfectly discriminable items nevertheless do not guide attention but instead lead to serial search – hence, feature binding implies item-based processing. However, this ignores the differential drop-off in identification rate for these stimuli across the retina (e.g., He et al. Reference He, Cavanagh and Intriligator1996). Whenever a search display cannot be foveated in its entirety, the relevant question becomes how far into the periphery target detections are possible. The further into the periphery such detections can be made, the fewer eye movements are needed, and the faster search will be. Clear eccentricity effects on visual search RTs have been reported (e.g., Carrasco et al. Reference Carrasco, Evert, Chang and Katz1995; Motter & Belky Reference Motter and Belky1998b; Scialfa & Joffe Reference Scialfa and Joffe1998). But retinal resolution also affects eye movements themselves. Young and Hulleman (Reference Young and Hulleman2013) showed that the distance between fixation location and nearest item depends on task difficulty. The easier the discrimination between target and distractor, the larger this distance was, and the fewer fixations were made.
We already referred to a number of very promising models that have taken the eye (either its movement or its retinal resolution) into account (Geisler & Chou Reference Geisler and Chou1995; Najemnik & Geisler Reference Najemnik and Geisler2008; Pomplun Reference Pomplun and Gray2007; Pomplun et al. Reference Pomplun, Reingold and Shen2003; Rosenholtz et al. Reference Rosenholtz, Huang and Ehinger2012a). Perhaps the most important model in this respect is TAM (Target Acquisition Model; Zelinsky Reference Zelinsky2008; Zelinsky et al. Reference Zelinsky, Adeli, Peng and Samaras2013). TAM is a pixel-based approach that was explicitly developed to model eye movements, rather than RTs. It has been very successful in explaining eye movement patterns in visual search, including fixation of empty regions to maximize population based information (Zelinsky Reference Zelinsky2012; Zelinsky et al. Reference Zelinsky, Adeli, Peng and Samaras2013). However, until now, all of these models have been models of fixations. They do not model slopes of manual RT functions or RT distributions, although it should not be too difficult to extend them and accommodate those measures (see Zelinsky & Sheinberg Reference Zelinsky, Sheinberg, Findlay, Walker and Kentridge1995 for an early proposal). Furthermore, in contrast to item-based models, fixation-based models have often focused on the difficult end of the search spectrum, using displays with targets that are very similar to the background or distractors, This is probably no coincidence, because it is these types of searches that are guaranteed to generate eye movements. In the next section, we will present a general framework intended as a bridge between eye movements and manual responses in search, across a range of search difficulties.
5. The solution: Towards fixation-based, rather than item-based search
So far, the main quest of visual search theories has been to account for the more central perceptual limitations affecting the search process, from feature binding to top-down guidance, from covert selection to inhibition of items, and from staggered serial (car wash) processes to post-selection bottlenecks. These limitations have been expressed as limitations of selecting and processing individual items. We agree that such central limitations on visual selection are important. However, the evidence reviewed suggests that the emphasis on individual items is becoming counterproductive, because (1) it obscures other theoretical possibilities that may be at least equally likely (e.g., using population-based signals), (2) it ignores earlier influences on the visual selection process that, because of ingrained physiological and other processing limitations, can be expected to have at least as profound an influence on visual selection as any central limitations, and (3) it has focused the research effort on easier search tasks to the detriment of further theoretical gains that harder search tasks could provide.
We believe that all components are in place for an overarching framework of visual search. One strand of the literature has provided models for RTs, while another strand has provided models for fixation behaviour. Although there have been fruitful attempts to link them (Geisler & Chou Reference Geisler and Chou1995; Zelinsky & Sheinberg Reference Zelinsky, Sheinberg, Findlay, Walker and Kentridge1995), these two strands appear to have grown further apart since. Making a link is not just a matter of combining the two strands. One type of model denies a pivotal explanatory role for eye movements in search, while the other type considers them crucial. Thus, any overarching conceptual framework will require a fundamental, principled choice. We choose a framework that favours fixations, rather than individual items, as the conceptual unit of visual search. This has several advantages: Adopting fixations as the conceptual unit allows all kinds of displays into the visual search fold, including real world scenes and X-rays, rather than only those with clearly defined items. It also obviates the distinction between textures and search displays. A corollary of emphasizing the role of fixations in visual search is that retinal physiology becomes more important. This seems appropriate, because the maximum distance into the periphery where targets can be detected appears to be a major determiner of search times. Finally, a fixation-based framework allows for a much wider range of search slopes to be encompassed than the 0–50 ms/item on which the literature has typically focused. At the same time, adopting fixations as the unit of visual search does not negate the possibility of covert shifts of attention – something to which we will return in the General Discussion.
5.1. Functional Viewing Field
Central to the proposed framework is the Functional Viewing Field. As others have pointed out (see Eckstein Reference Eckstein2011 for a review), retinal constraints are not the only limits on peripheral vision: Competition between representations occurs at many levels beyond the retina. For example, there are limits on attentional selection beyond that expected on the basis of visual acuity (Intriligator & Cavanagh Reference Intriligator and Cavanagh2001). There are also well-known effects of crowding and masking, where a stimulus – including simple features – that is perfectly recognizable on its own severely suffers when surrounded by other stimuli (Bouma Reference Bouma1970; Levi Reference Levi2008; Neri and Levi Reference Neri and Levi2006; Pelli et al. Reference Pelli, Palomares and Majaj2004; Põder Reference Põder2008; Põder & Wagemans Reference Põder and Wagemans2007). Even when limits to retinal and attentional resolution are taken into account, there remains a general bias to attend more to central items (Wolfe et al. Reference Wolfe, O'Neill and Bennett1998). Wolfe et al. (Reference Wolfe, O'Neill and Bennett1998) argued that attention may follow the physiological constraints, such that areas of the retina that deliver the most information (i.e., the fovea) receive most attention. Therefore, observers may not always make eye movements out of bare necessity, but also out of efficiency or convenience. Furthermore, Belopolsky and Theeuwes (Reference Belopolsky and Theeuwes2010) have argued for a flexible “attentional window.” They reasoned that very easy search allows for a broad, more peripheral window, whereas hard search calls for a narrower, more foveal window.
The combination of peripheral constraints on perceptual and attentional resolution creates what has since the 1970s become known as the functional viewing field, FVF (Sanders Reference Sanders1970), the area of visual conspicuity (Engel 1971), visual span (Jacobs Reference Jacobs1986; O'Regan et al. Reference O'Regan, Lévy-Schoen and Jacobs1983), or useful field of view, UFOV (Ball et al. Reference Ball, Beard, Roenker, Miller and Griggs1988). We will use FVF here and define it as the area of the visual field around fixation from which a signal can be expected to be detected given sensory and attentional constraints. Importantly, the FVF is not fixed but changes with the discriminability of the target. The less discriminable the target, the smaller the FVF, and the more fixations are needed to find the target. Hence, targets that are difficult to discriminate lead to longer search times. This even holds for search without eye movements, because targets that are less distinguishable from distractors will suffer relatively more from additional distractors, especially in the periphery where discriminability will be lowest.
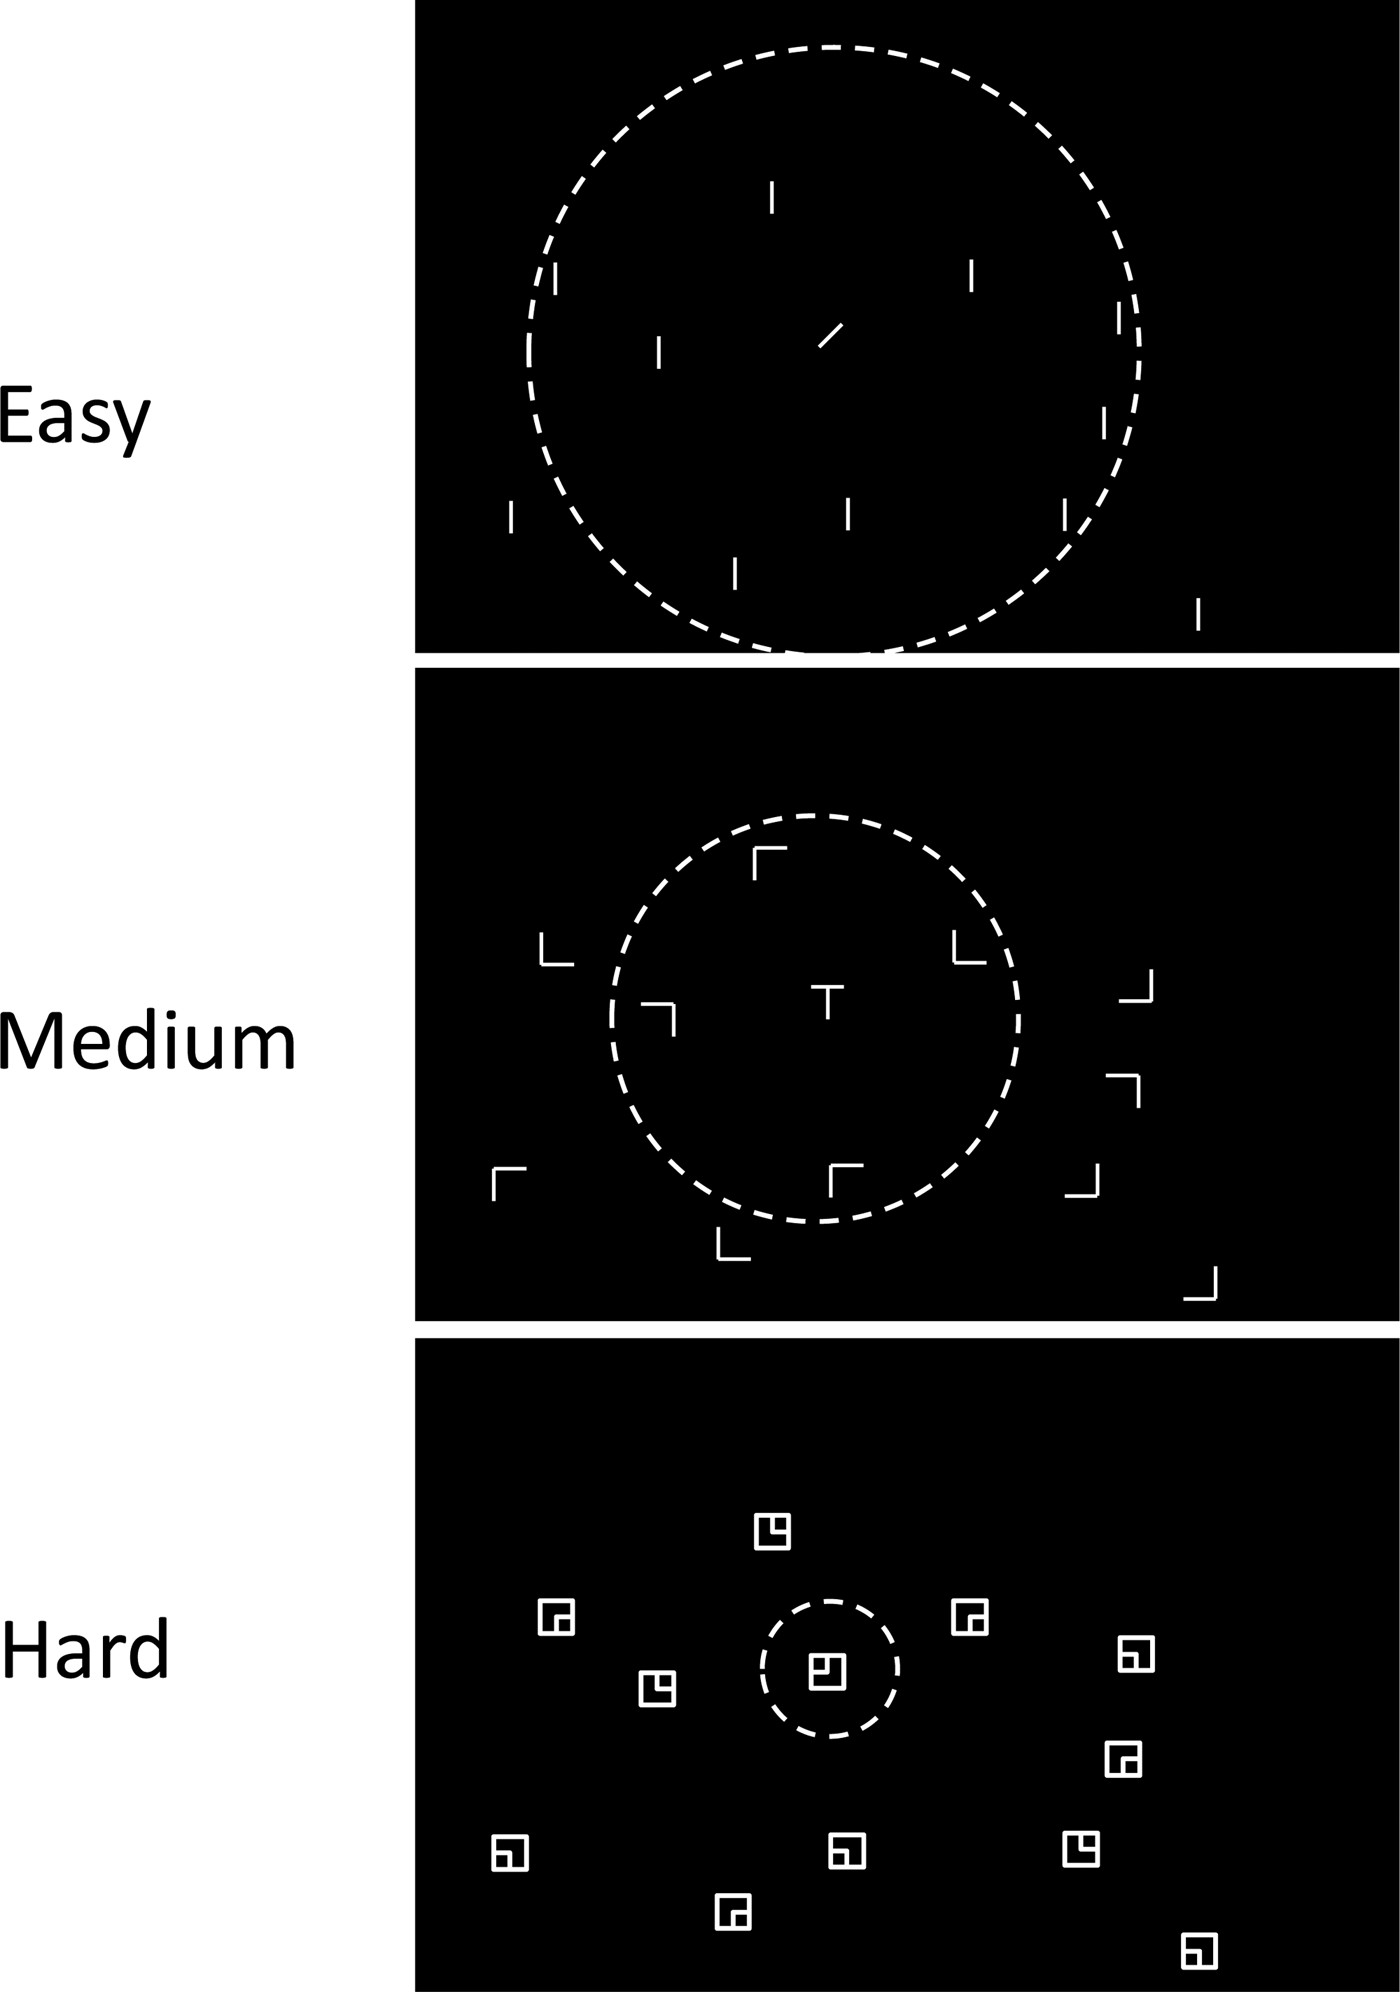
Direct support for the idea that FVF size distinguishes easy from hard searches comes from Young and Hulleman (Reference Young and Hulleman2013), who masked peripheral information in a gaze-contingent design. The size of the unmasked region around fixation was varied from relatively large (about 10 degrees radius), to medium (about 5 degrees radius), to small (about 2.5 degrees radius). Easy search for a diagonal bar amongst vertical bars became much slower and more error-prone when the size of the visible area was reduced, consistent with the idea that it normally benefits from a large FVF. However, very hard search for a specific configuration of squares hardly suffered at all, even when the visible area was reduced to 2.5 degrees radius – consistent with the idea that for this type of search the FVF was already small to begin with (see Fig. 1 for examples of the easy, medium and hard task used in Young & Hulleman Reference Young and Hulleman2013, together with the estimated FVF).
Examples of the tasks used in Young and Hulleman (Reference Young and Hulleman2013), drawn to scale. Top: easy search for a diagonal amongst vertical; Middle: medium search for a T amongst L; Bottom: hard search for a square with a small square in the left top corner amongst squares with a small square in one of the other corners. The dotted circle represents the estimated FVF for each of the three tasks.
We stress that the idea that the FVF affects visual search is not new. Engel (Reference Engel1977), as well as Geisler and Chou (Reference Geisler and Chou1995), already showed strong correlations between FVF, eye movements and overall RTs (although they did not assess RT slopes and variability). Ball et al. (Reference Ball, Beard, Roenker, Miller and Griggs1988) reported effects of age-related changes in FVF on visual search. In his reviews of 1998b and 2003, Wolfe acknowledged the FVF as an alternative way of conceptualizing visual search. Findlay and Gilchrist (Reference Findlay, Gilchrist and Underwood1998) also mentioned the FVF as a likely contributing factor to target salience. Nevertheless, somehow the FVF has yet to acquire a firm foothold in mainstream theories of visual search and their computational implementations. We will demonstrate here that the FVF can be considered central to explaining search behaviour, be it eye movements or manual responses. It is not some side effect that at best modulates search but under most circumstances can be safely ignored.
5.2. A simple conceptual framework
As proof of principle we present a simulation of a fixation-based conceptual framework. We deliberately opted for a high-level implementation with only five parameters (four of them fixed), to allow an emphasis on the crucial role that the size of the FVF plays in explaining search slopes and the distributions of both RTs and number of fixations. Thus, the implementation is formulated at a computational level (what are the outcomes) rather than at an algorithmic level (what are the mechanisms; cf. Marr Reference Marr1982). Specific mechanisms that do not rely on individual items and non-crucial parameters (such as guessing rates and reaction time constants) will need filling in by more detailed algorithms. In fact, some of the details have already been specified in more mechanistic models. What we aim to show here is that connecting the dots leads to a promising overarching theoretical framework.
-
1. A functional visual field. The main assumption of the framework is an FVF. Its size varies with target discriminability. The more difficult the distinction, the less far into the periphery it can be made (Smith & Egeth Reference Smith and Egeth1966). For example, the FVF for diagonal amongst vertical is larger than for T among L (e.g., Rosenholtz et al. Reference Rosenholtz, Huang and Ehinger2012a). As a consequence, fewer fixations will be needed to cover the search display. In our current simulation we have adopted the number of items comprehended at once (c.f. the clumps in Pashler Reference Pashler1987; and the variable number model in Zelinsky & Sheinberg Reference Zelinsky, Sheinberg, Findlay, Walker and Kentridge1995) as a proxy FVF size, although it is properly expressed in terms of visual angle (see Young & Hulleman Reference Young and Hulleman2013 for estimates). One may find it odd that we propose an alternative to item-based accounts that is in itself based on items, rather than on a spatial field of view. However, as Figure 1 illustrates, for displays that consist – after all – of items, a spatially limited array of a particular size directly corresponds to a particular number of items. Thus, while using the number of items is a rather crude approximation, it suffices for our current purpose, the simulation of FVFs of different sizes. In our simulation, we assume that the FVF always contains at least one item (the minimum). The maximum it can contain depends on target discriminability. For very easy (“pop out”) search, we assume a maximum of 30 for our displays. For search of intermediate difficulty, the maximum is 7, and for very hard search it is 1. These maximum values were chosen to fit the target-present slopes of the search tasks we simulate. Given that search displays are rarely completely homogeneous, and the FVF certainly is not, the actual number of items processed within a given fixation fluctuated randomly between the minimum and the maximum, sampled from a uniform distribution. This fluctuation also provides an abstract representation of some of the spatial aspects of the FVF, for instance items that fall in both the previous and current FVF.
-
2. Parallel processing of items within the FVF. Unlike item-based approaches, we assume no additional covert attentional item-to-item shifts within the FVF. Items are assumed to be processed collectively, for example on the basis of pooled statistics (Rosenholtz et al. Reference Rosenholtz, Huang and Ehinger2012a) although any other mechanism that selects items as a group rather than individually would be compatible with our framework. Yet, information may come at different rates within the FVF because the FVF is not homogeneous (cf. Findlay & Gilchrist Reference Findlay, Gilchrist and Underwood1998). It is the rate of information accrual in the periphery that is key here, as by definition it determines the FVF, and thus the fixation strategy. Observers may also eventually select individual items. They will do so if the task so requires, for example in compound search. For this, a global search for the target-defining feature may be followed by a local search for the response-defining feature. These different features are likely to have different FVFs, thus requiring different fixation precision. How the system switches between features is currently not captured by the framework, but it does provide a fruitful way of thinking about this problem: as a transition from large to small FVFs.
-
3. Fixations of constant duration. When the FVF does not encompass the entire search display, multiple fixations are required. Fixations are of constant duration, 250 ms. This estimate is based on work reporting only a limited relation between fixation duration and target discriminability in typical search displaysFootnote 1 (Findlay Reference Findlay1997; Gilchrist & Harvey Reference Gilchrist and Harvey2000; Hooge & Erkelens Reference Hooge and Erkelens1996; Over et al. Reference Over, Hooge, Vlaskamp and Erkelens2007). Fixation duration does not vary with target discriminability. Rather, both the number and distribution of fixations vary with the changing size of the FVF.
-
4. Limited avoidance of previously fixated areas of the display. Avoidance of previously fixated locations improves the efficiency of search (Klein Reference Klein1988). But visual search has only limited memory for previously fixated locations (e.g., Gilchrist & Harvey Reference Gilchrist and Harvey2000; McCarley et al. Reference McCarley, Wang, Kramer, Irwin and Peterson2003). Young and Hulleman (Reference Young and Hulleman2013) also reported revisits to items, even for small display sizes. For the current simulations, we held the number of previously fixated locations that are avoided constant at four (see McCarley et al. Reference McCarley, Wang, Kramer, Irwin and Peterson2003). So, given enough subsequent fixations, locations will become available for re-fixation. Because the FVF may contain multiple items, many more than four items might be inhibited during search, because we assume the fixation location, not individual items, to be inhibited.
-
5. A stopping rule. Search is seldom completely exhaustive (Chun & Wolfe Reference Chun and Wolfe1996). From their eye movement data, Young and Hulleman (Reference Young and Hulleman2013) estimated that irrespective of display size around 15% of the search items were never visited. For the current simulations the Quit Threshold – the proportion of items to be inspected before search was terminated with a target-absent response – was therefore fixed at 85%. Again, more detailed models have to specify actual stopping mechanisms. Our simulation merely assumes that it is possible to keep track of the proportion of items inspected.
Figure 2 shows a flow diagram of the conceptual framework with its five parameters: Minimum number of items in FVF, Maximum number of items in FVF, Fixation duration, Quit Threshold, and Number of fixation locations avoided. The parameters are represented by ellipses, and dashed lines connect them to the parts of the search process that they control. As input, the framework takes the values for the five parameters, plus the number of simulations required and the to-be-simulated display size. Moreover, of these five parameters, only the maximum number of items in the FVF was variable. The other four parameters were held constant across all simulations. As output, the simulation gives mean and standard deviations for RTs and number of fixations, proportion error on target-present and target-absent trials and frequency counts for the RTs. Each time a new patch of the display is fixated, the fixation duration is added to the total RT. Thus, the RT for a trial is simply the number of fixations multiplied by their (constant) duration. Although this yields individual trial RTs that are multiples of 250 ms, this is sufficient for our present purposes.
Flow diagram of the conceptual framework. Please see the text for an explanation. For the simulations reported in this paper, the values for the parameters (ellipses in the flow diagram) are printed in bold: Fixation Duration: 250 ms; Quit Threshold 85%; Memory for previously fixated areas: 4. Minimum number of items processed per fixation: 1. For the simulations of easy, medium and hard search, the maximum number of items processed per fixation equalled 30, 7 and 1 respectively.
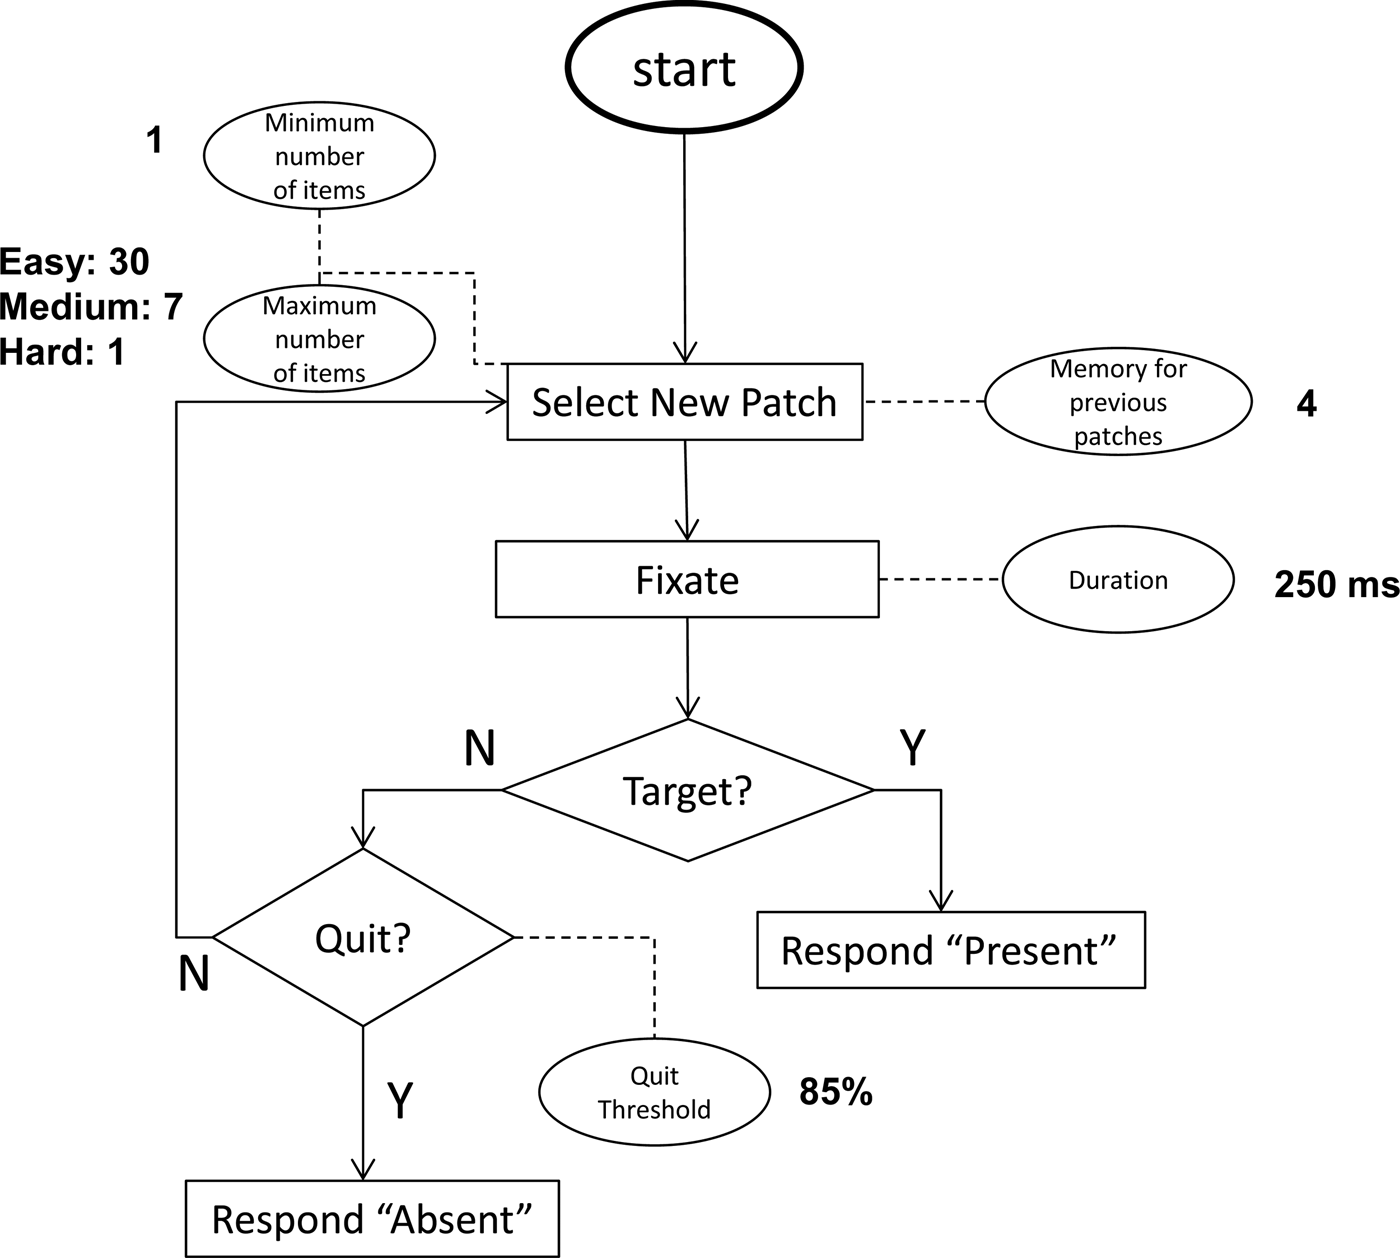
A simulated trial starts by selecting a patch of the display. The current implementation is purely conceptual and does not take images or even lists of features as its input. Instead, search displays are represented as an array of items (effectively, a string of 0's). One of these items is randomly chosen to be the target (and turned into a 1). Again, we point out that for displays that consist of items, this sufficiently simulates a spatial FVF (see Fig. 1). Fixations are implemented as selections from this array, where the number of items selected per fixation depends on the size of the FVF (this number randomly falls between the minimum and maximum for the FVF). If a selection contains the target, search terminates with a target-present response. If the target has not been found, another patch of the display is selected, unless the stopping criterion is met and 85% of the items in the search display have been processed. In this case, the trial terminates with a target-absent response.
We ran Monte Carlo simulations with 10,000 repetitions for each combination of task difficulty, target presence, and display size.
5.3. Simulating the main findings in visual search
The visual search literature is extremely rich, reporting a range of findings too wide to treat comprehensively here. We focus on what we see as the central variables, namely manual RTs and their corresponding search slopes, errors, and fixations, for both present and absent trials. As argued by others, (e.g., Moran et al. Reference Moran, Zehetleitner, Müller and Usher2013; Wolfe Reference Wolfe and Gray2007), this should be done not only in terms of averages, but also in terms of distributions, because different ranges of behaviour can lead to the same average and thus distributions provide additional information on the underlying process. Of course, any such selection of variables carries a degree of subjectivity, and we refer to Wolfe (Reference Wolfe and Gray2007), for a list of eight core wishes, some of which return here and some others that we regard secondary to the present purpose. We stress again that what we present here is a proof of concept, establishing the viability of our framework, rather than a formal fit of a specific model.
5.3.1. Slopes of average RTs and number of fixations
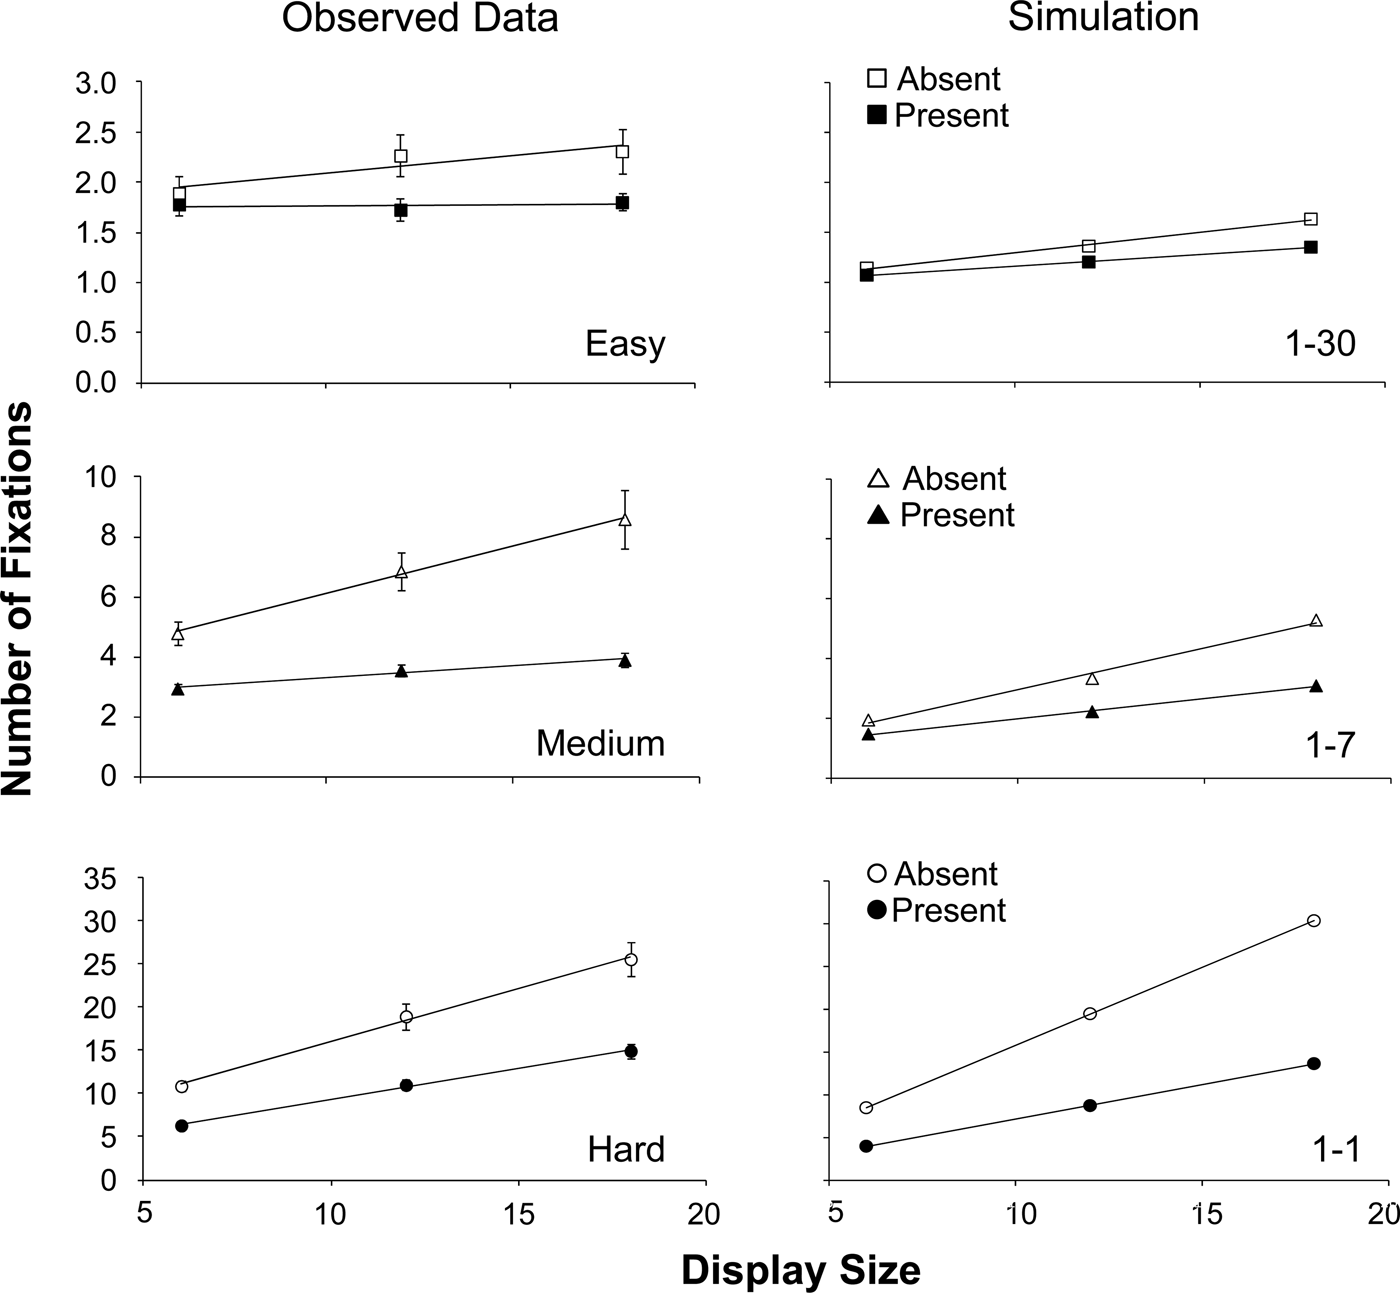
Figure 1 shows the stimuli used by Young & Hulleman (Reference Young and Hulleman2013) that yielded data (Figs. 3–6) that in our view are representative for a range of classic visual search tasks, from very easy, via medium difficulty to outright hard. Exactly by choosing standard laboratory search displays with individual items (rather than e.g., real world scenes), we can demonstrate that our approach is a viable replacement for item-based approaches. We point to Zelinsky and Sheinberg (Reference Zelinsky, Sheinberg, Findlay, Walker and Kentridge1995) for an earlier conceptual expression of this idea (though without simulations). Figure 3 shows RT data, Figure 4 shows the SDs for the RTs, Figure 5 shows the number of fixations, and Figure 6 shows the SDs for the number of fixations. Please note the similarity between the patterns for RTs and numbers of fixations. Alongside the experimental data in Figures 3–6, the simulated data are shown. The simulated patterns for RTs and fixations are largely equivalent, because the framework simply assumes that fixations drive the RTs, and fixation duration is held constant. The small differences between RTs and fixation numbers stem from the fact that only correct trials were included for RTs, whereas we included all trials for the fixations (following Young & Hulleman Reference Young and Hulleman2013). All in all, with one free parameter, the simulation qualitatively captures the data pattern for both RTs and fixations. For the RTs, it yields flat search slopes in easy search, and intermediate to outright steep search slopes in medium and hard search. Moreover, for both medium and hard search, the slopes are considerably steeper for the target-absent than for the target-present trials. For the fixations, our simulation replicates the finding that target-absent trials in hard search are the only condition where the number of fixations exceeds the number of items (Fig. 5).
Mean RTs as function of display size. The error proportions are printed next to the symbols and the search slopes can be found on the right of the graphs. Left: Results from Young and Hulleman (Reference Young and Hulleman2013). The error bars indicate between-participant SEM. In the easy search task, participants searched for a / among |. In the medium difficulty search task they searched for a T amongst L. In the hard search task, the target was a square with a smaller square in the left top corner amongst squares with a smaller square in one of the other corners. Right: Results from the simulation. In the easy search task, 1–30 items were processed per fixation. In the medium task, 1–7 items were processed. In the hard task 1 item was processed per fixation. Top row: overview of the RTs. Second row: easy search. Third row: medium search. Bottom row: hard search. Open symbols: target-absent; closed symbols: target-present.

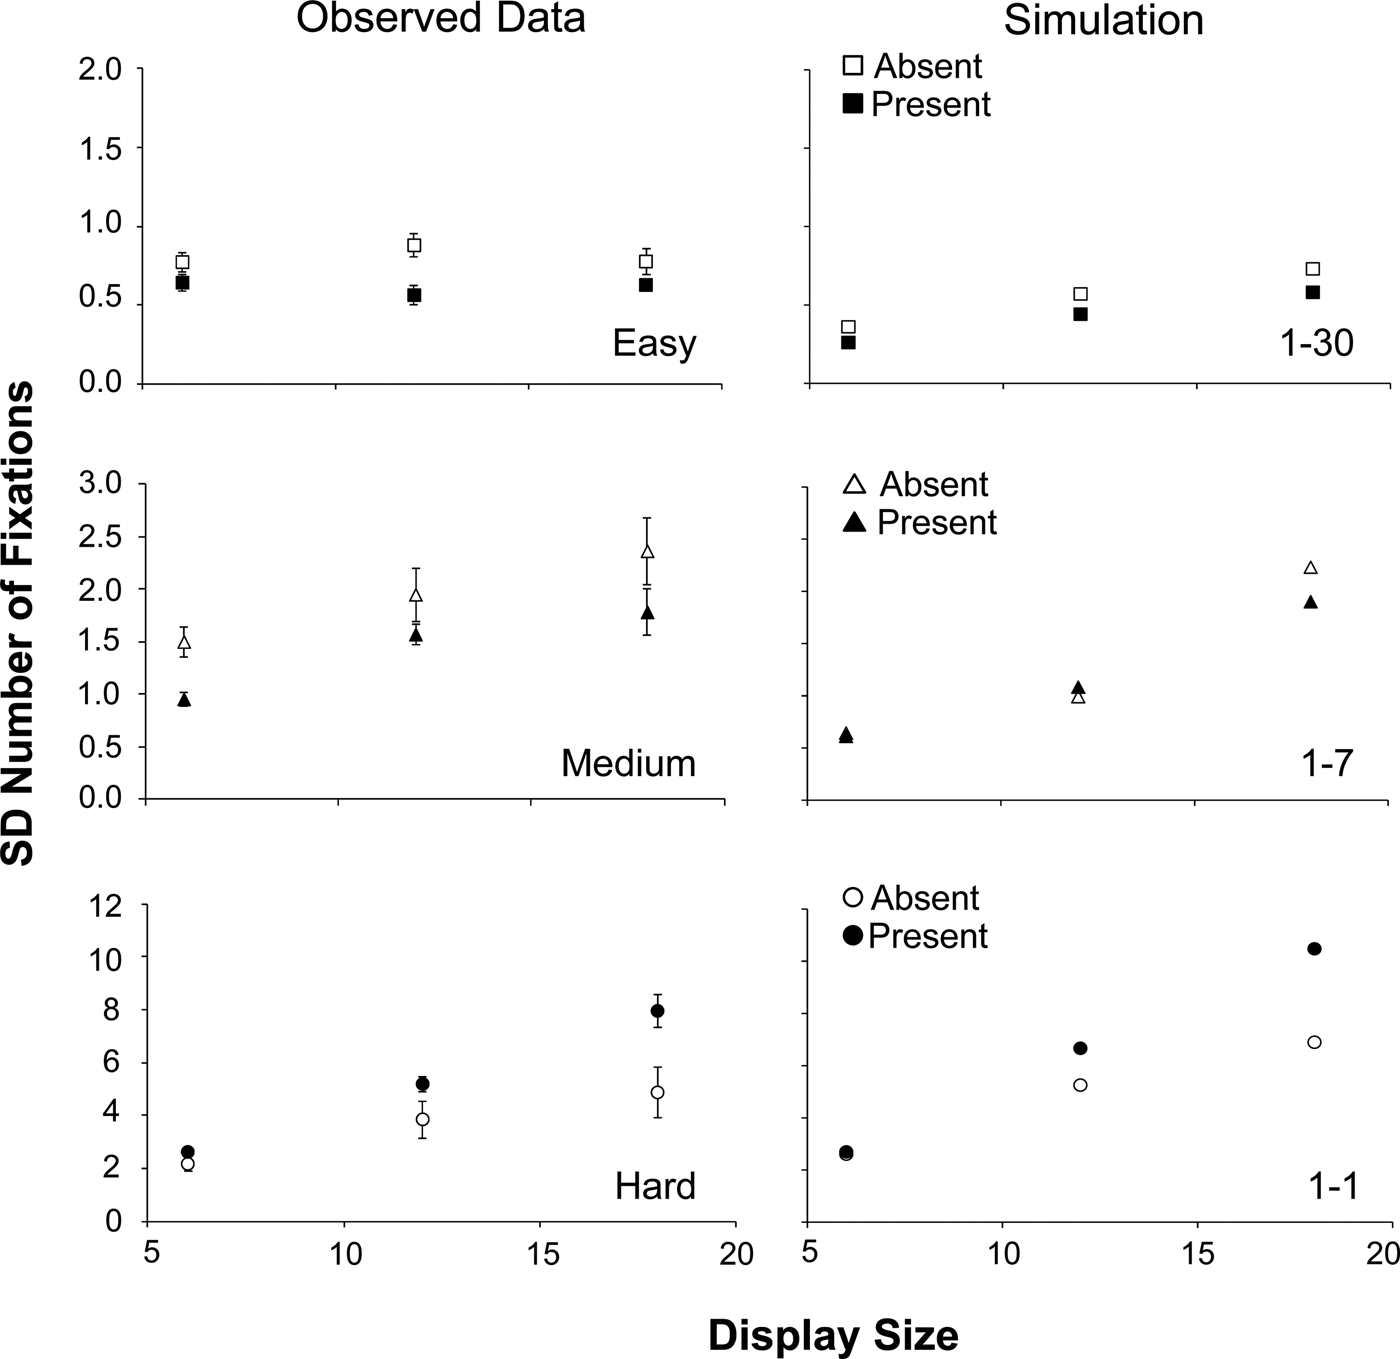
SDs of the reaction times as a function of display size. Left: Results from Young and Hulleman (Reference Young and Hulleman2013). Right: Results from the simulation. Top row: easy search. Middle row: medium search. Bottom row: hard search. Open symbols: target-absent; closed symbols: target-present.

Number of fixations as a function of display size. Left: Results from Young and Hulleman (Reference Young and Hulleman2013). Right: Results from the simulation. Top row: easy search. Middle row: medium search. Bottom row: hard search. Open symbols: target-absent; closed symbols: target-present. For the results from Young and Hulleman (Reference Young and Hulleman2013), the error bars indicate SEM.
SDs of the number of fixations as a function of display size. Left: Results from Young and Hulleman (Reference Young and Hulleman2013). Right: Results from the simulation. Top row: easy search. Middle row: medium search. Bottom row: hard search. Open symbols: target-absent; closed symbols: target-present.
The simplicity of our current stopping rule leads to an overestimation of the target-absent slopes in hard search (Fig. 3). Because there is only one item in the FVF and a location is allowed to be fixated any number of times as long as it is not among the last four fixated locations, the simulation has problems reaching 85% by finding the items it has not yet visited, especially for the largest display size. This also becomes clear from the fixations: the number of fixations in the largest display size is overestimated, too (Fig. 5). Clearly, a more sophisticated stopping rule is necessary.
5.3.2 Errors
The simulation yields fairly good estimates for the error rates across the search difficulties. It also captures the increase in error rates for very difficult search (Figure 3).Footnote 2 Because the simulation does not contain a guessing parameter, it always terminates with a target-absent response when it has not found the target. Because this is the correct answer for a target-absent display, the simulation necessarily predicts perfect performance on target-absent trials.
5.3.3 Variability and distributions
The variability of RTs has been problematic for serial item-based accounts, which predict that RTs in target-absent trials will be less variable than RTs in target-present trials. Target-absent decisions can only be made after the last item has been inspected, but a target-present response can be given as soon as the target has been found. Target-absent responses will therefore cluster around the time point of the inspection of the last item. But target-present responses will have more variable RTs, because the target might be the first item selected, the last item selected or any item in between. Yet, target-absent trials are typically more variable than target-present trials (e.g., Wolfe Reference Wolfe1994; Reference Wolfe and Gray2007). Guided Search 4.0, has solved this problem, and reproduces the correct variability pattern. Because item-based accounts like Guided Search already consider search for T among L purely item-by-item, they predict that the medium and hard task will both have more variability in target-absent RTs. However, Figure 4 shows that this only holds for medium search. For hard search, RT variability is largest in target-present trials. This pattern is repeated for the number of fixations (Figure 6). Note that this qualitative similarity in the variability of RTs and number of fixations is in keeping with our framework.
As becomes clear from Figures 4 and 6, the simulations capture almost all important aspects of this variability pattern. For hard search, target-present trials show more variability in RTs and number of fixations than target-absent trials, and this difference increases with set size. For medium search, especially at the largest display size, the reverse is found. Here, target-absent trials are more variable for both RTs and number of fixations. For easy search, larger variability for target-absent trials is found for all display sizes.
It is striking that our naïve simulation replicates the reversal from larger variability for target-absent trials in easy and medium search to larger variability for target-present trials in hard search. This suggests that it succeeds in capturing a crucial aspect of the search process: namely that the size of the FVF increases as search becomes easier.
When the FVF contains multiple items, the difference in RT-variability between target-absent and target-present trials becomes smaller, because the range of time points at which the target is found is reduced substantially. Rather than increasing with the number of items, variability on target-present trials will only increase with the number of fixations. Moreover, the variability of target-absent trials changes less, because the RTs will remain clustered around the time of the fixation that inspects the last items. Consequently, FVFs large enough to contain multiple items selectively decrease the variability in target-present trials.
Furthermore, limited memory for previously fixated locations increases the variability of target-absent trials more. Re-fixations are a source of RT variability, because any number can occur during a search trial. However, the fewer fixations are made to begin with, the fewer re-fixations there will be and the less variability they will add to RTs and number of fixations. Because more time is spent in the search display when there is no target, target-absent trials are more prone to this effect. This combination of FVFs containing multiple items and limited memory enables our simulation to overcome the inherent tendency of target-present trials to be more variable (because it remains the case that the target can be found during any fixation) whenever search is not too hard.
When search is hard, both these factors lose their influence. First, the FVF contains only a single item. This substantially increases the range of time points at which the target can be found, thereby increasing the variability in RTs for target-present trials. Second, even on target-present trials so many fixations are made that the limited memory for previously visited locations no longer prevents re-fixations.
We also looked at the specific shape of the RT distributions. Figure 7 shows experimentally observed RT distributions for an easy, a medium and a hard task, together with the RT distributions based on our simulations. (We used data from Wolfe et al. Reference Wolfe, Horowitz and Palmer2010a for the easy and medium task rather than the Young and Hulleman Reference Young and Hulleman2013 data because the former is based on many more trials per participant.) As Figure 7 shows, the patterns for both sets of data are essentially identical. Across the search difficulties, our simulation captures the distributions for target-present trials fairly well. For easy search, it replicates the narrow single-peaked distribution from Wolfe et al. (Reference Wolfe, Horowitz and Palmer2010a), although there is some widening for the largest display size. For medium search, the simulation replicates both the narrowness of the RT-distribution for the smallest display size and its widening for larger display sizes. For hard search, the simulation yields the relatively narrow distribution of the smallest display size and the very wide distributions for the larger display sizes.
Left: Experimentally observed RT-distributions. Right: Simulated RT-distributions. Top: easy search (red vertical amongst green verticals, search slopes 1.0 and 0.7 ms/item for target-present and target-absent, respectively) reproduced from the Wolfe et al. (Reference Wolfe, Horowitz and Palmer2010a) data set. Simulated FVF: 1–30 items. Middle: medium difficulty search (spatial configuration search -2 amongst 5's-, search slopes 43 and 95 ms/item for target-present and target-absent, respectively) reproduced from the Wolfe et al. (Reference Wolfe, Horowitz and Palmer2010a) data set. Simulated FVF: 1–7 items. Bottom: Hard search task (square with smaller square in left top corner amongst squares with smaller square in other corner, search slopes 139 and 289 ms/item for target-present and target-absent, respectively) based on the data of Young and Hulleman (Reference Young and Hulleman2013). Simulated FVF: 1 item. Solid lines: target-present trials. Dashed lines target-absent trials. Bin size: 250 ms.
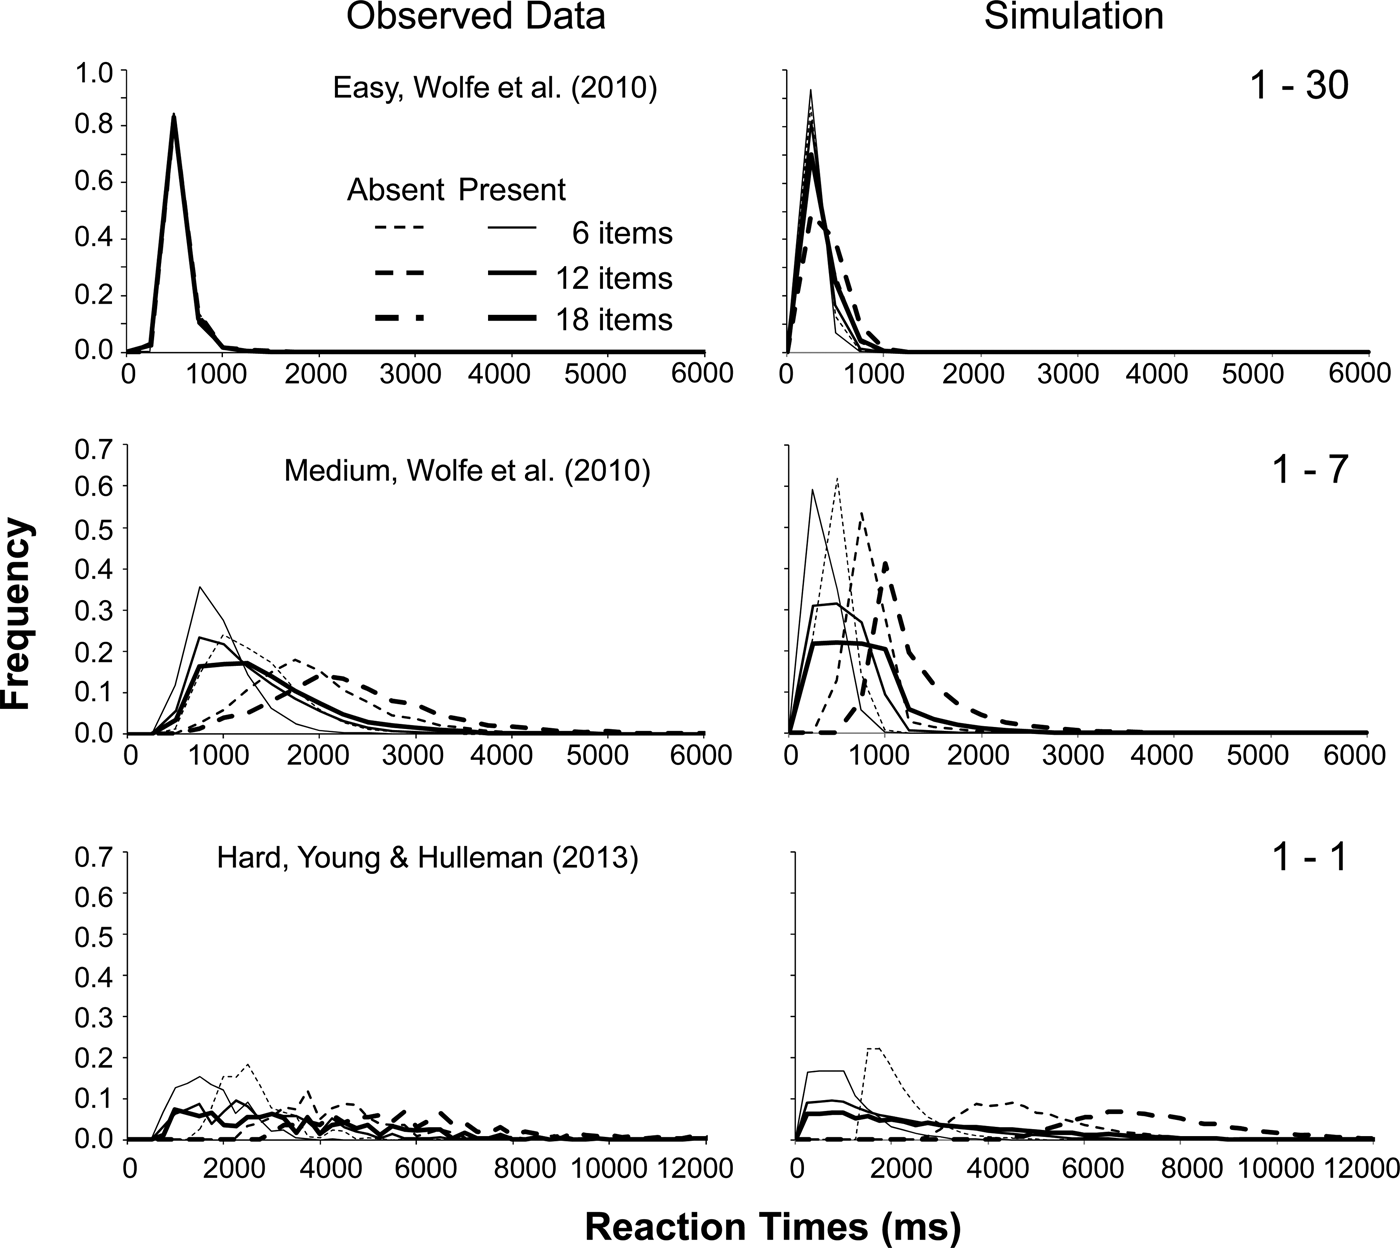
For target-absent trials, although the fits are somewhat less neat, the framework again captures important qualitative aspects. For easy search, the simulation produces the narrow, peaked distribution for the smaller display sizes, although the distribution widens a little for the largest display size. For medium search, the RT-distributions widen with increasing display size, accompanied by a decrease in the mode of the distribution. However, the distributions are not dispersed widely enough around the mode. For hard search, the fit is relatively good: the mode of the distribution for the smallest display size is largest and fairly well-defined, whereas the modes for the larger display sizes are less clearly defined.
The poorer fit of the simulated to the actual target-absent distributions is, again, probably a result of the simplicity of our stopping criterion. Because the target-absent decision is a strategic one, where participants have to take into account a variety of factors, it is unlikely to be fully captured using a stopping rule as simple as the one used here. We will return to this in the General Discussion.
6. General discussion
There are many different models of visual search, each explaining a fair part of the search process. The most popular ones were designed to account for the mean RTs and error rates observed in search experiments (e.g., FIT, Guided Search, AET). Recent attempts also accurately account for the distribution of RTs (e.g., Wolfe Reference Wolfe and Gray2007; Moran et al. Reference Moran, Zehetleitner, Müller and Usher2013), while others focused on eye movement patterns in visual search (e.g., Najemnik & Geisler Reference Najemnik and Geisler2008; Pomplun Reference Pomplun and Gray2007; Zelinsky Reference Zelinsky2008). So, none of the individual elements of the framework we propose here is new, and much of the hard work has been done by others. However, further progress appears to be stymied. Those models that focus on RTs consider eye movements to be a sideshow. And although we believe that the models that focus on eye movements should be able to account for RT slopes too, so far they appear to have been hesitant to do so (see Zelinsky & Sheinberg Reference Zelinsky, Sheinberg, Findlay, Walker and Kentridge1995, for an exception). We argue that further development of current models is hindered by the implicit but dominant view that the individual item is the conceptual unit of visual search, and that therefore (1) the shallow end of the search slope spectrum is the most informative, and (2) eye movements are a nuisance variable to be controlled rather than a crucial theoretical component of the search process. These implicit assumptions have prevented current models from explaining all aspects of search, from eye movements to manual RTs, from errors to distributions, from present to absent responses, and from very hard to very easy search. We hope that our simulation has shown that an approach to visual search that abandons these implicit assumptions has a lot of descriptive power, and holds the promise of uniting the wide range of findings into a single framework. With only five parameters, the framework provides integrated and qualitatively accurate predictions of the means and variability of RTs and number of fixations, as well as error rates for a variety of search tasks. The framework thus appears to have achieved the goal of uniting manual and oculomotor behaviour.
In particular, our simulations suggest that rather than being a reflection of the selection rate of individual items, search slopes can be the consequence of the interaction between a constant fixation duration and the size of the FVF. The simulation shows that with appropriately chosen FVF sizes, the framework covers the entire range of observed search slopes, from 0 ms/item to 150 ms/item for target-present, without having to change any other fundamental assumptions. Despite earlier debates (Eckstein Reference Eckstein2011; Findlay & Gilchrist Reference Findlay, Gilchrist and Underwood1998; Zelinsky & Sheinberg Reference Zelinsky, Sheinberg, Findlay, Walker and Kentridge1995), the emphasis on items as the conceptual unit in visual search seems to have led to an enduring misinterpretation of search slopes. We believe our simulation now provides a compelling argument for abandoning the stance that search primarily revolves around individual items.
6.1. RTs and variability
According to Wolfe et al. (Reference Wolfe, Horowitz and Palmer2010a), successful models of visual search should describe both mean RTs and their variability. To capture the fact that target-absent trials are more variable than target-present trials in a search of moderate difficulty (for 2 amongst 5), Guided Search 4.0 had to adopt a new item selection mechanism compared to its predecessors. However, because it is item-based, the model also predicts that larger variability in target-absent trials should be found across the entire range of search difficulties. But when search becomes very hard there is a crossover, and target-present trials become more variable.Footnote 3 It is especially this crossover in variability that is not trivial to capture in item-based models of visual search. Recently, Moran et al. (Reference Moran, Zehetleitner, Müller and Usher2013) have presented an extension of Guided Search that is also capable of reproducing the RT-variability patterns that are observed in medium difficulty search and easy search (albeit with separate sets of 8 fitting parameters each). It would be interesting to see whether the same model can cope with the inversion of the RT-distributions in very hard search. Here our framework appears to make unique predictions.
We hold that the difficulties or even the failure of these models to capture the distributional aspects of RTs in visual search is a direct consequence of the implicit assumption that the individual item is its conceptual unit. Our simulation shows that this may be the case for a very hard search, but for most searches, including that for T amongst Ls, the data pattern is best captured if one assumes that the FVF covers multiple items. This assumption allows the other factors that influence termination of target-absent trials to increase RT-variability to such an extent that it becomes larger than in target-present trials. By themselves these factors are not enough, as is demonstrated by the larger variability in target-present trials when the FVF only covers a single item. Thus, the adoption of the individual fixation as the conceptual unit offers a promising way to capture RT-distributions (and distributions of number of fixations for that matter) across the entire range of search difficulties.
Even if item-based models were to successfully fit the RT distributions and the error rates across a wide range of search difficulties, we would still argue that fixations should be preferred over an item-based selection rate because this choice increases explanatory power while maintaining relative simplicity. There is a direct link between number of fixations and RTs in our framework. The rate of selecting new parts of the search display is fixed at 250 ms, and has a clear basis: it is how long the eyes remain steady. This sets it apart from models of rapid serial covert shifts of attention like Guided Search and AET. These would need additional assumptions to incorporate eye movements. The need for a direct link becomes clear when RTs are plotted as a function of number of fixations (Figure 8): There is an almost perfect linear relationship, irrespective of set size, presence of the target, or difficulty of the search task (see also Zelinsky & Sheinberg Reference Zelinsky, Sheinberg, Findlay, Walker and Kentridge1995). For our framework, this is only natural, even trivial, because RTs are directly based on the number of fixations. For item-based accounts though, this linearity is not so trivial, because they explain differences in search slopes through differences in covert or central selection rates that are in principle independent of eye movements. There is therefore no a priori reason for the RTs from a range of task difficulties to line up so neatly.
RTs as a function of fixation. Top: data from Young and Hulleman (Reference Young and Hulleman2013). Bottom: simulated data. Open symbols: target-absent. Closed symbols: target-present. Squares: Easy search / 1–30; Circles: Medium search / 1–7; Triangles: Hard search / 1–1.
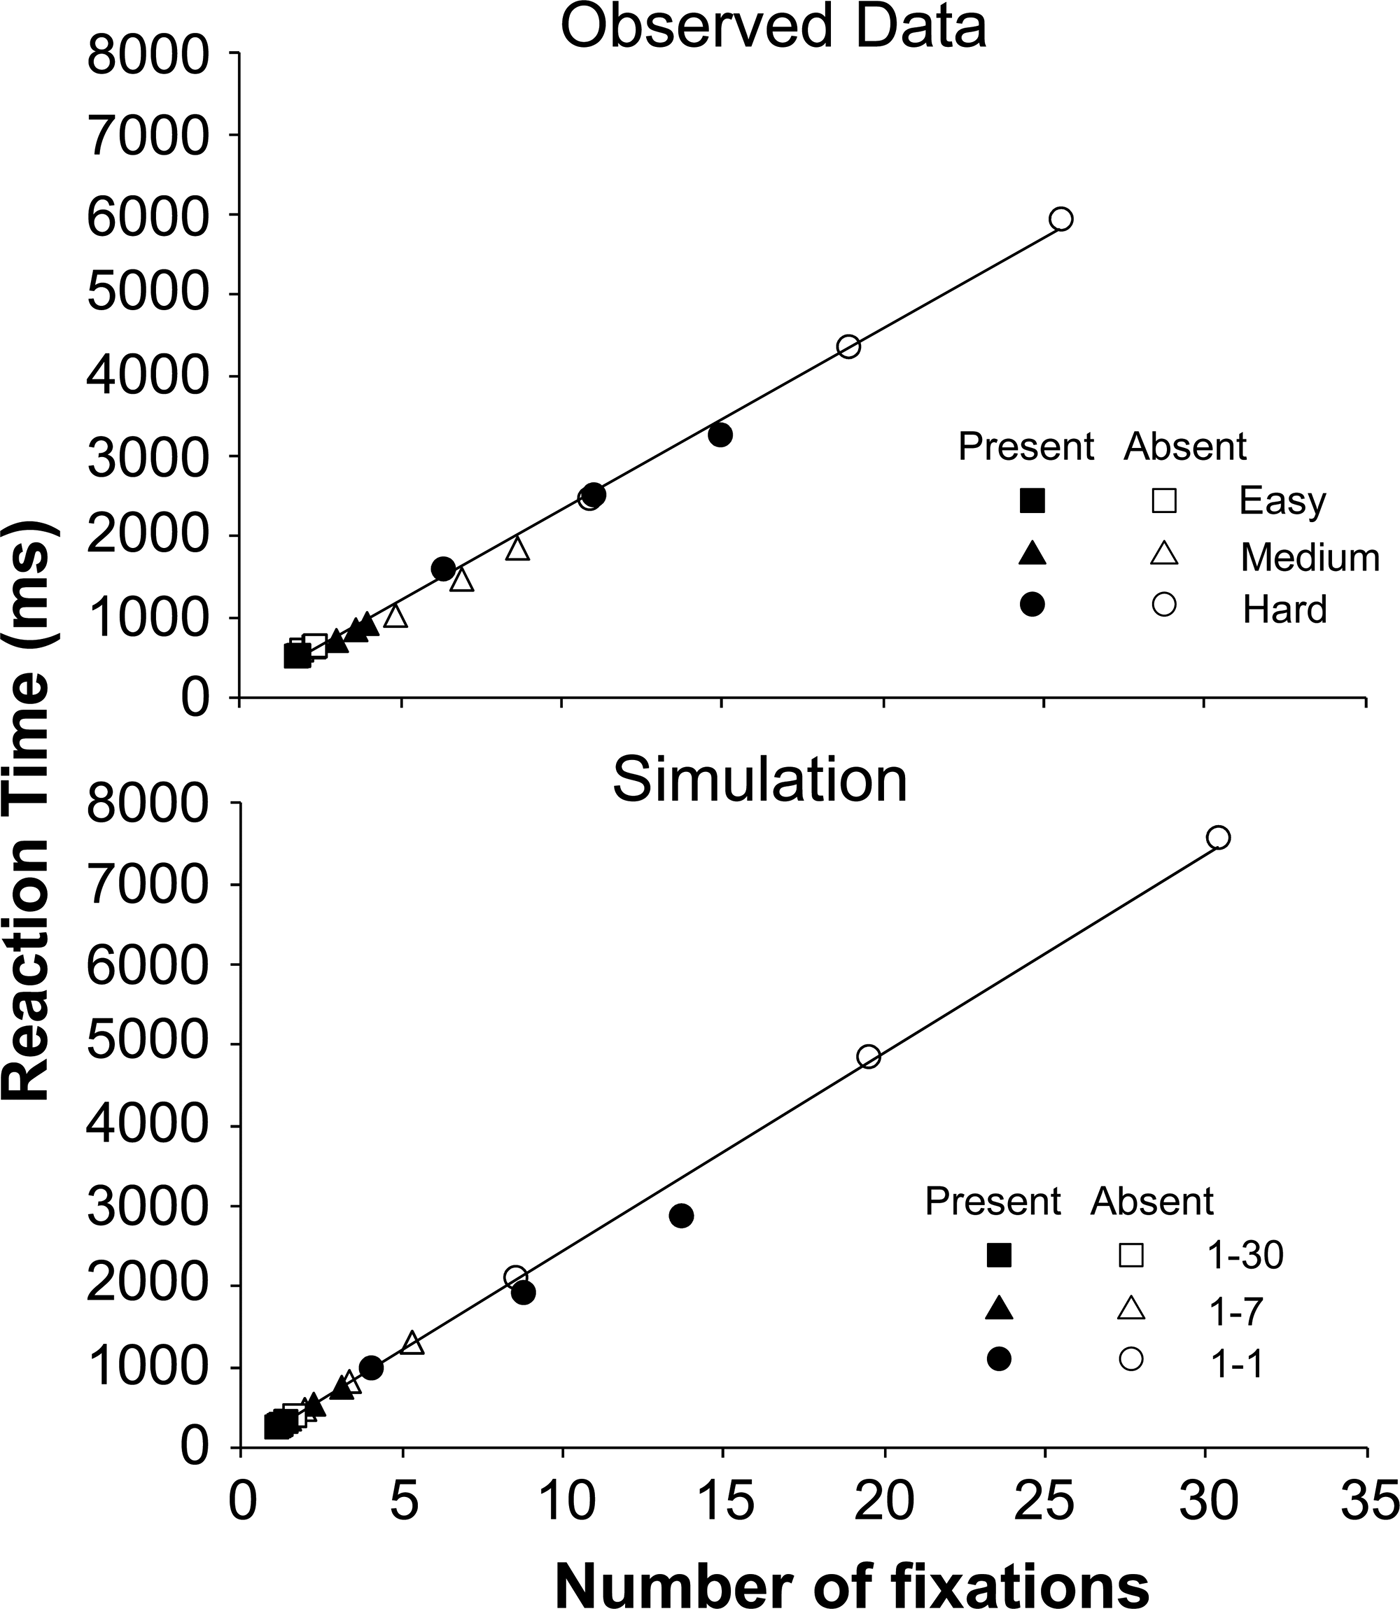
6.2. The benefits of the Functional Viewing Field
Of course, within our framework the assumption of an item-based selection rate is replaced with another assumption, namely the FVF. One could argue that we are simply robbing Peter to pay Paul. However, we believe the concept of the FVF to be more elegant for several reasons.
First – and this is our main point – the FVF allows for an integrated explanation: Search RTs are determined by the number of fixations. The number of fixations is determined by the physiological limitations of peripheral vision, in terms of both retinal resolution and neural competition in early sensory areas. In other words, rather than being limited by some central processor, search is limited by the eye.
Second, an emphasis on the FVF allows for direct links to other findings in visual perception research, such as the crowding and lateral masking literature. So far, many visual search investigators tend to avoid these phenomena. By accepting a direct link between them (as was already done by Engel Reference Engel1977; Geisler & Chou Reference Geisler and Chou1995; see also Motter & Belky Reference Motter and Belky1998b), we can start to investigate how they affect visual search. Taking into account the peripheral limits of vision might also explain part of the seemingly coarse coding of orientation in visual search (e.g., Wolfe Reference Wolfe1994): orientation discrimination thresholds increase with foveal distance even when only a single stimulus is presented (Westheimer Reference Westheimer1982). More emphasis on the FVF would likewise encompass data from Duncan and Humphreys (Reference Duncan and Humphreys1989). In addition to reducing the grouping which allows distractors to be rejected simultaneously (as suggested by Duncan & Humphreys Reference Duncan and Humphreys1989), increased target-distractor similarity probably renders peripheral detection of the target more difficult, thus reducing the FVF and increasing the need to foveate items more closely. This increases the number of fixations needed to cover the display and therefore the RTs. Similarly, increasing the similarity between distractors increases homogeneity, making peripheral targets more discriminable. This increases the FVF and thereby reduces the need for eye movements and decreases RTs. In this sense, the FVF could be seen to implement Duncan and Humphreys' (Reference Duncan and Humphreys1989) original idea of “structural units”: groups or chunks of visual objects defined at different scales that constitute the input to the search process.
Third, differences in FVF size explain the difference in robustness against item motion between medium search and hard search (Hulleman Reference Hulleman2010). Larger FVFs offer protection against item motion in at least two ways. First, in larger FVFs, multiple items are processed simultaneously, so any re-inspection of an item that moved from a previously fixated location to the currently fixated one does not incur that much of an RT-cost. Second, because larger FVFs yield fewer fixations, there will be fewer re-inspections to begin with. When the FVF contains only a single item, both types of protection disappear. When an item is re-inspected, there is a substantial RT cost, and because many more fixations are needed when only a single item is processed in the FVF, these re-inspections are more likely to occur.
Fourth, it allows us to move on from using visual search to diagnose which visual properties deserve special feature status (a research line to which we happily contributed ourselves, e.g., Hulleman et al. Reference Hulleman, Te Winkel and Boselie2000; Olivers & Van der Helm Reference Olivers and Van der Helm1998 and, though dwindling, is still ongoing see e.g., Li et al. Reference Li, Bao, Pöppel and Su2014). Assigning feature status implies a binary classification according to which the visual property either is or is not available for guiding attention (as implemented in separate feature maps). Guidance is then expressed through shallow search slopes. We do not argue against the existence of basic features, and the original guiding features such as colour and orientation have clear connections to cortical architecture. However, the criterion of flat search slopes has yielded a wide variety of candidates, some quite unlikely (e.g., pictorial depth cues, shading, see Wolfe & Horowitz Reference Wolfe and Horowitz2004 for a complete overview). Wolfe and Horowitz (Reference Wolfe and Horowitz2004) therefore argued that flat search slopes should not solely determine feature status. After applying further criteria, Wolfe and Horowitz (Reference Wolfe and Horowitz2004) accorded undoubted feature status only to colour, motion, orientation and size.
FVFs allow for a wider range of visual characteristics to come into play. By accepting the FVF as the major delimiter, the question as to what is a feature can be replaced by what is detectable from the corner of the eye. This is likely to correlate with the existing feature rankings, but allows for more flexibility, as detectability will improve with any sufficiently large difference signal relative to the surround, whether feature-based, conjunction-based, or based on more widely sampled statistics. Thus, where Guided Search explicitly dissociates guidance from discriminability (Wolfe Reference Wolfe and Gray2007), the FVF account predicts that any discriminable property can be used for guidance, even Ts amongst Ls. Flat search slopes no longer confer special status, but simply indicate that a particular discrimination is easy (or target-distractor similarity is low, cf. Duncan & Humphreys Reference Duncan and Humphreys1989). Moreover, factors such as relative size (scaling) are also naturally allowed into the equation. Instead of the binary distinction between features and non-features, FVFs thus offer a continuous spectrum of search performance.
Finally, we tentatively propose that the concept of an FVF also allows for a more integrated explanation of semantic biases in search through scenes. Research has indicated that participants are able to bring to bear their knowledge of scenes when they have to search for a particular item (e.g., a pan in a kitchen, Henderson & Hollingworth Reference Henderson and Hollingworth1999; Wolfe et al. Reference Wolfe, Alvarez, Rosenholtz, Kuzmova and Sherman2011a). They mainly fixate likely parts of the search display (i.e., horizontal surfaces) and avoid unlikely ones (e.g., the walls and the kitchen window). Within purely item-based approaches to visual search, where individual items are selected at a rate of 25–50 ms/item, this semantic guidance is difficult to explain. Establishing that the scene is a kitchen to begin with seems to require the painstaking collection of multiple items. Yet, research shows that very brief exposures of 50 ms are enough for scene-categorization (Greene & Oliva Reference Greene and Oliva2009). To account for this fast scene categorization an entirely separate pathway for the parallel processing of scene information has been invoked to bring search of scenes within the purview of models of “classic” search like Guided Search (e.g., Wolfe et al. Reference Wolfe, Võ, Evans and Greene2011b). This pathway rapidly determines the scene type, and then passes on this information to bias the search process in the other pathway via semantic and episodic guidance towards likely spatial locations. Yet the underlying search mechanism has not changed. Individual items are still selected as candidate targets. A separate parallel scene pathway is unnecessary for a fixation-based account like the one proposed here. The FVF already assumes parallel processing, and allows for the extraction of global information on the basis of image statistics, at the very first fixation. While the underlying computations would remain similar, different types of information will yield different FVFs. Whereas the FVF for an individual object in a scene may be small, the FVF for recognizing the scene as a whole is likely to be much larger. Thus, the same computations across a smaller FVF that allow the decision that a T is present in a display full of L's may be used across a very large FVF to establish that this is a forest scene rather than a city scene, or that an animal is likely to be present rather than a car (c.f. Thorpe et al. Reference Thorpe, Fize and Marlot1996). An interesting question for the future, then, is the precedence of various FVFs for different types of information.
6.3. Can item-based models not be easily adapted?
We believe extending item-based models to include eye movements will be challenging. Note that Guided Search, as the most important and developed proponent of item-based search, goes quite a long way in trying to maintain the individual item as the core of the search process: It postulates a separate global scene processing pathway in order to preserve the item processing pathway, it assumes a selection bottleneck to connect fast item selection at the front-end to slow item processing at the back-end, and it considers eye movements at best as the reason that there is such a slow item processing bottleneck. Moreover, the separation of item selection from item processing that has been implemented with the car wash mechanism of Guided Search 4.0 (Wolfe Reference Wolfe and Gray2007) creates problems when eye movements are taken into account. Important differences emerge between the item that enters the processing stream first (the processing of which will be nearing completion by the time of the next fixation) and the item that enters last (the processing of which will only just have started). For example, an experiment reported by Henderson and Hollingworth (Reference Henderson and Hollingworth1999) suggests that the representation of an item deteriorates once it is no longer fixated. Participants were less likely to detect a change made to an item during a saccade if the item in question had been fixated immediately before the saccade. If items are selected sequentially, this deterioration of representation would affect the most recently selected item much more than the item selected first. Moreover, single-cell recordings in the lateral intraparietal area of monkeys (Kusunoki & Goldberg Reference Kusunoki and Goldberg2003) show a reduction in sensitivity of the receptive field even before a saccade is made. This finding suggests that the representation of items might already deteriorate towards the end of the fixation. Again this implies that, if items were selected sequentially, items that enter the processing stream early will have an advantage over those that enter the processing stream late. An approach based on fixations as proposed here allows these selection order problems to be circumvented, because all items, in principle, are selected and processed simultaneously. A further simplification offered is that selection time, processing time and dwell time are all allowed to be identical and equal to the fixation duration. In other words, our framework makes additional assumptions about the role of central selection bottlenecks redundant.
6.4. What about covert search (when the eyes are kept still)?
It might seem that our account is fundamentally flawed simply because it is possible to complete visual search tasks without eye movements, and results seem identical when corrected for peripheral limitations. There are several answers to this objection. First, our account takes fixations as units, not eye movements, and every search includes at least one fixation. Our simulation allows for target-present responses during the first fixation. Figure 7 shows that most of the target-present responses in easy search did not involve a second fixation, and even for hard search there are trials with only one fixation. For easy search there are also many target-absent responses that do not involve eye movements. However, it is indeed the case that medium and hard search typically involve multiple fixations.
Second, and more important, crucial to our fixation-based framework are the presumed limitations of the FVF (which under normal circumstances lead to eye movements), not the eye movement per se. Thus, even if no eye movement is made, the non-homogeneity of the visual field in terms of attention and lateral masking is still very likely to influence selection. Even if targets can in principle be detected from the corner of the eye when eye movements are not allowed, it is still likely that detection takes longer or becomes more erroneous when targets become less discriminable and set sizes increase. In fact, the argument that search can proceed covertly at a level equivalent to overt search when displays are corrected for peripheral limitations implies that usually covert search is much harder. Related to this, one reason why participants may choose to make eye movements in the first place is that although they could perform a particular task far into the periphery, it might simply be more comfortable or more efficient to make an eye movement that moves the area of scrutiny closer to the fovea, even though this in itself might take some time (Findlay & Gilchrist Reference Findlay, Gilchrist and Underwood1998). Thus, search with and without eye movements may be similar because they are driven by the same FVF.
Some results appear to support this contention. For example, Klein and Farrell (Reference Klein and Farrell1989) compared search performance with and without eye movements. Although search latencies were nearly identical, analyses of the error patterns showed that, without eye movements, participants encountered difficulties with the larger display size, particularly on target-absent trials, where error rates doubled. Thus, it appears that although the task could be performed in principle, targets did become harder to discriminate when eye movements were not allowed. Zelinsky and Sheinberg (Reference Zelinsky and Sheinberg1997) found little difference in error rates between the fixed-eye condition and the free-eye condition for their difficult search tasks. However, this time the fixed-eye condition yielded faster RTs, especially for the largest display size. One reason for the relative disadvantage in the free eye movement condition may lie in saccadic suppression, the loss in visual sensitivity during an eye movement (e.g., Volkman et al. Reference Volkman, Riggs, White and Moore1978). Another may be the more widely spaced displays used, which contained a relatively large number of items. Although all items may then in principle be visible initially from the central fixation point, once observers make an eye movement to an area at one end of the display, they lose acuity (and conspicuity) for the items at the other end, potentially to the point that the target is no longer discriminable, making further eye movements necessary. If so, making one eye movement likely results in making more. Thus, whether free viewing provides a benefit or a cost depends on the design of the display, which determines the FVF (see also Findlay & Gilchrist Reference Findlay, Gilchrist and Underwood1998, for a similar point).
6.5. Does this FVF approach make any predictions at all?
One criticism of our approach might be that it does not make any predictions beyond the simple observations that if search takes long, the FVF must have been small and if search is fast, the FVF must have been large. It does not contain an independent mechanism that predicts the size of the FVF.
Our first response to this is that it is not our aim to present a mechanistic model. Rather, we present a conceptual framework, to open up different ways of thinking about visual search, and the important new questions this raises – together with a conceptual demonstration that it works. Indeed, clearly, what determines the size of the FVF is one of the main questions arising from the framework. But equally clearly, this is not a question that easily follows from an item-based approach, in which the main questions are about the way individual items are processed.
Second, our approach does identify where to expect the largest differences. For example, a direct prediction of the model is that there should be qualitative differences between hard search on the one hand, and easier search on the other. Some we already identified here: robustness against motion, the influence of peripheral information, the relation between number of fixations and number of items, and the pattern of RT distributions. Others have yet to be explored (e.g., the effects of age-dependent changes in the size of the FVF; Ball et al. Reference Ball, Beard, Roenker, Miller and Griggs1988; Sekuler et al. Reference Sekuler, Bennett and Mamelak2000).
Third, existing item-based approaches do not escape circularity themselves. For example, whether a particular property is a feature or not is determined by the search slope. In AET, search efficiency is determined by target-distractor and distractor-distractor similarity, which so far have been only been expressed through changes in the search slopes, rather than on the basis of independent data or a particular mechanism (with Treisman, Reference Treisman1991, as an exception). It actually could be argued that an approach based on FVFs holds the best promise for an escape from circularity, because there is a direct correlation between search slopes and the outcome of single fixation detection tasks outside search (Engel Reference Engel1977; Geisler & Chou Reference Geisler and Chou1995).
6.6. Remaining questions and future directions
Simple and naïve as our framework is, it points out some clear areas of further research. As alluded to above, the first knowledge gap that needs filling-in is what determines the size of the FVF during search. Why do some tasks have larger FVFs than others? This is an important question, especially because it seems likely that the factors that determine FVF size will be closely intertwined with the way target-presence is determined within the FVF. In our simulation, the difficulty of the search task was assumed, but preferably the assessment of task difficulty should be based on properties of the search display. In pixel-based approaches, this problem is computationally tractable. For example, in TAM (Zelinsky Reference Zelinsky2008) task difficulty is determined from the search display by establishing how much more target-like the most promising area of the search display is relative to other areas. If the difference is large, the search task is easy and large eye movements can be made. If it is small, the search task is difficult and smaller eye movements should be made. Presumably, a more homogeneous distractor set will make the target area stand out more, in line with the central role that target-distractor similarity and distractor-distractor similarity play in AET (Duncan & Humphreys Reference Duncan and Humphreys1989). Thus, TAM provides a promising avenue for independently assessing discriminability.
A different approach with similar outcome may be the computation of summary statistics across the items in a fixated patch of the display, as suggested by Rosenholtz et al. (Reference Rosenholtz, Huang and Ehinger2012a). These summary statistics allow the visual system to establish whether the patch contains a target or not. A salient target against a homogeneous background will create a reliable deviation in the summary statistics, while a weak signal against a noisy background will deliver unreliable statistics. More reliable signals allow for larger patches to be sampled, and thus larger FVFs. As mentioned earlier, some types of search tasks require more than can be delivered by large FVFs alone, as a specific target property is required (i.e., its exact location or independent response feature). This means that FVF size may be dynamic, changing on-line from large when the target has to be acquired to small when a specific aspect of the target has to be reported. Such changes have yet to be explored.
A related question is how the next fixation location is selected. In our simulation, it was simply assumed that new items would be selected. Determining the next location to be selected may depend on many different factors, but here eye movement models have a clear advantage over RT-models, because they are specifically designed to describe eye movement patterns. In fact, there already are several candidate mechanisms differing in the way they choose the next location. For example, TAM (Zelinsky Reference Zelinsky2008) computes the correlation between a target-template and each pixel in the search display. This correlation will be highest for the pixel at the centre of the target, but other positions can also have high correlations. The next fixation location is determined by computing the average position of all of the correlations. By increasing the minimum correlation that is required to contribute towards this average, fewer and fewer pixels will contribute and the average position starts to move towards the target. When the average position exceeds a distance threshold from the current fixation location, a saccade is triggered. So, fixation positions are chosen based on the most likely target candidate. However, fixations do not necessarily fall on an item, because the average of all contributing pixels in the display does not necessarily coincide with an item.
In a different approach, the ideal searcher of Najemnik and Geisler (Reference Najemnik and Geisler2008) computes the probabilities that the target is located at a number of candidate locations, by correlating the locations with a target template. It determines the optimal next fixation location by trying to maximize the possibility of identifying the target after the next fixation, taking into account the current probabilities and acuity limitations. Therefore, fixation locations are chosen based on which location will be most useful in the subsequent decision where the target is, rather than the current most likely target location. A related suggestion comes from Pomplun et al. (Reference Pomplun, Reingold and Shen2003; Pomplun Reference Pomplun and Gray2007) who proposed the Area Activation Model (AAM). AAM computes the relative informativeness for each fixation position, by taking a weighted sum of all of the surrounding guiding features. The informativeness depends on search task difficulty, with a larger area of the display contributing to the informativeness measure when the task is easier. The resulting map has several peaks of informativeness, which do not necessarily coincide with individual items but could fall in between. The first saccade will go to the highest peak, the next saccade will then go to the nearest non-visited peak.
Both TAM and AAM make allowances for the difficulty of the search task when choosing the next fixation location. But an interesting aspect of AAM is that it rejects groups of items when the group of items contributing to the informativeness peak does not contain the target. This makes AAM more compatible with our proposed framework than TAM, where always only a single item is matched to the target template and inhibited when it turns out to be a distractor, irrespective of the difficulty of the search task.
The third question is how trials are terminated when no target has been found. All models of visual search, including the framework presented here, seem to be much better at describing target-present trials than target-absent trials. Because for many critical tasks the consequences of a miss are much more severe than the consequences of a false alarm (X-rays and CT-scans, airport security screening), it is also from an applied point of view vital to understand target-absent decisions better. Target-absent decisions not only influence the RTs for target-absent trials, but also the error rates on target-present trials. Both of these areas are amongst the weaker aspects of the framework we have presented here. They are amongst the weaker aspects of mechanistic models (e.g., Guided Search) too and some leave out target-absent trials altogether (TAM; Zelinsky Reference Zelinsky2008, but see Zelinsky et al. Reference Zelinsky, Adeli, Peng and Samaras2013). Multiple triggers for the target-absent decision have been proposed (number of items inspected, time spent searching the display, success of previous target-absent response, frequency of target-presence; see also Chun & Wolfe Reference Chun and Wolfe1996), but they all seem to be weighed at different rates at different times, without a clear ranking of their importance. Any simple model of target-absent decisions (and, therefore, any simple model of visual search) seems doomed to fail in its attempt to capture the essence of target-absent decisions, especially when the entire spectrum of search difficulty has to be taken into account. This is demonstrated by our simulations. Our simple stopping-criterion terminated medium searches too early, but at the same time let them continue too long in both easy and difficult search. At the very least, this suggests that participants do weigh the difficulty of the search task in their target-absent decision. In that sense, future mechanistic models can be improved by letting task difficulty not only shape the search process by determining the size of the FVF, but also by changing the criteria for terminating a search when the target has not been found.
Finally, some of the most exciting areas in visual search are tasks in medical imaging (does this mammogram contain a suspicious lesion) and in airport security (does this bag contain a threat). Although these areas have seen considerable interest from fundamental cognitive psychology (Donnelly et al. Reference Donnelly, Cave, Welland and Menneer2006; Drew et al. Reference Drew, Evans, Võ, Jacobson and Wolfe2013a; Reference Drew, Võ, Olwal, Jacobson, Seltzer and Wolfe2013b; Reference Drew, Võ and Wolfe2013c; Evans et al. Reference Evans, Birdwell and Wolfe2013a; Godwin et al. Reference Godwin, Menneer, Cave and Donnelly2010; Menneer et al. Reference Menneer, Barrett, Phillips, Donnelly and Cave2007; Wolfe et al. Reference Wolfe, Horowitz and Kenner2005; Reference Wolfe, Brunelli, Rubinstein and Horowitz2013), they have been underserved by item-based models (or any form of overarching theory of search, for that matter), not least because it is difficult to determine how many items the kind of images typically used actually contain. Moreover, the kind of target that needs to be found (“threat,” “lesion”) also sits uncomfortably with an item-based approach, because they can take on a multitude of fuzzy forms and are therefore difficult to capture in a target-template. Models are necessarily tested by deriving predictions from them. Item-based models will make item-based predictions and it is therefore only natural that many lab-based experiments use displays with clearly defined items. Unfortunately, this has opened up a gap with real-world tasks that is only now beginning to be bridged. We believe that by emphasising the role and importance of fixations, this bridging process will be sped up, because it focuses on a factor that lab-tasks and real-world tasks have in common. We hope that our proposed framework can be a starting point, which allows the exploration of the many factors that influence real-world tasks (experience, time pressure, age, target-prevalence, training, unknown number of targets, complex backgrounds) while at the same time providing a foundation for more fundamental research into the processes underlying visual search, bringing real-world tasks and lab tasks closer together.
7. Conclusion
Our simulation has demonstrated that a fixation-based framework shows considerable promise as an integrated account of visual search, and allows for the abandonment of some of the implicit assumptions that have dominated the field for decades. It reveals how an acknowledgement of the functional visual field and the adoption of the number of fixations (rather than the number of items) as the driver of RTs yield a surprisingly adequate description of various aspects of visual search behaviour. Although the conceptual nature of the framework is an obvious weakness, it is also a core strength: Exactly because the framework does not specify the details of the mechanisms involved in visual search, it allows a clearer view of the explanatory power of the underlying principles.
ACKNOWLEDGMENTS
The title of this paper was inspired by Ralph Haber's (Reference Haber1983) “The impending demise of the icon: The role of iconic processes in information processing theories of perception” (in Behavioral and Brain Sciences 6:1–11). This work was funded by Leverhulme Trust grant F/00 181/T awarded to JH, and by ERC Consolidator Grant 615423 awarded to CNLO. We thank Jan Theeuwes, Martijn Meeter, Andrew Hollingworth, Ruth Rosenholtz, and Derrick Watson for reading an early version of the manuscript, as well as four anonymous reviewers. We would also like to thank Jeremy Wolfe for making his data available.




Target article
The impending demise of the item in visual search
Related commentaries (30)
An appeal against the item's death sentence: Accounting for diagnostic data patterns with an item-based model of visual search
Analysing real-world visual search tasks helps explain what the functional visual field is, and what its neural mechanisms are
Chances and challenges for an active visual search perspective
Cognitive architecture enables comprehensive predictive models of visual search
Contextual and social cues may dominate natural visual search
Don't admit defeat: A new dawn for the item in visual search
Eye movements are an important part of the story, but not the whole story
Feature integration, attention, and fixations during visual search
Fixations are not all created equal: An objection to mindless visual search
Gaze-contingent manipulation of the FVF demonstrates the importance of fixation duration for explaining search behavior
How functional are functional viewing fields?
Item-based selection is in good shape in visual compound search: A view from electrophysiology
Looking further! The importance of embedding visual search in action
Mathematical fixation: Search viewed through a cognitive lens
Oh, the number of things you will process (in parallel)!
Parallel attentive processing and pre-attentive guidance
Scanning movements during haptic search: similarity with fixations during visual search
Searching for unity: Real-world versus item-based visual search in age-related eye disease
Set size slope still does not distinguish parallel from serial search
Task implementation and top-down control in continuous search
The FVF framework and target prevalence effects
The FVF might be influenced by object-based attention
The “item” as a window into how prior knowledge guides visual search
Those pernicious items
Until the demise of the functional field of view
What fixations reveal about oculomotor scanning behavior in visual search
Where the item still rules supreme: Time-based selection, enumeration, pre-attentive processing and the target template?
Why the item will remain the unit of attentional selection in visual search
“I am not dead yet!” – The Item responds to Hulleman & Olivers
“Target-absent” decisions in cancer nodule detection are more efficient than “target-present” decisions!
Author response
On the brink: The demise of the item in visual search moves closer